Deep Galaxy survey at 6.75m with the ISO satellite. ††thanks: Based on observations with ISO, an ESA project with instruments funded by ESA Member States (especially the countries: France, Germany, the Netherlands and the United Kingdom) with the participation of ISAS and NASA.
Abstract
Deep 6.75m mid-IR ISOCAM observations were obtained of the Canada-France Redshift Survey (CFRS) 1415+52 field with the Infrared Space Observatory. The identification of the sources with optical counterparts is described in detail, and a classification scheme is devised which depends on the S/N of the detection and the inverse probability of chance coincidence. 83% of the 54 ISOCAM sources are identified with 23.5 counterparts. The colors, radio properties, spectrophotometric properties and frequency of nuclear activity of these counterparts differ on average from those of typical CFRS galaxies. CFRS spectra are available for 21 of the sources which have I (including 7 stars). Most of the strongest sources are stars or AGN. Among the non–stellar counterparts with spectra, 40% are AGNs, and 53% are galaxies that display star formation activity and/or significant contributions of A stars. The ISOCAM sources also display an IR excess, even when compared with heavily-reddened local starburst galaxies. An upper limit of 30% of extragalactic ISO sources could be at of the 44 sources which are non-stellar (7 ”spectroscopic” and 3 ”photometric” stars excluded).
Key words: galaxies: catalogue - galaxies: active - galaxies: observations - infrared: galaxies
1 Introduction
Very little is known about the mid-IR (5 40m) properties of distant galaxies, wavelengths which should probe their dust content and star formation activity. IRAS data established that mid-IR emission from the interstellar medium and from nearby star forming galaxies is dominated by emission from Very Small grains and polycyclic aromatic hydrocarbon molecules (PAHs) which have fluctuating temperatures under single photon absorption, whereas classical grains are in thermal equilibrium and emit at longer wavelengths (Helou 1986). However, the precise nature of PAHs remains open (Puget & Léger 1989). Differences in mid-IR features among various galaxies can be attributed to differing amounts of dust, broad emission interpreted as due to PAHs or Unidentified Infrared Bands (UIBs) carriers. The PAH and very small grains appear to be responsible for 30% of the total IR emission in normal galaxies, but in active galactic nuclei, the mid-IR emission is believed to arise from a dusty torus around the active nucleus where PAHs are destroyed (Edelson & Malkan 1986, Roche et al. 1991, Helou et al., 1991).
In order to study the mid-IR emission from high redshift galaxies, deep ISO (Infrared Space Observatory, Kessler et al. 1996) observations were made of the CFRS field at 1415+52. Extensive spectroscopic and and photometric data already exist (Lilly et al. 1995a,b) for galaxies in this field, as well as data from a deep (S 16 Jy) radio survey by Fomalont et al. (1991). The high spatial resolution in the micro-scanning mode, combined with the good sensitivity of CAM (Césarsky et al. 1996) allows mid-IR maps of high redshift field galaxies to be made for the first time. Even so, precise identification of faint ISO sources with such galaxies is difficult, owing to their faintness and to the inherent uncertainties in the source positions.
The layout of this paper is as follows; Sect. 2 presents the observational and data reduction strategy; Sect. 3 gives a description of the catalogue, astrometry and identification of optical counterparts. In Sect. 4 the photometric and spectrophotometric properties of the ISO objects are discussed. Section 5 summarizes the results of the identification procedure and, finally, our conclusions about the faint mid-IR sources are discussed in Sect. 6.
The nature of 6.75m sources and their energy distribution from UV to radio wavelengths will be fully discussed in a forthcoming paper (Flores et al, 1998), which will also present the 15m data.
2 Observations and data reduction
A region centered on the CFRS 1415+52 field was observed with ISO in a raster pattern such that a constant exposure time per pixel was achieved over the whole 10′ 10′ CFRS field. Given the small size of this field, it was decided to go as deep as possible with ISOCAM at 6.75m, partly so that the results could be used as a possible template for the ISOCAM Central Program for deep surveys (Césarsky et al. 1996), as well as for other large surveys.
Eleven individual images were taken in the micro scanning AOT mode (CAM01, a raster of 44 with 8 or 12 readouts per step ) with the ISOCAM LW channel (6′′ per pixel) and the LW2 filter ( 5–8.5m), leading to a total integration time of 600 sec pixel-1. The micro scanning mode provides the best spatial resolution through superposition of images. The same pixel of the sky was placed in different parts of the camera in order to minimize and detect any systematic effects. The micro scanning AOT technique also allows an accurate flat-field image to be generated and yields a pixel size of 15 in the final integrated image. The detection and removal of transients and glitches, integration of images, absolute flux calibration, and source detection were carried out using the method described by Désert et al. (1998). This method has been found to be particularly well adapted to our observational strategy i.e. coadding the eleven images, without redundancy within each image. Special attention was paid to possible error propagation in the flux values. Finally, to further detect and eliminate relatively weak (S/N3) spurious sources, the data were also reduced with the CIA PRETI software (Aussel et al. 1997 and Starck et al. 1998) and compared with the initial results. However latter software is less adapted to our data since we have generated several images the micro scanning technique, and glitch removing is more difficult. It is beyond the scope of this paper to compare the two data reduction procedures in order to estimate the photometric accuracy, and this question is addressed elsewhere (Desert et al., 1998). On the other hand, sources which have not recovered with PRETI software will not be further considered (sect. 2.1)
Individual images were carefully registered with each other in order to optimize the image quality of the brightest compact objects (mostly stars). However, this registration is limited by the presence of glitches (defaults and cosmic rays). In order to obtain the best possible accuracy, an iterative procedure was adopted in which shifts were determined from the average of the 3–5 highest S/N sources in each of the 11 individual images and the composite image, the frames were then offset and combined to form a new composite image, and the procedure repeated three times. As demonstrated in Fig. 1, this results in a significant improvement of the shapes and FWHM of the sources. The final image (Fig. 2) of the whole ISO field has a resolution equivalent to a median FWHM11′′ (calculated with DAOPHOT under IRAF).
The precise location of the ISOCAM image relative to deep CFRS and images of the 1415+52 field was determined from the six brightest ISOCAM LW2 sources (5 stars and the z = 0.216 galaxy CFRS14.1157).
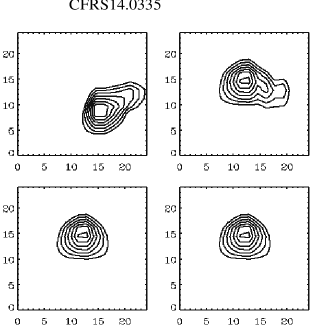
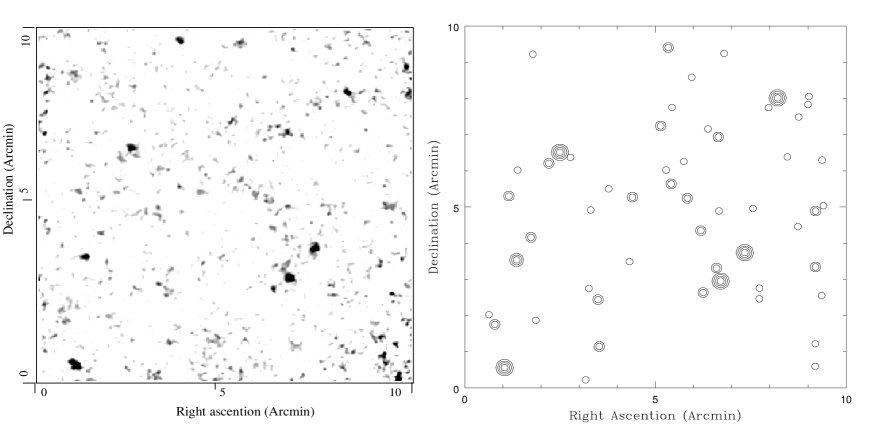
Figure 3 shows the 5–8.5 micron flux distribution corrected for aperture effects (1.4, for details, see Désert et al. 1998 and references therein).At the S/N 4 limit, our number counts (21 per 100 arcmin2) are comparable to those of the Deep ISOCAM Survey ( counts per arcmin2 for sources with a flux 250 Jy, Césarsky et al. 1998, in prep.). The validity of detection at S/N 4 is confirmed by studies in Lockman-Hole Deep Survey(Césarsky et al. 1998, in prep), which show that sources with S/N in individual frames are confirmed in 95% of cases, in the final integrated image (S/N 10)
2.1 ISO source catalogue
Classifications and verification of the source detections were made on
the basis of S/N and the repeatability of the detections in three
independent combinations of the 11 individual images (for details about
the source detection, repeatability and classification, see Désert et
al. 1998). The repeatability test is based on the redundancy factor,
which is the number of times that the sky pixel was seen by different
pixels on the camera. The software built three independent projection
subrasters, and for each source candidate the flux and error are measured at the same position in each subrasters.
The quality factor is based on flux measurements and varies from the best confidence index (=4) to the worse confidence level (=0, see eqs. 7 to 11 of Désert et al.,1998). We have considered only sources with
confidence level higher than 3, which means that the final source flux and source fluxes in subrasters are within 3 (2 in the case of 4), where is the error value of the final flux source.
The final catalogued sources were also all detected in the
image which was reduced by the second independent analysis (using
PRETI). Altogether, 54 sources with S/N3 met these criteria,
but only the subgroup of 23 sources with S/N4 are considered to
be secure detections. The 54 sources are listed in Tables 1 and 2. The
first two sections of Table 1 contain 21 ISO sources (catalogues 1 &
2) that have secure optical identifications. The 24 sources in the
lower half of Table 1 and the 9 sources in Table 2 have less secure or no optical identifications, respectively.
| ISO | CFRS | z1 | IAB | VAB | K | d3 | P4 | Flux5 | Error |
| Catalogue 1: Objects with S/N 4 & 0.02 | |||||||||
| 001 | 14.1157 | 0.220 | 20.54 | 22.45 | – | 1.97 | ∗ | 613. | 44. |
| 004 | 14.0098 | star | 16.44 | 14.66 | – | 2.08 | 0.0000583 | 601. | 57. |
| 007 | 14.1400 | star | 15.61 | 16.13 | – | 3.73 | 0.0004195 | 329. | 35. |
| 017 | 14.0138 | star | 15.77 | 16.80 | 15.43 | 4.08 | 0.0005019 | 267. | 35. |
| 023 | 14.0335 | star | 14.77 | 17.98 | – | 1.45 | 0.0000284 | 299. | 37. |
| 031 | 14.1265 | star | 15.60 | 17.63 | 14.87 | 1.41 | 0.0000600 | 312. | 32. |
| 035 | 14.9025 | 0.155 | 18.38 | 19.15 | – | 1.45 | ∗ | 173. | 33. |
| 108 | 14.1134 | star | 16.45 | 18.47 | – | 1.53 | 0.0001570 | 199. | 36. |
| 163 | 14.0198 | 1.603 | 20.04 | 20.21 | 19.86 | 1.79 | 0.0051602 | 156. | 33. |
| 209 | 14.0685 | star | 17.19 | 17.93 | 17.23 | 4.58 | 0.0031149 | 155. | 31. |
| 223 | 14.0836 | — | 15.91 | 17.17 | – | 3.96 | 0.0004729 | 164. | 37. |
| 315 | 14.9154 | 0.812 | 21.57 | 23.06 | – | 3.51 | ∗ | 164. | 33. |
| 366 | 14.0051 | — | 17.55 | 18.76 | – | 1.57 | 0.0003665 | 139. | 32. |
| Catalogue 2: Objects with S/N 4 & 0.317 0.02 | |||||||||
| 114 | 14.0112 | — | 23.53 | 24.86 | 20.61 | 2.96 | 0.1421836 | 151. | 34. |
| 130 | 14.1565 | — | 20.98 | 23.29 | 19.38 | 6.91 | 0.0741998 | 174. | 38. |
| 136 | 14.1042 | 0.875 | 21.49 | 23.38 | 19.79 | 4.93 | 0.0831932 | 126. | 31. |
| 242 | 14.9907 | — | 22.95 | 19.41 | – | 4.77 | 0.1646952 | 192. | 36. |
| 276 | 14.0972 | 0.674 | 21.17 | 21.99 | 20.34 | 3.05 | 0.0326979 | 137. | 32. |
| 297 | 14.1567 | 0.479 | 19.79 | 20.04 | 18.62 | 5.46 | 0.0215114 | 189. | 36. |
| 465 | 14.1129 | — | 21.05 | 22.35 | 20.30 | 10.11 | 0.3059948 | 148. | 34. |
| 477 | 14.0287 | — | 22.29 | 24.19 | 19.98 | 2.77 | 0.0588822 | 164. | 32. |
| Catalogue 4: Objects with 4 S/N 3 & 0.02 | |||||||||
| 097 | 14.1139 | 0.660 | 20.20 | 21.49 | 18.92 | 0.51 | ∗ | 115. | 34. |
| 178 | 14.1329 | 0.375 | 20.60 | 19.52 | – | 9.42 | ∗ | 109. | 33. |
| 187 | 14.0573 | 0.010 | 16.90 | 17.09 | 17.53 | 3.33 | ∗ | 124. | 32. |
| 188 | 14.0667 | — | 20.17 | 19.48 | 18.92 | 9.09 | ∗ | 131. | 40. |
| 196 | 14.1080 | 0.066 | 20.34 | 20.68 | – | 1.38 | 0.0030702 | 112. | 37. |
| 403 | 14.1303 | 0.985 | 19.97 | 19.88 | 19.25 | 2.25 | ∗ | 113. | 34. |
| 461 | 14.0861 | — | 23.02 | 23.52 | 20.23 | 9.51 | 0.0000640 | 107. | 35. |
| Catalogue 5: Objects with 4 S/N 3 & 0.317 0.02 | |||||||||
| 032 | 14.1598 | — | 19.84 | 21.00 | – | 6.32 | 0.0287157 | 173. | 47. |
| 055 | 14.1561 | — | 19.55 | 20.06 | – | 10.83 | 0.0819987 | 213. | 59. |
| 064 | 14.1563 | — | 22.78 | 23.56 | – | 5.84 | 0.2364296 | 201. | 55. |
| 189 | 14.0896 | — | 22.40 | 23.06 | – | 4.96 | 0.1768200 | 103. | 33. |
| 189 | 14.0876 | — | 23.57 | 24.53 | – | 4.47 | 0.2951362 | 103. | 33. |
| 215 | 14.1534 | — | 23.46 | 23.86 | – | 2.05 | 0.0709211 | 113. | 35. |
| 221 | 14.1517 | — | 22.92 | 22.93 | – | 6.73 | 0.3010899 | 127. | 42. |
| 228 | 14.1330 | — | 20.74 | 20.95 | – | 4.16 | 0.0275558 | 113. | 35. |
| 241 | 14.0400 | — | 21.42 | 22.57 | 20.56 | 7.65 | 0.1887201 | 116. | 38. |
| 285 | 14.1491 | 0.602 | 21.75 | 23.85 | – | 6.12 | 0.1252796 | 112. | 34. |
| 313 | 14.0497 | 0.797 | 21.69 | 22.79 | 20.59 | 6.16 | 0.1268137 | 122. | 34. |
| 331 | 14.0956 | — | 22.88 | 23.41 | 20.73 | 4.90 | 0.1729592 | 112. | 37. |
| 334 | 14.1615 | — | 20.89 | 22.04 | 19.64 | 8.91 | 0.1203090 | 101. | 33. |
| 334 | 14.1602 | — | 21.19 | 21.90 | 20.05 | 6.81 | 0.1527288 | 101. | 33. |
| 363 | 14.1002 | — | 21.10 | 21.44 | – | 7.61 | 0.1869484 | 107. | 35. |
| 379 | 14.1444 | 0.742 | 22.25 | 23.88 | 20.13 | 4.24 | 0.1325431 | 118. | 35. |
| 419 | 14.0019 | — | 23.15 | 23.42 | – | 2.80 | 0.1282332 | 130. | 35. |
| 444 | 14.1609 | — | 18.93 | 20.83 | 18.30 | 8.95 | 0.0260458 | 133. | 35. |
| 454 | 14.0224 | — | 22.57 | 23.58 | – | 5.21 | 0.1932082 | 115. | 34. |
Notes to Table 1
∗ Radiosource for which probability has been calculated from radio counts.
1 Some of these redshifts are not from the original CFRS catalogues
or were subsequently changed after further analyses: the redshift for
CFRS 14.1157 was reported as z = 1.13 by Hammer et al. (1995), and the
redshift for 14.1042 was given as z = 0.7217 by Lilly et al. (1995b).
There is still some uncertainty in both of these. “Redshifts” for the
seven stars (denoted by “ star ”) were determined from additional
spectra. “ — ” indicates that the redshift is unknown.
2 “ – ” indicates that no observation is available (spectroscopy or K
imagery)
3 Distance in arcsec between ISO source position and optical counterpart
4 Probability on non-coincidence.
5 Flux in Jy (aperture of 9′′).

3 Catalogue and Identification of Counterparts
3.1 Astrometry
To derive accurate positions of the ISO sources is limited by (a) the large pixel size (6′′) of the initial image, (b) the size of the diffraction disk (2 to 3′′), and (c) errors in the data reduction procedure (including those due to distortion corrections). The astrometric accuracy of the CFRS galaxies in 1415+52 field is 015 relative to radio positions (Hammer et al. 1995). The overall centering of the ISOCAM field was based on the positions of the 5 brightest stars and the bright CFRS14.1157 source. The resulting differences between the optical and ISO positions for all sources with counterparts (see next section) are shown in Fig. 4. All but 9 of the sources are within a radius equivalent to one pixel (6′′) in the original ISOCAM data. From comparison of the positions of optical and ISOCAM LW2 sources, the median difference is 42.

3.2 Optical counterparts
We have first compared the 6.75m frame with Jy radio sources (Fomalont et al, 1991), and have calculated the probability of a pure coincidence, assuming Poisson statistics:
| (1) |
where d is the angular distance between the ISOCAM LW3 source and the radio source in degrees and n is the integrated density of radiosources at flux ( n) = 83520 ). Six ISOCAM LW2 sources are thus identified (see Table 1) with their optical counterparts derived from Hammer et al (1995).
For all the other sources without radio counterpart we have used the band counts. All optical sources within 12′′ of an ISOCAM LW2 source have been considered. Assuming Poisson statistics, the probability density of a pure coincidence between an ISOCAM and optical source is:
| (2) |

where d is the angular distance between the ISO object and the optical source in degrees and n() is the integrated density of galaxies at magnitude from the analysis by Lilly et al. (1995c). Figure 5 shows the relationship between the S/N of the ISOCAM observation and the probability (P) that the optical source is projected by pure coincidence.
We are aware that possible non gaussian positional uncertainties related to extended emission, source confusion and residuals can affect our probability calculations for low S/N sources. As shown in Fig. 6, some sources present asymmetric shapes, and for few of them, only a part of the ISOCAM source overlaps the optical counterpart. Indeed the final noise structure is far from being gaussian, due to possible glitch residuals, and the ISOCAM position has not been corrected for possible image distortions. To calibrate our probabilities in an empirical way, we have applied a random match control test to the ISO field by rotating it by 90, 180 and 270 degrees relative to the optical image. Only 21 of the 54 ISOCAM sources are found randomly associated to an optical counterparts (22.5 and P0.02), which should be compared to the 22 P0.02 counterparts displayed in Table 1, this strengthens our probability calculations. Non gaussian cannot affect our probability calculations by more than a factor 2.
3.3 Source catalogs
As illustrated in Fig. 5, six catalogues were constructed which contain identifications of varying degrees of confidence (from 1 – highest, to 6 – no identification) according to their probability (P) and S/N ratio. Table 1 lists the identifications of ISO sources in four of the catalogues (in decreasing confidence level in each successive catalogue). The ISOCAM LW2 sources and their associated optical sources are listed in columns 1 & 2. Column (3) gives the redshift if available. In the redshift column , “star” indicates that the object has been identified spectroscopically as a star, “ – ” indicates that no redshift is available. Columns (4) (5) and (6) give the , and magnitudes (a “ — ” indicates that no photometry is available); column (7) lists the angular distance (in arcsec) between the ISOCAM source and optical counterparts; column (8) gives the associated probability of coincidence; and columns (9) and (10) give the flux at 5–8.5 m and the error (in Jy).
The 21 sources listed in catalogues 1 and 2 are considered to have secure identifications since they are relatively strong sources (S/N 4) and have a relatively low probability of chance coincidence. All but two of the counterparts have , the limit of the CFRS spectroscopic survey, and spectra are available for 13 of these counterparts.
The 24 sources in the supplementary catalogues 4 and 5 are identifications with lower S/N sources (4S/N 3). In five cases in the “least secure” catalogue 5, more than one optical counterpart is listed as possibly being associated with an ISOCAM source. In most cases, the more probable counterpart is optically brighter than, or as bright as, the alternate, providing additional evidence that it is the likely counterpart. In the following analysis we use only the “best” optical identifications (i.e., those with the lowest probability of chance coincidence), but all counterparts with a probability within a factor two of the smallest probability are retained in Table 1 for reference. Statistically, 1.5 out of the 18 sources in catalogue 5 are expected to be purely chance coincidences. As well as having fainter mid-IR fluxes, the optical counterparts of these 24 sources are also fainter optically on average (8 are fainter than ).
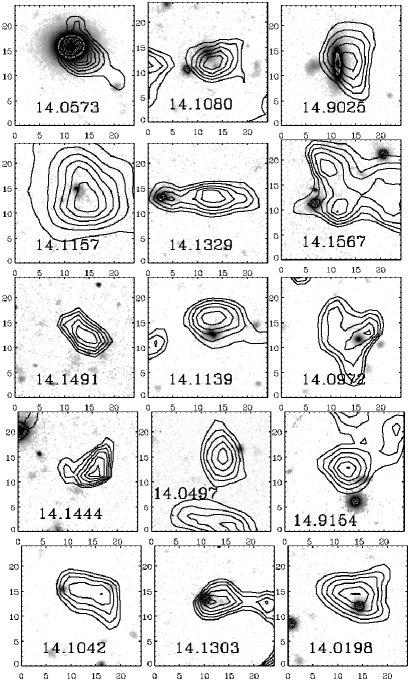
Figure 6 shows the superposition of ISOCAM LW2 source contours and the optical counterparts of 14 extragalactic sources (from catalogues 1, 2, 4 & 5) with known redshifts. The optical image was extracted from a composite image centered at the ISO position.
| ISO | Flux | Error | ||||||
|---|---|---|---|---|---|---|---|---|
| 096 | 14 | 18 | 4.2 | 52 | 26 | 27.7 | 166 | 41 |
| 375 | 14 | 17 | 51.3 | 52 | 31 | 9.9 | 141 | 34 |
| 113 | 14 | 18 | 6.1 | 52 | 28 | 8.4 | 137 | 36 |
| 119 | 14 | 17 | 41.7 | 52 | 34 | 56.4 | 128 | 38 |
| 195 | 14 | 17 | 28.4 | 52 | 29 | 55.5 | 101 | 33 |
| 257 | 14 | 17 | 33.7 | 52 | 33 | 22.2 | 113 | 35 |
| 333 | 14 | 18 | 16.3 | 52 | 34 | 55.0 | 108 | 33 |
| 369 | 14 | 18 | 19.0 | 52 | 31 | 33.7 | 115 | 34 |
| 380 | 14 | 18 | 6.7 | 52 | 25 | 29.7 | 183 | 47 |
Among the 54 ISOCAM LW2 sources with S/N 3, 9 were not identified to the limit of our combined image. Unfortunately, we have band images for only a small portion of the field, so it is not possible to determine whether all sources are visible in the near-IR and what their colors are. The positions and fluxes of the 9 “non-identified” ISO sources are listed in Table 2.
In summary, 45 of the 54 ISOCAM LW2 sources (83%) were identified with galaxies and stars on composite images () of the CFRS1415+52 field. 21 of these have secure identifications with optical counterparts (including 7 stars). As shown below, some of the visible-light properties of the 24 less secure counterparts add considerable support to their identifications. In addition to the 7 spectroscopically confirmed stars, three other sources have profiles of compact sources (stars, QSO’s, etc) on our band image, so that 10 of the 45 may be stars (although the three could also be QSOs, from B,V and I band images and colors).
4 Optical properties of ISO counterparts
4.1 Photometry
The photometric properties of the identified optical counterparts are illustrated in Figs. 7, 8 and 9. Figure 7 shows that the less secure counterparts are fainter in on average than the secure counterparts. In addition to the 17% of ISOCAM LW2 sources that have no obvious optical counterparts, the counterparts for another 18% are fainter than the limit (IAB = 22.5) of CFRS spectroscopy, and hence some of these may be at z1. Figure 8 compares the distribution of all the secure and less secure extragalactic identifications (lower panel) with the same distribution for all CFRS galaxies () (upper panel). This diagram shows that ISOCAM LW2 and CFRS sources have the same median 1), which corresponds to the color of an Sbc in the redshift range from z = 0.3 to 1. Figure 9 shows that the median of the histogram of the ISOCAM sources identified with known galaxies is 0.5 mag redder than that of CFRS galaxies, which is mag. Five of the sources (114, 331, 379, 461, 477) are ultra-red (with ). One of these is at z = 0.7, but the other four are possible high redshift objects.


4.2 Spectra
Spectra for 22 of the 45 optical counterparts of our ISOCAM LW2 sources are available in the CFRS database (including 7 stars, generally M or K stars). Several methods were used to classify the objects through their spectra and other properties: diagnostic diagrams (using OII/Hβ, OIII/Hβ, Hβ, SII/Hα, NII/Hα ratios), radio properties (Hammer et al. 1995), star formation rate (OII3727Åequivalent widths) and the Balmer index D(3550 3850) defined as (3750-3950)/(3450-3650) at rest (see Hammer et al. 1997) The latter is an indicator of recent star formation, and is very well correlated to the Hδ equivalent width. Large values of D(3550 3850) ( 0.18) indicate significant contribution of A star population (such objects are classified as ’’), suggesting a major burst of star formation some 0.5 Gyr ago. Altogether, we find: eight galaxies (Balmer index, D(3550 3850) 0.18 and/or detection of WÅ, absorption), one starburst (diagnostic diagram), four QSO and Seyfert 1 galaxies (from their continuum flux and broad lines) and two Seyfert 2 galaxies (based on the diagnostic diagrams).

| CFRS | z | C1 | MB | W | S3 | Type |
|---|---|---|---|---|---|---|
| 14.0573 | 0.010 | 4 | 16.79 | – | 19 | Seyfert 1 |
| 14.1080 | 0.066 | 4 | 17.17 | – | – | |
| 14.9025 | 0.155 | 1 | 20.34 | – | 30 | Seyfert 2 |
| 14.1157 | 0.220 | 1 | 18.55 | – | 77 | Seyfert 2 |
| 14.1329 | 0.375 | 5 | 21.41 | 15.0 | 171 | |
| 14.1567 | 0.479 | 1 | 22.31 | – | – | Seyfert 1 |
| 14.1491 | 0.602 | 5 | 20.25 | 59.0 | – | |
| 14.1139 | 0.660 | 4 | 22.27 | 19.0 | 141 | |
| 14.0972 | 0.674 | 1 | 21.50 | 40.0 | – | Starburst |
| 14.1444 | 0.742 | 5 | 20.47 | 17.0 | – | |
| 14.0497 | 0.797 | 5 | 21.28 | 29.0 | – | |
| 14.9154 | 0.812 | 1 | 21.41 | 39.0 | 55 | |
| 14.1042 | 0.875 | 2 | 21.11 | 27.0 | – | |
| 14.1303 | 0.985 | 4 | 23.48 | – | 78 | QSO |
| 14.0198 | 1.603 | 1 | 24.72 | – | – | QSO |
| Notes to Table 3: |
| (1) “Confidence catalogue” number. |
| (2) Rest frame equivalent width of OII in Å. |
| (3) S1.4GHz flux in Jy. |
The spectra, divided according to the above classifications, are shown in Fig. 10 and relevant data for these sources are listed in Table 3. The optical counterparts of the eight less secure (catalogues 4 & 5) ISOCAM sources include a large fraction (6 of 8) of galaxies. Our confidence in the reliability of the identifications is strengthened by the fact that five of them are also detected either at radio wavelength or at 15m with S/N 4 (Flores et al. 1998, submitted).

As shown in Figure 11, the median redshift of the 15 extragalactic sources is z 0.60, close to the average CFRS value (this is not too surprising since our spectroscopic sample of ISOCAM sources has the same optical flux limit as the CFRS). The two most distant objects are QSOs at z 1 and 1.6 (Schade et al. 1995). The latter has the highest redshift in this CFRS field. Most of the strongest sources with secure identifications (catalogues 1 & 2) are AGNs (QSO and Seyfert).
5 Summary of ISO identifications
A total of 54 mid-IR sources were detected in a deep survey of the CFRS 1415+52 field with ISOCAM. The reliability of the detections of these predominantly very faint sources has been strengthened through comparison of the results of two completely independent analyses of the data. The counts at 6.75m are in a very good agreement with those of the Deep ISOCAM Survey (Lockman-Hole Survey) which is 0.22 counts per sq. arcmin for Jy. Further support for the reliability of the identifications is provided by the properties of their optical counterparts:
-
–
In the CFRS 1415+52 field, there are only 25 radio-sources with (Hammer et al. 1995) and 34 ISOCAM sources with which are identified with I22.5 galaxies (out of a total of 600 I22.5 objects). Based only on optical–IR astrometry six ISOCAM sources are associated with radiosources, and the cumulative probability of finding 6 or more radiosources in this sample by chance is only 0.0037.
-
–
Among the 15 galaxies with spectra, 6 (40%) are found to be AGNs, even though only 7% of CFRS galaxies are AGN (Hammer et al. 1997).
-
–
Of the star–forming galaxies, 7 out of 8 have a Balmer index larger than the median value of CFRS galaxies, possibly implying a relationship between the presence of dust and the A-star population. Also dusty galaxies present larger color indices (Flores et al., 1998)
-
–
The ISO galaxies have a median color which is 0.5 mag redder than randomly-selected CFRS galaxies and 5 of them have a very red color.
Clearly, the ISOCAM LW2 sources have different average properties than a random sample of CFRS galaxies, giving additional confidence in our detections, even down to .
6 Discussion: the nature of the 6.75m sources
A total of 54 were detected in the 10′10′ field. Of these, 9 could not be identified with any optical counterparts to the limit of our optical images (); two sources with S/N 4 and seven more with S/N 3 remain unidentified. Of the remaining 45, there are 21 “secure identifications” (catalogues 1 & 2). Optical spectra are available for 14 of these showing that 7 are stars (mostly K and M) and 5 out of the 6 remaining sources display AGN or starburst activity. Thus, most of the strongest extragalactic sources with secure identifications are AGNs. The mid-IR flux in AGN host galaxies is believed to come directly or indirectly from the hot dust in the inner regions of a torus around the active nucleus. Two of the “secure identifications” have , the limit of the CFRS spectroscopic survey.
Analysis of the properties (photometric, spectroscopic, radio) for all sources with optical counterparts indicates that a large fraction of even the “less secure” counterparts are likely to be the correct identifications. There are 45 identified sources in total and 7 are spectroscopically confirmed stars, leaving 38 possible extragalactic sources (although 3 of these have stellar profiles). Ten of these have and are fainter than the CFRS survey limit, but spectra are available for 14 of the remaining 28 counterparts. As Table 3 indicates, 53% are classified as , showing evidence of an A star population and star formation activity, indicative of significant star formation 0.5 Gyr ago. Detection of galaxies in the mid-IR is supported by preliminary results from ISOCAM LW3 15m data (Flores et al. 1998).
The average ratio between the energy () at m and the visible energy (0.835/(1+z) m) is high, 2.1 0.7 in average, for the 9 galaxies exhibiting star formation activity.
It is higher that the value estimated for a local starburst galaxy
after reshifting it to the median redshift (z=0.71) for our sample of
star forming galaxies, for which we find =0.63. Figure 12 shows the redshift distribution of this
ratio, compared to local templates (starburst, elliptical and QSOs from Schmitt et al. 1997). Although several objects appears compatible with local galaxies, Fig. 6
indicates that Mid-IR to optical flux ratio is not sufficient to
determine the nature of the source emission. On the other hand, some sources appear redder than any kind of local templates. This does not seem
related to a deficiency in our flux calibration at 6.75m (stars do
not show the same excess when compared to Rayleigh-Jeans emission distribution), and the excess is apparently higher than our expectations for photometric errors. Indeed there are several bright ISOCAM sources (including the brightest one, CFRS14.1157) which present this red excess. From a purely statistical point of view, this is not unexpected,
since the ISOCAM detections correspond to the small fraction (5% )
of I 22.5 galaxies at which are the most extreme mid-IR emitters. On the other hand this might indicate that several field galaxies up to z=1 have higher Mid-IR fluxes (related to PAH or to hot dust) when compared to local galaxies.

Some of the unidentified sources and some of the sources with counterparts for which we do not yet have spectra may be at z 1. The fact that a) many of the counterparts without spectra are fainter than average and b) that some of these are very red in supports this possibility. On the other hand, they may also simply be highly reddened. A crude estimate of the number of high z () mid-IR emitters can be made by adding the following:
-
–
The one spectroscopically confirmed I 22.5 extragalactic ISO source at .
-
–
The three (30%) of the ten 22.5 I 23.5 ISO sources that are likely to be at (from the extrapolation by Lilly et al. 1995c)
-
–
All nine unidentified sources.
In other words, the maximum number of ISO sources which could be at z 1 is 14, or 30% of the 44 sources which are non-stellar (7 ”spectroscopic” stars and 3 ”stellar profile” objects excluded).
Perhaps the most intriguing object in our ISO sample is CFRS14.1157, which is the brightest non-stellar object in our LW2 image. It is likely to be a heavily absorbed AGN at z = 0.216. Further observations of this source are warranted. Deeper and more complete near-IR imaging and spectroscopy of a number of the optical counterparts and the unidentified sources would also be of interest.
Acknowledgments: The ISOCAM data presented in this paper were analyzed using software developed by F.X. Désert and “CIA” (a joint development by the ESA Astrophysics Division and the ISOCAM Consortium led by the ISOCAM P.I., C. Césarsky, Direction des Sciences de la Matiere, C.E.A., France). We thank D. Pelat for useful discussions about the identification procedure. We are grateful to the referee for suggestions and comments which help us to seriously improve the manuscript.
References
- 1 Aussel, H., Elbaz, D., Starck, J., Césarsky, C.J, 1997, Colloque de Moriond.
- 2 Césarsky, C.J., Abergel, A., Agnese, P. et al, 1996, A & A, 315, L32.
- 3 Désert, F. X., Puget,J., Clements, D. L., et al. 1998, A&A, submitted.
- 4 Edelson, R. & Malkan, M. 1986, ApJ, 308, 59
- 5 Flores, H. et al. 1998, ApJ, submitted.
- 6 Fomalont, E.B., Windhorst, R.A., Kristian, J.A., Kellerman, K.I., 1991, AJ, 102, 1258
- 7 Hammer F., Crampton, D., Lilly, S., Le Fèvre, O., Kenet, T., 1995, MNRAS, 276, 1085
- 8 Hammer F., Flores H., Lilly S., Crampton D., Le Fèvre O., Rola C., Mallen-Ornelas G., Schade D. and Tresse L. 1997, ApJ, 480
- 9 Helou, G., 1986, ApJL, 311, L33
- 10 Helou, G., Ryter, C, Soifer, B. T., 1991, ApJ 376, 505
- 11 Lilly S.J., Le Fèvre O., Crampton D., Hammer F., and Tresse L., 1995a, ApJ, 455, 50.
- 12 Lilly S.J., Hammer F., Le Fèvre O., Crampton D. 1995b, ApJ, 455, 75.
- 13 Lilly S. J., Tresse L., Hammer F., Crampton D. & Le Fèvre O. 1995c, ApJ, 455, 108.
- 14 Kessler M.F., Steinz, J.A., Anderegg, M.E. et al. 1996, A & A, 315, L27.
- 15 Puget J. & Léger, A., 1989, ARAA, 27, 161
- 16 Puget J., Léger A. & Boulanger, F., 1985, A&A, 142, L9
- 17 Roche, P. F., Aitken, D. K., Smith, et al., 1991, MNRAS, 248, 606.
- 18 Schade, D., Crampton, D., Hammer, F., Le Fèvre, O., Lilly, S.J., 1995, MNRAS, 278, 95.
- 19 Schmitt H., Kinney A., Calzetti D., Storchi-Bergmann T., 1998, AJ, 114, 592.
- 20 Starck, J.L., Aussel, H, Cesarsky, C.J., Elbaz, D., 1998, A & A, submitted.