X–ray spectral evolution of GS 2023+338 (V404 Cyg) during decline after outburst
Abstract
We have re-analyzed archival Ginga data of the soft X–ray transient source GS 2023+308 (V404 Cyg) covering the decline phase of its May 1989 outburst. Our spectral modeling includes the relativistically smeared Compton reflected continuum and iron fluorescent line near 6.5 keV produced by X–ray illumination of the accretion disc. This gives a powerful diagnostic of the accretion geometry, with the amplitude of the reprocessed components showing the solid angle subtended by the disc, while the detailed shape of the relativistic smearing shows how close this material is to the black hole event horizon.
We find that reflection is always significantly present in the spectra, but that its fractional contribution decreases as the decline progresses. The amount of relativistic smearing is also consistent with decreasing during the decline, although this is poorly constrained except for the brightest spectra. One plausible scenario explaining this evolution is of an optically thick disc with inner radius increasing as a function of time, with the X–ray source in the form of a central corona. This is similar to the evolution inferred for other X–ray transient sources, such as Nova Muscae, except that the underlying power law spectrum of GS 2023+338 stayed constant as the disc geometry changed. This challenges the underlying assumption of almost all models for the spectra of accreting black holes, namely that the hard X–rays are formed by Comptonization of seed photons from the accretion disc.
keywords:
accretion, accretion disc – black holes – stars: individual (GS 2023+338) – X-ray: stars1 Introduction
The ’no hair’ theorem for black holes states that they can be described solely in terms of their mass and spin (and charge, although this is unlikely to be important in physically realistic situations). Black holes are then completely characterised by two parameters, making them much less complex than e.g. neutron stars, where there can be a strong magnetic field, and where there is an uncertain equation of state for the dense material. Black hole binary systems are then the simplest objects in which to study the physics of accretion flows in strong gravity, and have the further advantage that the orbital parameters are often well studied so that the inclination, mass and distance of the system are tightly constrained.
Many of the black hole binary systems show dramatic outbursts where the luminosity rises rapidly from a very faint quiescent state to one which is close to the Eddington limit, , and then declines approximately exponentially over a period of months. These systems are the soft X–ray transients (hereafter SXT; see Tanaka & Lewin 1995, Tanaka & Shibazaki 1996 for reviews), with the outburst triggered by the classic disc instability which occurs as Hydrogen starts to become partially ionised (Meyer & Meyer-Hofmeister 1981; Smak 1982; see Osaki 1996 for review). The dramatic increase in mass accretion rate onto the central object gives rise to strong X–ray emission. This illuminates the disc, and controls its evolution during the decline phase (King & Ritter 1998, King 1998), and in quiescence (King, Kolb & Szuszkiewicz 1997).
The SXT also show spectral evolution during the outburst and decline. In general, when the luminosity is close to the Eddington limit, their X–ray spectra show a strong thermal component at keV, accompanied by a strongly variable power law (very high or flare state). As the luminosity decreases then the power law component decreases in importance, giving the high or soft state which is dominated by the thermal component. There is then a marked transition at as the thermal component decreases in both luminosity and temperature, and a hard, strongly variable power law dominates the X–ray spectrum (the low or hard state). This spectrum remains fairly stable to very low luminosities, where the source is in the quiescent or off state (Miyamoto et al. 1992; Nowak 1995; Tanaka & Lewin 1995; Tanaka & Shibazaki 1996).
According to current paradigm the thermal component originates in an optically thick accretion disc for which the Shakura–Sunyaev (1973; hereafter SS) solution is commonly used, while the hard power law is produced by hot, optically thin plasma. The geometry inferred for the low/hard state from modelling the broad band (1–200 keV) spectrum of both transient and persistent sources (Dove et al. 1997; Gierliński et al. 1997a; Poutanen, Krolik & Ryde 1997; see Poutanen 1998 for a review) is that of a geometrically thin, cool accretion disc which truncates at some transition radius, , which is rather larger than the innermost stable orbit at (), with the inner region filled by a quasi-spherical, X–ray hot plasma.
Another independent diagnostic of the accretion geometry is produced as the X–rays illuminate the disc. An iron fluorescence line and reflected continuum are formed wherever hard X–rays illuminate optically thick material (George & Fabian 1991; Matt, Perola & Piro 1991), but around a black hole these spectral features should be strongly smeared by the combination of Doppler effects from the high orbital velocities and strong gravity (Fabian et al., 1989). Modelling of the detailed shape of this relativistic smearing directly constrains the distance of the cool reflecting material from the black hole, while the amount of reflection and line constrains the geometry. Results from this approach from low state spectra of both transient and persistent Galactic Black Hole Binaries are consistent with the geometry described above (Ueda, Ebisawa & Done 1994; Ebisawa et al. 1996; Życki, Done & Smith 1997, hereafter Paper I; Życki, Done & Smith 1998, hereafter ZDS98; Done & Życki 1998).
The inferred high state geometry is rather different. Both broad band spectra and detailed modelling of the reprocessed component give a consistent picture in which the optically thick disc extends all the way down to the last stable orbit (Poutanen et al. 1997; Gierliński et al. 1997b; ZDS98; Cui et al. 1997). The transition to the high state then seems to involves a decrease of and consequently an increase of the disc thermal emission at the expense of the power law component. Further evolution to the very high state presumably requires a redistribution of the energy generation so that the relative contribution of a coronal source increases.
There is no current model able to compellingly explain all this evolution. Perhaps the best to date is that of Esin, McClintock & Narayan (1997), who go some way towards constructing the global dynamics as a function of mass accretion rate. At low mass accretion rates there are least two thermally and viscously stable solutions of the accretion flow. One is the familiar optically thick, geometrically thin, SS disc, where the energy released is efficiently radiated via blackbody cooling. Another is a hot, optically thin, geometrically thick flow in which the radiative cooling is rather inefficient so that radial energy transport (advection) is important (advection dominated accretion flows, hereafter ADAF; see e.g. the review by Narayan 1997). For the hot solution, an increasing mass accretion rate, means that the flow density and, consequently, its radiative efficiency increases. Eventually, at some critical accretion rate , the cooling becomes efficient enough to collapse the hot solution down into an SS disc. Esin et al. (1997) calculate that this transition occurs for luminosities , so they identify the low–high state change with the infalling material switching from an ADAF to SS disc.
At least three of currently known transient black hole systems did not show this canonical behaviour. GS 2023+338 (V404 Cyg), GRO J0422+32 (Nova Persei 1992) and GRS 1716-249 (Nova Oph 1993) remained dominated by the non-thermal component throughout the entire decline phase. For GRO J0422+32 and GRS 1716-29 this is plausibly because the system luminosities were never higher than so that it never went above the low state (Nowak 1995; Esin et al. 1998, Revnivtsev et al. 1998), but this is clearly not the case for GS 2023+338, where the luminosity reached almost the Eddington limit (Tanaka & Lewin 1995). This system is especially interesting since it was used as an example for the ADAF-based models of SXT’s in quiescence (Narayan, Barret & McClintock 1997), yet its outburst behaviour is apparently very different from that predicted by the extension of this model to the overall evolution of SXT (Esin et al. 1997).
In this paper we present results of detailed spectral analysis of data obtained during the 1989 outburst of GS 2023+338 (Kitamoto et al. 1989), and use the relativistically smeared reprocessed component to constrain the accretion geometry. The outburst was well covered by Ginga from its first detection by All Sky Monitor on May 22 until November 1989 (Tanaka & Lewin 1995). In this paper we concentrate on the decline phase of the outburst after 1 June 1989, leaving detailed discussion of the most dramatic “day in the life” of GS 2023+338 (30 May) to a forthcoming paper. For our analysis we have selected several data sets when the effect of photo-electric absorption (another unusual feature of the source) was small and we aim at describing the evolution of the accretion flow geometry in the vicinity of the central black hole. We then compare this evolution to more typical cases of STX e.g. Nova Muscae 1991, and with the predictions of the Esin et al. (1997) model.

2 Data reduction and background subtraction
The data were extracted from the original First Reduction Files in the usual manner using the Ginga reduction software at Leicester University. However, unlike most X–ray sources, the spectrum of GS 2023+338 contributes a significant number of counts above 24 keV. This count rate is used as a background monitor (Surplus above Upper Discriminator, or SUD), but here it is contaminated by the source. The SUD rate minus the contribution from the source was estimated from off-source data taken before and after the source observation. We are able to do this because the satellite position in orbit, and thus the intrinsic background, depends on two parameters (excluding the phase of the 37-day orbital period of Ginga): the angle from ascending node of the orbit and the longitude of the ascending node (K. Hayashida, private communication). We mapped the SUD rate from the uncontaminated observations against both orbital parameters (dividing the data into 20 degree bins). For each data point from the observation of the source we calculated the orbital parameters and replaced the contaminated SUD value with that from the corresponding orbital parameters on the uncontaminated grid. We can then perform either a “local” or “universal” background subtraction as normal (Hayashida et al. 1989). We chose the universal background since there were no background observations suitable for the local method.
To test the method we used the off–source (uncontaminated) data using both the original and modified SUD values. The r.m.s. deviations of the resulting spectra were less than 5–7 per cent over the 2–20 keV range. Secondly, we perform a similar analysis on MCG-2-58-22 (Nov 1989 observation), comparing the “universal” background subtraction before and after inserting modified SUD values. The results from the real and modified SUD data were in agreement within the error bars, showing that the method is reliable.

3 Data selection for spectral analysis
| label | data set | start date/time | end date/time | start date | exposure (s) |
|---|---|---|---|---|---|
| 30 May (d) | |||||
| 1. | June 3. | 89/154 3/06 16:36:31 | 3/06 16:43:27 | 4 | 416 |
| 2. | June 4. | 89/155 4/06 12:11:59 | 4/06 12:20:07 | 5 | 488 |
| 3. | June 10. | 89/161 10/06 01:58:00 | 10/06 02:15:04 | 11 | 1024 |
| 4. | June 19. | 89/170 19/06 06:29:40 | 19/06 07:46:40 | 20 | 1900 |
| 5. | June 20. | 89/171 20/06 14:05:00 | 21/06 04:00:00 | 21 | 12180 |
| 6. | July 6. | 89/187 6/07 09:47:00 | 6/07 10:10:28 | 37 | 1408 |
| 7. | July 20. | 89/201 20/07 01:00:00 | 22/07 05:13:00 | 51 | 7650 |
| 8. | November | 89/305 1/11 00:20:00 | 1/11 22:00:00 | 155 | 19064 |
The variability characteristics of these data were examined in detail by Oosterbroek et al. (1996, 1997). Here we show the light–curves (Fig. 1) and colour–colour diagram (Fig. 2) for completeness. There is remarkable variability both in flux and in spectral shape (see also Tanaka & Lewin 1995). Oosterbroek et al. (1997) showed that the well defined track (marked on Fig. 2) is consistent with being due to increasing photo–electric absorption. The left hand side of this track seems to end at a well defined point, plausibly because this represents the unabsorbed primary spectrum. We extracted datasets from this point in order to try to constrain the underlying spectral shape since the beginning of June to the last Ginga observation in 1989 (November), as detailed in Table 1.
| label | (keV) | dof | |||||||
|---|---|---|---|---|---|---|---|---|---|
| 1. | 18.6/23 | ||||||||
| 2. | 21.6/23 | ||||||||
| 3. | 21.3/23 | ||||||||
| 4. | 23.1/23 | ||||||||
| 5. | 7.85/23 | ||||||||
| 6. | 22.8/23 | ||||||||
| 7. | 19.9/23 | ||||||||
| 8. | 26.3/22 |
– hydrogen column of uniform absorber in units of
– inner radius of emitting disc as found from the
amplitude of the soft thermal component.
– photon index of the primary power law.
– normalization of the primary power law (photons/cm2/s/keV)
– amplitude of the smeared, reprocessed component.
– ionization parameter, .
– inner radius of the disc as found from the magnitude
of the relativistic effects.
4 Models
We use a variety of models for the data analysis. The soft component is described by a blackbody or a disc blackbody (i.e. multi-temperature composition of blackbody spectra; Frank, King & Raine 1992; Mitsuda et al. 1984). For the hard component we use a power law, and its reflected continuum is modelled using the angle-dependent Green’s functions of Magdziarz & Zdziarski (1995) as implemented in the pexriv model in XSPEC spectral analysis package (Arnaud 1996). This calculates the ionization state of the material by balancing photo–electric ionization from the irradiating hard power law against radiative recombination, as in Done et al. (1992). The photo–electric absorption edge energies for iron were corrected from the rather approximate values given by Reilman & Manson (1979) to those of Kaastra & Mewe (1993). The recombination rate is a function of temperature, while the photo–ionization rate depends on the ionization parameter where is the ionising luminosity, is the density of the reflector and is the distance of the reflector from the X–ray source. At a given temperature (which is chosen rather than calculated self–consistently in this code) then the ion populations are determined by , with a rather weak dependence on the spectral shape (see Done et al. 1992).
The iron line corresponding to given ionization state, plasma temperature and spectral shape is computed self consistently in our code, rather than modelled as a separate component. We use the Monte Carlo code of Życki & Czerny (1994) to compute the line intensity and profile (which is broadened by Compton scattering in the reflector and a possible range of ionization stages of iron). The line is then added to the reflected continuum to give the total reprocessed spectrum.
This total reprocessed spectrum can then be corrected for relativistic and kinematic effects which cause “smearing” of spectral features (e.g. Fabian et al. 1989). These effects are calculated for a monochromatic line in the XSPEC diskline model so we use this, modified to include the light bending effect in Schwarzschild geometry, to calculate the spectral smearing, and convolve this with the total reprocessed spectrum. The diskline model is parameterised by the inner and outer radii of the reflecting accretion disc, and , radial distribution of irradiation emissivity for which we assume and the inclination of the disc, . In our basic models we assume and (see Appendix A) and fit and the amplitude of the reprocessed component expressed as the solid angle of the reprocessor as seen from the X–ray source normalized to i.e. (so that corresponds to an isotropic source located above a flat, infinite disc). This means that we do not assume any specific geometry which would result in a unique relation between , , and . The models will be referred to as relrepr hereafter.
We assume cosmic abundances of Morrison & McCammon (1983) with the possibility of a variable iron abundance in the reprocessor; we fix the inclination of the source at and assume the mass of the black hole is (Shabaz et al. 1994).
The spectral analysis was performed using XSPEC ver. 10 (Arnaud 1996) into which all the non-standard models mentioned above were implemented as local models.
5 Results

The primary spectrum of the source is consistent with a simple power law after 1. June (MJD-47000 = 677), so we can use this, together with the relrepr model and a soft component (disc blackbody) to describe the data. We assumed our basic reprocessing model, i.e. only one reprocessed component (cf. Section 6.1), with ionization and relativistic smearing allowed for. We fix at and and we fit the amplitude , the inner radius and the ionization parameter . Results of the spectral modelling are presented in Table 2 and the spectra are plotted in Figure 3.
The reprocessed component is significantly present in all data sets. It is very weakly ionized, and generally significantly smeared although not to the extent expected for a disc extending down to the last stable orbit at . We note that the two effects (ionization and relativistic smearing) can be separated given good quality data. The basic reason for this is that the ionization broadens the spectral features towards higher energy whilst the relativistic effects smear them around their rest–frame energy. Secondly, the strength of the Fe spectral features increases dramatically with ionization whilst relativistic effects only redistribute the photons. Figure 4 illustrates the above discussion showing that there is no correlation between and , even if a radial distribution of ionization is assumed.

Figure 5a shows how the amplitude of the reflected component decreases during the decline phase. Initially, the amplitude of reflection is close to unity i.e. the cold, optically thick disc covers solid angle as seen from the X–ray source, but this drops significantly as the source luminosity fades. The inner disc radius derived from the amount of relativistic smearing is always incompatible with the last stable orbit in a Schwarzschild metric of (although with the caveat that is correlated with the form of irradiation emissivity). The inner disc radius is consistent with being anti-correlated with the amount of reflection, although the change in the amount of smearing is only marginally significant.
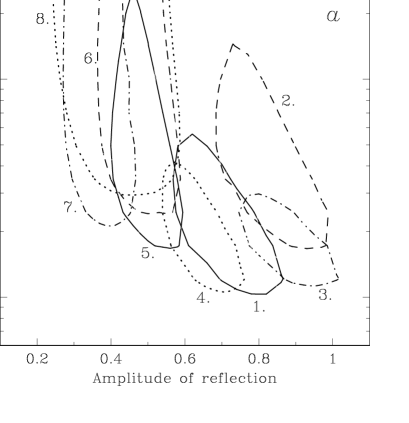
These results agree with and extend those obtained in Paper I, where only a subset of present data was analyzed. They confirm that optically thick accretion material (the putative accretion disc) was present in the system throughout the decline, even though the source luminosity is clearly dominated by the power law component, rather than by direct thermal emission from the disc.
6 COMPARISON WITH OTHER SXT

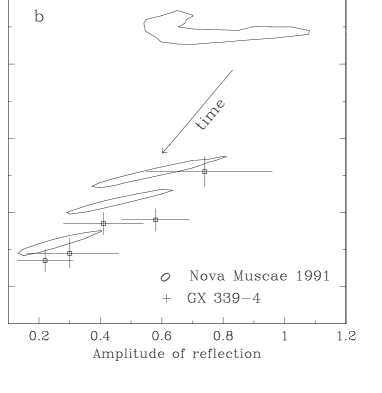
The trend we see in the data of a gradual decrease of possibly correlated with increasing is similar to that previously found in another SXT source, Nova Muscae 1991 (ZDS98, Fig. 2). However, there is a marked difference in the spectral evolution of GS 2023+338 compared to Nova Muscae. The spectral index of the primary spectrum of GS 2023+338 stayed roughly constant during the decline phase, except for the last data set (November) obtained 5 months after the outburst, when the power law was significantly softer than during the first two months. Conversely in Nova Muscae we found a monotonic decrease of (hardening of the spectrum) with time, correlated with decreasing and increasing (see Figure 6; ZDS98). A similar correlation between and is also seen from GX339-4 (Ueda et al. 1994, Figure 6)
The results from Nova Muscae and GX339-4 can be understood in terms of a phenomenological scenario where a retreating disc (increasing ) gives a smaller solid angle for reflection and a diminishing supply of soft photons for Comptonization, so leading to a harder X–ray continuum spectrum (Esin et al. 1997; ZDS98). The lack of such a correlation in GS 2023+338 is then a clear problem, implying that the observed change in solid angle for the reflecting material does not give rise to a change in the ratio of soft seed photons available for Compton scattering i.e. that the observed reflecting material is not the dominant source of soft seed photons for the Comptonization which gives rise to the hard power law. It is rather hard to imagine how this can be the case. If there is another soft seed photon contribution, perhaps from stronger cyclo/synchrotron emission, then the expected behaviour would be that the hard X–ray source would have a softer spectral index. GS 2023+338 instead shows a rather hard spectral index at all times. Perhaps a better explanation is that there is an additional contribution to the reflected component from more distant, cold material, which does not then contribute much to the soft seed photons impinging on the X–ray source. We will now investigate such additional reprocessed components.
6.1 Additional sites of reprocessing
Additional material around the source is clearly present, as evidenced by the rapid spectral variability in the June 3. – June 19. data (see Figure 2) which can be attributed to photoelectric absorption (Oosterbroek et al. 1997). The reprocessed spectrum coming from this (presumably distant) material would not be relativistically smeared and its presence in the spectrum could mean smaller amplitude of the smeared, disc reflected component. However, it is also probably not optically thick to electron scattering. The spectra extracted from the extreme right (most absorbed) end of the ’Nh track’ in Figure 2 give (see also Oosterbroek et al. 1997). The Compton reflection hump from such reprocessor is therefore suppressed but the iron line is not, since the optical depth for photo–electric absorption at the Fe K-edge energy is . We have used our Monte Carlo code to simulate reprocessing by such material including the iron line, assuming the reprocessor is not ionized. We then created a table model for XSPEC (parameterised by ) and repeated our spectral fitting of the smeared reprocessing including also this additional non-smeared component. The best fit contribution of this component is rather small, with , but with 90 per cent upper limits () of and 0.19, for June 3., June 4. and June 10. data sets, respectively. However, this does not substantially change or broaden the allowed ranges of of the disc-reflected, smeared component. Figure 7 shows the model fitted to the June 4. data set, with the contribution from the non-smeared reprocessing at its 90 per cent upper limit, and it shows clearly how the lack of a fully developed Compton hump in the optically thin reflection component cannot contribute much to the observed spectral hardening beyond 10 keV, so as much optically thick reflection is needed as before.

Clearly, the observed (optically thin) absorbing material is insufficient to produce an excess reflected component. We cannot however exclude a priori a possibility of an additional, optically thick reprocessed component being present in the data. Such component could come from e.g. an outer rim of the accretion disc, since the SS solution predicts that the disc flares in its outer regions.
Solving the SS equations for vertically integrated, stationary, non-irradiated disc we obtain at (for –0.5, –0.05). Solutions with explicit vertical structure computed by Meyer & Meyer–Hofmeister (1982) give . An irradiated disc would be expected to be more puffed up, but solutions of the vertical structure of irradiated discs depend on details of treatment of the X–ray absorption. Meyer & Meyer–Hofmeister (1982) assumed that all incident X–rays are absorbed and obtained significant thickening of a disc, up to . On the other hand, observational estimates of the optical (disc reprocessed) emission in Low Mass X–Ray Binaries also seem to imply (de Jong, van Paradijs & Augusteijn 1996).
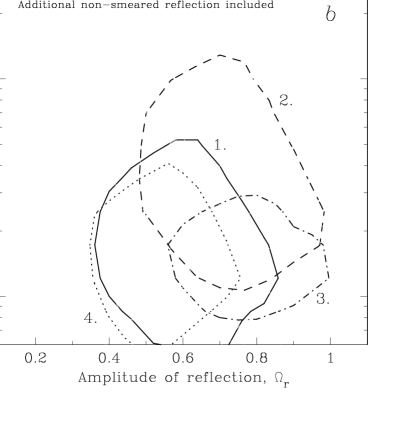
We therefore added a cold (), non-smeared reprocessed component (continuum with iron line) to our basic model and we repeated fits to first four data sets. In view of the above discussion we set an upper limit of 0.2 to its amplitude. We found that a substantial contribution from such a component is indeed allowed by the data. Consequently, the contribution of the smeared component can be smaller. The results in the – plane for the relativistic reprocessing now allow for almost constant and (Figure 5b).
Any reprocessed component coming from the distant outer rim of the disc should be constant or only slowly variable. Given that the reflected spectrum is hard, then this should reduce the amount of variability seen at high energies, and around the narrow iron line. Oosterbroek et al. (1997) show that there is no obvious effect at the iron line energy for any of the decline spectra (although there is a marked constant iron line component during the outburst). However, this does not rule out the amount of unsmeared reprocessing required here. Figure 8 shows the June 10th data set, together with the maximum contribution from the non-smeared reflection. Even though the line is intrinsically narrow, it is broadened by the response of the detector. At the iron line energy the narrow component contributes only 3 per cent of the counts, so its effect on the variability is small. Figure 8 also shows the observed 0.01–8 Hz rms variability spectrum of the June 10 data, showing that the variability pattern cannot rule out possible presence of an unsmeared, constant reflected component with .
We are left then with the far from satisfactory situation where GS 2023+338 shows a very different behaviour to that of other SXT. Either it has a remarkable outer disc, which subtends a surprisingly large solid angle, or the source is somehow able to maintain a constant hard X–ray spectral shape despite there being a copious and changing amount of soft photons from the nearby accretion disc.

7 DISCUSSION
The results from the amplitude of reflection and amount of relativistic smearing imply that the disc does not extend down to the last stable orbit at . An independent estimate of the inner disc radius could in principle be obtained from the amplitude of the thermal emission, which is proportional to the emitting area. The amplitude is not always well constrained for our data because only the Wien cutoff is within the Ginga LAC band–pass for the observed temperatures. In those cases where the amplitude is well constrained the inner radius can be computed from
where is the normalization of the diskbb model in XSPEC, is the distance to the source in units of 10 kpc, is the inclination angle and is the ratio of colour to effective temperatures, usually in the range of 1.5–1.9 (e.g. Shimura & Takahara 1995).
The inferred inner disc radius ( in Table 2 – N.B. values shown are computed without the colour temperature correction) is compatible with that inferred from relativistic smearing until June 19th. is smaller than afterwards, although a presence of a disk blackbody component of amplitude corresponding to cannot be excluded, if its temperature was below keV, again due to limited band–pass of the LAC detector.
The fact that and are in agreement is not easily compatible with strong constraints on ionization of the reprocessor. Throughout the entire decline phase the reflecting material had to be very weakly ionized, with typical upper limit on the mean ionization stage of iron Fe V. Even assuming a strong radial distribution of ionization, , and allowing for the additional non-smeared and cold reprocessing (Section 6.1), we obtain the highest allowed Fe ionic stage of Fe XVI. This corresponds to the reprocessor temperature , largely independently of whether iron ionization is in LTE conditions (e.g. Rybicki & Lightman 1979) or photoionization dominates (Figure 2 in Życki & Czerny 1994), and significantly smaller than the temperature of the observed soft emission.
The observed (weakly significant) increase of in July and November data is not consistent with a stationary SS disc, since the latter solution predicts a weaker dependence of the density than which presumably is , hence should decrease as decreases. Similarly, radial dependence of the density, is slower than that of the irradiating flux, . This may mean that the disc is not in a steady state; instead the disc may have returned to cold, low viscosity state in its outer region where a mass build-up has begun, cutting off the supply of mass to the inner disc and causing departure from stationary solution for the inner disc. However, solving the vertically averaged SS disc equations (for an un-irradiated disc) we find that Hydrogen recombines only beyond when , and so the stationary disc solution should be valid at the much closer radii where the reflection comes from.
The power law spectral index in the last data set (November, 155 days after outburst) is significantly steeper than earlier ( vs. ; Table 2). Since the source luminosity at that time was it may seem the source was close to quiescence and consequently its emission was dominated by (Comptonized) synchrotron radiation, as in ADAF-based model of Narayan, Barret & McClintock (1997), and comparable to what was observed by ASCA. However, we do see the reprocessed component with so, consequently, the emission should be dominated by comptonization of the soft photons due to thermalized irradiation, if the reflection was indeed from the inner disc. Alternatively, again a significant contribution from outer disc is a possibility, with no feedback of soft photons to the X–ray source. However, the required magnitude of disc flaring is again rather larger than expected. We also note that if the outer disc contribution to reprocessing is dominant at the end of the decline phase, then the overall decrease of has to be attributed to decrease of the smeared component, again rising the problem of the unchanging spectral shape.
8 CONCLUSIONS
Our results support growing evidence that the geometry of accretion flow evolves as the accretion rate changes during the decline of SXT. The evolution involves a retreat of the inner, optically thick disc as indicated by both decreasing amplitude of the reprocessed component and the relativistic smearing becoming less or insignificant (Paper I; ZDS98). These variations of geometry, observed also in persistent source Cyg X-1 (Done & Życki 1998) are usually correlated with spectral states: small inner disc radius corresponds to soft spectra whilst large radius corresponds to hard spectra (Nova Muscae 1991, ZDS98). This correlation is easily understood in terms of a scenario where the availability of soft seed photons for Comptonization, determined by the inner disc radius, regulates the Compton cooling and, consequently, the spectral shape (Esin et al. 1997).
However, while GS 2023+338 showed the same receding inner disc, its hard X–ray continuum spectral shape remained largely constant. This poses serious problems to any model involving Comptonization as a source of hard X–rays, and in which changes in the spectral properties are linked to the geometry of accretion.
Acknowledgements
CD acknowledges support from a PPARC Advanced Fellowship. Work of PTZ was partly supported by grant no. 2P03D00410 of the Polish State Committee for Scientific Research.
Appendix A Radial dependence of irradiation emissivity

The irradiation emissivity follows closely the dependence if the reflecting disc is outside a central source of radiation, except very close to the source. Consider a spherical source, centered on the black hole, of maximum radius , with the disc extending outside it, i.e. from to . We allow for a flaring disc with height described by an arbitrary function . Introducing spherical coordinate system in the usual manner (see Figure 9) we have:
Vector normal to the disc surface is
Distance between S and D is the length of the vector from S to D, ,
| (1) |
while the cosine of the illumination angle is
| (2) | |||||
Contribution to the irradiation emissivity is thus
| (3) |
where is the volume element of the source. Neglecting radiative transfer and relativistic effects within the source, we obtain the emissivity by integrating over the source,
where describes the distribution of volume emissivity within the source.

Examples of are plotted in Figure 10. As can be seen close to the source the emissivity can deviate from the dependence. It is generally steeper ( with ) due to the finite size of the source. The magnitude of deviation depends on luminosity distribution within the source. The stronger the central concentration of luminosity, the weaker the deviations.
A special case of a point source located on the symmetry axis, above a disc is recovered from (A1) and (A2) assuming polar angle . Assuming further a flat disc () we obtain well known formula,
where is the height of the source above the disc plane.
Another frequently quoted formula for the irradiation temperature in a flaring disc (SS, van Paradijs 1996, King et al. 1997), results from our formulae (A1) and (A2) in the limiting case of , putting (i.e. it is equivalent to assuming ) and neglecting in denominator of (A2).
Our formulae (A1)–(A3) could also in principle be applied to a disc extending inside the source. A simpler way to find the irradiation emissivity in this case is to notice that follows the local electron emission, vertically integrated over the hot source, . This generally follows the viscous energy generation in the hot source which however is not necessarily described by the usual dependence . First, the ratio of can be a function of radius (Witt, Czerny & Życki 1997). Second, a fraction of can be advected, and itself can be a function of radius. Third, Compton cooling by non-local soft photons can have a strong effect (Esin 1997), especially in the transition region. Since the non-local cooling enhances electron emission (Esin 1997), we can expect to be steeper than i.e. close to the inner disc radius. All the above effects are model–dependent and need to be properly modelled.
References
- [] Arnaud K. A., 1996, in Jacoby G., Barnes J., eds, Astronomical Data Analysis Software and Systems V, eds. , ASP Conf. Series volume Vol. 101, San Francisco, p. 17
- [] Cui W., Zhang S. N., Focke W., Swank J. H., 1997, ApJ, 484, 383
- [] de Jong J. A., van Paradijs, J., Augusteijn T., 1996, A&A, 314, 484
- [] Done C., Mulchaey J. S., Mushotzky R. F., Arnaud K. A., 1992, ApJ, 395, 275
- [] Done C., Życki P. T., 1998, MNRAS, submitted
- [] Dove J. B., Wilms J., Maisack M., Begelman M. C., 1997, ApJ, 487, 759
- [] Ebisawa, K. et al., 1994, PASJ, 46, 375
- [] Esin A. A., 1997, ApJ, 482, 400
- [] Esin A. A., McClintock J. E., Narayan R., 1997, ApJ, 489, 865
- [] Esin A. A., Narayan R., Cui W., Grove J. E., Zhang S.-N., 1998, ApJ, 505, 854
- [] Fabian A. C., Rees M. J., Stella L., White, N. E., 1989, MNRAS, 238, 729
- [] Frank J., King A. R., Raine D., 1992, Accretion Power in Astrophysics, CUP, Cambridge
- [] George I. M., Fabian A. C., 1991, MNRAS, 249, 352
- [] Gierliński M., Zdziarski A. A., Done C., Johnson W. N., Ebisawa K., Ueda, Y., Phlips, F., 1997a, MNRAS, 288, 958
- [] Gierliński M., Zdziarski A. A., Dotani T., Ebisawa K., Jahoda K., Johnson W. N., 1997b in Dermer C. D., Strickman M. S., Kurfess J. D., eds, Proceedings of the Fourth Compton Symposium, AIP, New York, p. 844
- [] Hayashida K., Inoue H., Koyama K., Awaki H., Takano S., 1989, PASJ, 41, 373
- [] Kaastra J. S., Mewe R., 1993, A&AS, 97, 443
- [] King A. R., 1998, MNRAS, 296, L45
- [] King A. R., Kolb U., Szuszkiewicz E., 1997, ApJ, 488, 89
- [] King A. R., Ritter H., 1998, MNRAS, 293, L42
- [] Kitamoto S., Tsunemi H., Miyamoto S., Yamashita K., Mizobuchi S., 1989, Nat, 342, 518
- [] Magdziarz P., Zdziarski A. A., 1995, MNRAS, 273, 837
- [] Matt G., Perola G., Piro L., 1991, A&A, 247, 25
- [] Meyer F., Meyer–Hofmeister E., 1981, A&A, 104, L10
- [] Meyer F., Meyer–Hofmeister E., 1982, A&A, 106, 34
- [] Miyamoto S., Kitamoto S., Iga S., Negoro H., Terada K., 1992, ApJ, 391, L21
- [] Morrison R., McCammon D., 1983, ApJ, 270, 119
- [] Mitsuda et al., 1984, PASJ, 36, 741
- [] Narayan R., 1997, in Wickramasinghe D. T. et al., eds, Proc. IAU Colloq. 163 on Accretion Phenomena & Related Outflows, ASP Conf. Series, p. 75
- [] Narayan R., Barret D., McClintock J. E., 1997, 482, 79
- [] Nowak M., 1995, PASP, 107, 120
- [] Oosterbroek et al., 1996, A&A, 309, 781
- [] Oosterbroek et al., 1997, A&A, 321, 776
- [] Osaki Y., 1996, PASP, 108, 39
- [] Poutanen J., 1998, in Abramowicz M. A., Björnsson G., Pringle J. E., eds, Theory of Black Hole Accretion Discs, CUP, Cambridge, in press, (astro-ph/9805025)
- [] Poutanen J., Krolik J. H., Ryde F., 1997, MNRAS, 292, L21
- [] Reilman R. F., Manson S. T., 1979, ApJS, 40, 815
- [] Revnivtsev M. et al., 1998, A&A, 331, 557
- [] Rybicki G. B., Lightman A. P., 1979, Radiative Processes in Astrophysics, John Wiley, New York
- [] Shabaz T., Ringwald F. A., Bunn J. C., Naylor T., Charles P. A., Casares J., 1994, MNRAS, 271, L10
- [] Shakura N. I., Sunyaev R. A., 1973, A&A, 24, 337
- [] Shimura T., Takahara F., 1995, ApJ, 445, 780
- [] Smak J. I., 1982, Acta Astr, 32, 199
- [] Tanaka Y., Lewin W. H. G., 1995, in Lewin W. H. G., van Paradijs J., van den Heuvel E., eds, X–Ray Binaries, CUP, Cambridge, p. 126
- [] Tanaka Y., Shibazaki N., 1996, ARAA, 34, 607
- [] Ueda Y., Ebisawa K., Done C., 1994, PASJ, 46, 107
- [] van Paradijs J. 1996, ApJ, 464, L139
- [] Witt H. J., Czerny B., Życki P. T., 1997, MNRAS, 288, 848
- [] Życki P. T., Czerny B., 1994, MNRAS, 266, 653
- [] Życki P. T., Done C., Smith D. A., 1997, ApJ, 488, L113 (Paper I)
- [] Życki P. T., Done C., Smith D. A., 1998, ApJ, 496, L25 (ZDS98)