Asymmetry of jets, lobe size and spectral index in radio galaxies and quasars
Abstract
In this paper we investigate the correlations between spectral index, jet side and extent of the radio lobes for a sample of nearby FRII radio galaxies. In Dennett-Thorpe et al. (1997) we studied a sample of quasars and found that the high surface brightness regions had flatter spectra on the jet side (explicable as a result of Doppler beaming) whilst the extended regions had spectral asymmetries dependent on lobe length. Unified schemes predict that asymmetries due to beaming will be much smaller in narrow-line radio galaxies than in quasars, and we therefore chose to investigate in a similar fashion, a sample of radio galaxies with detected jets. We find that spectral asymmetries in these objects are uncorrelated with jet sidedness at all brightness levels, but depend on relative lobe volume. Our results are not in conflict with unified schemes, but suggest that the differences between the two samples are due primarily to power or redshift, rather than to orientation. We also show directly that hotspot spectra steepen as a function of radio power or redshift. Whilst a shift in observed frequency due to the redshift may account for some of the steepening, it cannot account for all of it, and a dependence on radio power is required.
keywords:
galaxies:active – galaxies:jets – radio continuum – galaxies1 Introduction
Several strong correlations have been found between asymmetries in powerful extragalactic radio sources of Fanaroff & Riley’s (1974) class II (hereafter FRII):
-
1.
In a sample of sources with strong, one-sided jets (predominantly quasars), the jet side depolarizes less rapidly with increasing wavelength (Laing 1988; Garrington et al. 1988).
-
2.
The jet side also has a flatter spectrum in these objects (Garrington, Conway & Leahy 1991).
-
3.
In a sample of sources selected without reference to the prominence of their jets (mostly radio galaxies), the more depolarized lobe has a steeper spectrum (Liu and Pooley 1991a, 1991b).
-
4.
In sources with weak or undetected jets (all radio galaxies) the shorter lobe depolarizes faster (Pedelty et al. 1989a, b; Laing 1996)
-
5.
More extended narrow-line emission is associated with the shorter lobe in radio galaxies (McCarthy et al. 1991).
The Laing-Garrington depolarization–jet side correlation is most easily explained as an orientation effect. If the jets are relativistic, the nearer one appears brighter as a result of Doppler boosting; the nearer lobe is seen through less magnetoionic material and therefore shows less depolarization. The association of depolarization and enhanced line emission with the shorter lobe is more likely to result from intrinsic or environmental effects such as a variations in external density or motion of the host galaxy (Gopal-Krishna et al. 1996). This leads to a problem if the spectral-index correlations have a common origin in all objects: there is an unbroken chain of reasoning which implies that apparently intrinsic properties are correlated with those believed to be orientation–dependent. In Dennett-Thorpe et al. (1997, hereafter Paper 1) we presented evidence which resolved this paradox for quasars: the spectrum of the regions of highest brightness, in and around hotspots, is indeed flatter on the jet side, but that of the low-brightness emission is flatter in the longer lobe.
The results of Paper 1 indicate the presence of a mixture of environmental/intrinsic and orientation effects. In the present paper we have attempted to isolate the former by investigating a sample in which Doppler beaming should be less important. According to the simplest variants of unified schemes (e.g. Barthel 1989), the quasar jet axes lie within of the line of sight. Their side-on counterparts are the narrow-line radio galaxies (NLRG). The ideal comparison sample would consist of NLRG comparable in luminosity and redshift to the quasars observed in Paper 1, but the frequency of detection of jets in these objects in existing observations is very low (Fernini et al. 1993; 1998) and we cannot investigate correlations with jet sidedness. By contrast, the detection rate of jets achieved for nearby FRII radio galaxies is high, and we have selected a sub-sample of these sources with detected jets. The sample consists mainly of NLRG; these should be closer to the plane of the sky than the quasars, at least on average (note that the need to detect at least one jet introduces an orientation-dependent bias to the selection). It also includes two broad-line radio galaxies (BLRG) which (by the precepts of unfied schemes) should have jets at fairly small angles to the line of sight and might therefore be expected to behave more like the quasars. The difference in characteristic luminosity and redshift between the two samples is an important but unavoidable complication.
In section 2, we describe the sample selection, observations and derivation of spectral indices. Spectral asymmetries and their relation to other jet sidedness and lobe volume ratio are discussed in Section 3 and the spectral differences between the quasar and galaxy samples are considered in Section 4. Orientation-dependent asymmetries are considered briefly in Section 5, and Section 6 summarizes our conclusions.
We assume throughout that = 50 kms-1Mpc-1 and = 0.5.
2 Sample Selection and Observations
The observed sources were selected from the sample defined by Black et al. (1992), which is a subset of the 3C catalogue with 1.5 1025WHz-1sr-1 and 0.15. Sensitive high-resolution images of all of the sample members are available from the work of Black et al. (1992), Leahy et al. (1997) and the other references listed by Black et al. As a result, the jet detection rate is 60% and the sample is therefore well suited to the purposes of this study. We selected sources with detected jets having a largest angular size 300 arcsec, to ensure adequate sampling of the low-brightness emission. Known FRI sources had already been excluded by Black et al. but we also omitted three sources with intermediate FRI/II or grossly distorted structure (3C15, 424 and 433). We were able to obtain suitable data for a representative sub-sample of 10 out of the remaining 15 sources. Those rejected were: 3C111, 277.3 and 303 (for which archival data proved to be inadequate); 3C184.1 (whose jet had not been detected when the sample was selected) and 3C353 (the subject of a detailed study by Swain (1996)).
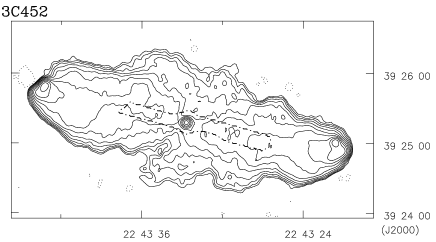
Unfortunately the sample members turn out to be rather symmetrical, so that effects of differences in lobe length cannot be expected to stand out as clearly as we should like. Jets were detected only on one side of the core in 8/10 sources, but we also use the term “jet side” to refer to the lobe with the brighter jet in the other 2 cases. This is ambiguous only for 3C452.
A summary of the observations is given in Table 1. For this work a well-covered uv-plane is needed, preferably matched at two frequencies in the sense that the baselines in wavelengths are identical. Each source was observed at frequencies of approximately 1.4 GHz and either 4.9 or 8.4 GHz, depending on the availability of suitable data from previous observations (precise frequencies are given later). Where necessary, we undertook extra VLA observations at the higher frequency to improve the coverage at large spatial scales. At 1.4 GHz we combined archive data and new observations to create a data-set which substantially overlapped in the uv-plane with the higher frequency (we were unable to match the arrays by individual baselines at 8.4 GHz, as the VLA configurations do not scale appropriately). New observations are marked with an asterisk, and were taken on 1995 June 18 (B array), 1995 November 26 (C array) and 1995 April 11 (D array). References are given in Table 1 to the sources of the archive data. In most cases, the data were recalibrated and mapped for the present project. The exceptions were 3C382, where the low-frequency image is from Leahy & Perley (1991) and 3C388 (Roettiger et al. 1994) and 3C405 (Dreher et al. 1987; Carilli et al. 1991), where published maps were used at both frequencies.
| Source | Frequency | Array | Observations |
| 3C135 | 1.4 | BC | |
| 8.4 | BCD | L97 | |
| 3C192 | 1.4 | BC | RAL, |
| 4.9 | CD | RAL, | |
| 3C223.1 | 1.4 | BC | SS, |
| 8.4 | ABCD | B92, | |
| 3C285 | 1.4 | ABC | vBD |
| 4.9 | ABCD | vBD, | |
| 3C382 | 1.4 | BC | LP91 |
| 8.4 | BCD | B92 | |
| 3C388 | 1.4 | R94 | |
| 4.9 | R94 | ||
| 3C390.3 | 1.4 | ABC | LP95 |
| 8.4 | CD | LP95, | |
| 3C403 | 1.4 | BC | |
| 8.4 | CD | B92, | |
| 3C405 | 1.4 | ABD | D87 |
| 4.9 | ABCD | D87 | |
| 3C452 | 1.4 | BC | RAL |
| 8.4 | ABCD | B92, |
marks new observations undertaken for this project.
non-standard, but matched, arrays. See Roettiger et al. (1994)
References: B92 Black et al. (1992); D87 Dreher et al. (1987); LP91 Leahy & Perley (1991);LP95 Leahy & Perley (1995); L97 Leahy et al. (1997); R94 Roettiger et al. (1994); vBD van Breugel & Dey (1993); RAL, SS R.A. Laing, S.R. Spangler (unpublished).
| Source | beam | (MHz) | noise | contour | (MHz) | noise |
| (arcsec) | mJy/beam | factor | mJy/beam | |||
| 3C135 | 4.65 | 1450 | 0.17 | 2.02 | 8350 | 0.09 |
| 3C192 | 4.35 | 1418 | 0.18 | 1.82 | 4910 | 0.05 |
| 3C223.1 | 10.0 | 1440 | 0.32 | 2.67 | 8350 | 0.13 |
| 3C285 | 5.50 | 1506 | 0.12 | 1.86 | 4860 | 0.09 |
| 3C382 | 4.75 | 1477 | 0.13 | 2.00 | 8350 | 0.10 |
| 3C388 | 1.45 | 1465 | 0.06 | 1.89 | 4885 | 0.04 |
| 3C390.3 | 4.85 | 1533 | 0.23 | 2.12 | 8350 | 0.20 |
| 3C403 | 4.50 | 1450 | 0.15 | 1.98 | 8350 | 0.11 |
| 3C405 | 1.33 | 1446 | 6.36 | 2.13 | 4525 | 0.76 |
| 3C452 | 5.25 | 1403 | 0.30 | 1.68 | 8350 | 0.09 |
The data were reduced with the NRAO aips software, using standard procedures and phase-only self-calibration. Limits and tapers were applied to the data in the uv-plane to create data sets with approximately matched baselines and beam sizes. After extensive testing of different imaging algorithms, we decided to use the clean-based routines mx and imagr, in preference to the maximum entropy-based alternative vtess (the one exception is the low-frequency image of 3C382, where we used the published clean-mem hybrid image from Leahy & Perley 1991). This was done in order to ensure the reliability and reproducibility of the high and low surface-brightness regions; by contrast, convergence of maximum-entropy algorithms for these images was very sensitive to the input value of the noise, and was possible only after several attempts. The images were cleaned down to the noise level, to ensure a good representation of the flux density even in the lowest surface brightness regions. The fraction of the flux density represented by clean components in any part of the image is easily assessed using the aips software. The resolution used was usually determined by the requirements that of the flux density of the final image was represented by clean components and that the resulting image remained free of obvious imaging artifacts. In sources with extended low surface brightness regions, further tests were performed to ensure that of the flux density of these regions alone was also represented by clean components.
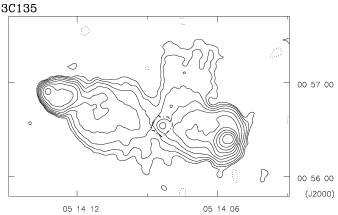
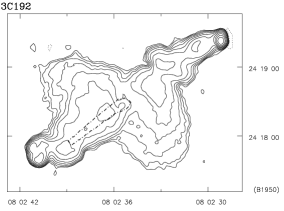
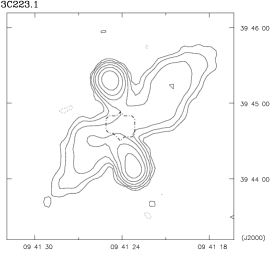
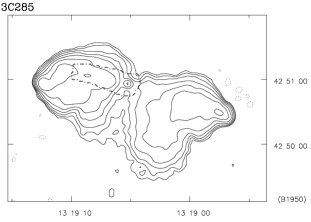
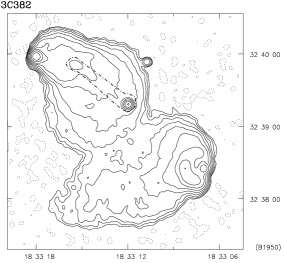
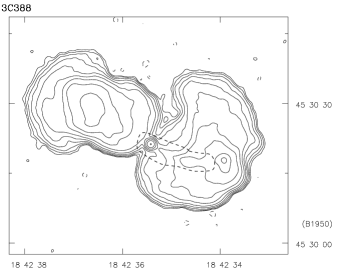
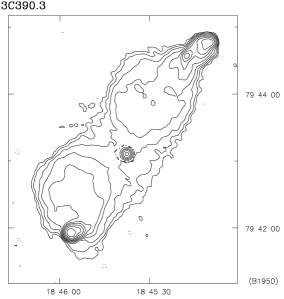
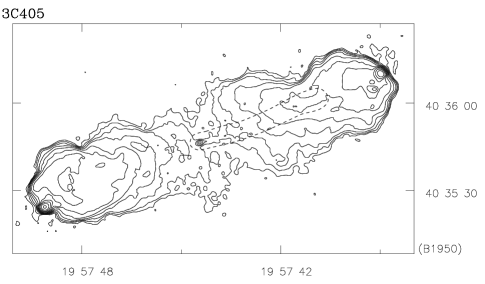
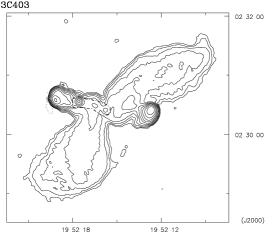
The resulting 1.4 GHz images are shown in Fig. 1. Table 2 shows the beam sizes used, the noise levels attained and the contouring factor for the displayed images. The lowest contour is at 3 and the contours are logarithmically spaced. For completeness all 1.4 GHz images are shown.


3 Asymmetries
3.1 Analysis
Asymmetry in spectral index was assessed by comparing regions of equal surface brightness on opposite sides of each source. The procedure is explained in more detail in Paper 1: in essence, the image is cut along total intensity contours in the 1.4 GHz image (the contours being those shown in Fig.1) and these contours are used as templates for the image at the higher frequency. The spectral index is calculated for each region between two brightness levels (a ‘bin’) from the ratio of flux densities in that bin.
In the radio galaxies, the lobes reach all the way to the middle of the source. The dividing line between the two lobes is usually obvious, but in some sources (e.g. 3C192) it is not clear how the low surface brightness bins should be divided between them. All of these sources have central troughs in their surface brightness distributions, often coinciding with clear changes in the polarization structure suggestive of the meeting of two volumes of back-flowing plasma (Black et al. 1992; Leahy et al. 1997). We have therefore divided the sources along these intensity minima. In the two “winged” sources in the sample, the wings were associated with lobes as follows: 3C223.1 NE (jet side) lobe with NW wing; 3C403 NE (jet side) lobe with SE wing.
Note that the jets are not clearly visible in Fig. 1: higher resolution images (Black et al. 1992; Leahy et al. 1997) were used to identify regions with significant jet emission and these were excluded from the spectral analysis, as in Paper 1. The excluded regions are indicated by dashed lines in Fig. 1.
The spectral indices for the various surface brightness bins are shown in Fig. 2. The horizontal lines represent the range of surface brightness in which the spectral index was calculated. The errors due to noise in the images are shown by vertical lines; systematic errors in the flux calibration will affect both sides equally and will therefore not change our conclusions. Fig. 2 shows the usual steepening of the spectrum from the hotspots to the low-brightness regions of the lobes, except in the two winged sources (see below).
3.2 Correlations with jet sidedness
There is no trend of spectral index with jet side at any brightness level. Indeed, any differences between the spectra of the high surface-brightness regions on the jet and counter-jet sides are not merely random: in 7/10 sources (including the two BLRG 3C382 and 3C390.3) they are insignificantly small. The exceptions are 3C192, 3C388 and 3C405, but even here the spectral-index differences are 0.1. In most cases the spectral index converges to a well-defined value over the top two or three bins, showing that the ‘true’ hotspot dominates the flux of these regions even at this resolution. The similarity of the hotspot spectrum on both sides of the source gives evidence for a single injection spectrum in each source.
3.3 Correlations with lobe volume
For the quasar sample of Paper 1 we found that the longer lobe had the flatter spectrum in 8 sources out of 9. Here “length” is defined as the distance from the core to the furthest part of the contour and the spectrum is evaluated for the lowest three surface brightness bins. The most natural explanation for this correlation is that synchrotron losses have proceeded more slowly in the larger lobe because the magnetic energy has spread into a larger volume, so that there is a smaller average magnetic field. We looked for a similar effect in the radio galaxies, but found no correlation of the spectral indices for the 3 lowest surface brightness bins with either: (a) the lobe length, defined as above, or (b) the area of the lobe enclosed within the 3 contour of the 1.4 GHz image.
It is perhaps not surprising that a correlation is more difficult to detect in radio galaxies: the quantity which seems physically most relevant is the lobe volume and, as the galaxies are more symmetrical (Fig. 1; also Best et al. 1995), more care is required is required in its estimation. There is no entirely satisfactory method for estimating the volume. For a start, one must assume that the lobe is as thick as it is wide in the image plane. Furthermore, it is hard to find a prescription for the width of a lobe which is at the same time reasonable and objective. For example, it is evident from Fig. 1 that the width measured from the line joining the hotspots to the contours is a reasonable measure in straight sources such as 3C452 or 3C390.3, but makes no sense at all for 3C135, 3C192 or 3C403. Measures such as area2/length are unsatisfactory for similar reasons.
We addressed the problem of bent sources using the following method. The images at 1.4 GHz were first divided into the two lobes, as in the spectral analysis. A curve was drawn starting from the hot-spot along the ridge of the radio emission in each lobe. This curve was approximated by a number (10) of line segments of equal length . Perpendiculars were then drawn from each line segment to the contours on either side of the lobe and the average of the two lengths was taken to be the radius of the lobe, . The lobe was then approximated as a set of cylinders of height , so the volume was taken to be . From this the fractional volume asymmetry was readily calculated. In the case of 3C403 the W lobe and the NW wing were distinguished from each other for the purposes of the measurement of the nominal ‘diameters’ (in both winged sources, the line used as the ridge followed from the hot-spot to the tip of the wings in a smooth curve).
Further problems occur in the quasar sample as the lobe emission disappears into the noise some distance from the core. The difference in redshift between the two samples means that the emitted frequency is significantly higher for the quasars, and so that the lobes will be more difficult to detect for a given amount of spectral curvature in the rest frame (see below). For four of the quasars, Leahy, Muxlow & Stephens (1989) presented 151MHz MERLIN images. These show emission extending further towards the core, as do 1.4-GHz images at lower resolution. We therefore believe that the lobe volume will be significantly underestimated if the boundary of the observed emission in Fig. 1 of Paper 1 is used. In many quasars a rapid and substantial decrease in apparent width occurs, at which point the source no longer has a sharply defined edge. This is most likely to reflect the fading of the lobe into the noise, rather than the real source structure. In a few cases, there is no detectable lobe flux density in the regions closest to the core. In these situations, we used the last diameter measured before the sudden decrease in apparent width as the diameter all the way back to the core.
The extrapolation adopted attempts, as far as is possible, to take account of the dependence of observed source structure on spectral index (flatter spectrum lobes will not fade into the noise so rapidly, and may therefore have a larger region detected above the noise). As a test of the reliability of the method, we compared the volumes with values calculated directly from 151 MHz images where these were available, and found that the calculated asymmetry was in the same sense in all cases. Differences in independent estimates of were 30%. In the case of the radio galaxies there are few regions where the sources appear to fade into the noise: a sharp edge is generally observed, indicating that we are likely to be observing the true boundary of the source.
The result is shown in Fig. 3. In 7 out of 10 quasars, and 8 out of 10 radio galaxies, the larger lobe has the flatter spectrum. The Spearman Rank Test is an efficient method for testing the significance of the effect, and it shows that the correlation is significant at the 97% level for the quasars and 99% for the radio galaxies independently ( & respectively), and at much greater than the 99% level for the samples combined (). The radio galaxies are more symmetrical in both spectral index and lobe volume than the quasars, as they are in lobe length. Although there are obvious difficulties in the estimation of lobe volume, we emphasise that the sources for which the calculated volume is most questionable (the quasars) are precisely those which exhibit the secure correlation between lobe length and spectral index (Paper 1). Thus, there is clear evidence that the spectral index of low surface brightness emission is flatter in the larger lobe in both classes of source.

4 Differences between the radio galaxy and quasar samples
Many comparisons have been made between radio galaxies and quasars, some on much larger samples than ours, but not with spectral information at high angular resolution, allowing a clear separation between hotspots and regions of low surface brightness.
4.1 Hotspot regions
The correlation between spectral index and redshift or luminosity is well established for the integrated emission of sources in the 3CR sample. For example, Laing & Peacock (1980) showed that there is a strong correlation of the spectral indices of the integrated (non-core) emission of FRII galaxies with and . As Jenkins & McEllin (1977) had already shown that the fractional flux in compact components (15kpc) increased with increasing radio power, Laing & Peacock were able to infer that the correlation of spectral index with radio power or redshift must be even stronger for the hotspots, as they have flatter spectra than the extended lobes. This effect is shown directly by our samples. Fig. 4 confirms that the hot-spot spectra of the quasars are markedly steeper than those of the radio galaxies. In this figure (and ensuing discussion) the brightest region of both sides is taken as that brighter than the lower bound of the brightest bin of the lobe with the lower peak surface brightness. This is the procedure adopted in Paper 1 to allow paired spectra in lobes with differing peak surface brightnesses. Our discussion and conclusion below remain unaffected if we were to use, instead, peak flux densities or highest surface brightness bins on both sides.


Our observations of the radio galaxies are at lower angular resolution than the observations of the quasars. As the decrease in resolution approximately matches the difference in mean redshift between the samples, differing linear resolution cannot account for the hotspot spectral differences found between the samples. (This might occur if the higher redshift objects were observed with a beam of larger linear dimension, resulting in inclusion of more (steep spectrum) lobe material in the hotspot region.) Fig. 5 shows the distribution of linear beam sizes used. There was also no dependence of hotspot spectra on the beam size as a fraction of the overall source size.
In sources whose spectra steepen at higher frequencies as a result of synchrotron losses, a correlation between observed and redshift will necessarily exist, since we observe the high- sources at higher emitted frequency. It has been less clear whether there is an additional contribution affecting the rest-frame spectral index of the integrated emission and, if so, whether the fundamental variable is redshift or luminosity.
While we do not doubt that simple redshifting of a curved spectrum contributes to the observed – relation for hotspots (Fig. 4), we believe that it cannot account for the whole effect. Observations at several frequencies covering a wide range could resolve this issue directly but in their absence we must assume a functional form for the rest-frame spectrum and calculate the resulting two-point spectral indices as functions of observing frequency and wavelength. The most obvious functional form is the theoretical spectrum of a power-law electron energy distribution which has suffered synchrotron losses (cf. Myers & Spangler 1985; Leahy et al. 1989). We assumed that electrons are injected with with an isotropic momentum distribution and a power-law energy spectrum corresponding to up to a sharp cutoff and that they undergo pitch-angle scattering (cf. Jaffe & Perola 1973). The resulting spectrum in the emitted frame is parameterized by a single break frequency . Values of were then computed from the mean spectral indices of the brightest bins of each lobe.
There is a clear difference between the radio galaxies and the quasars, in the sense that hotspots in radio galaxies show higher break frequencies (less synchrotron loss). Other assumptions about the shape of the rest-frame spectrum lead to qualitatively similar results. If we assume that there is no pitch angle scattering (Kardashev 1962; Pacholczyk 1970), the diagram looks similar but with 7 GHz 15 GHz. The assumptions of a steeper injection spectrum leads to higher , particularly for objects with straight spectra – thus accentuating the difference between radio galaxies and quasars. Similarly, the intrinsic difference between the classes would also be increased, if we assumed a more realistic model in which the relativistic electrons are injected continuously into the hotspots, as the predicted curvature of the spectrum will be more gradual and the effect of redshift diminished.
We therefore conclude that there is a difference between the rest-frame spectra of the hotspots in the two samples. The simplest explanation is that the more powerful hotspots have stronger magnetic fields and therefore faster synchrotron loss.
4.2 Extended regions
(a) (b)
(b)
A similar analysis for the low surface-brightness structure shows a correlation between and for the quasars alone, but the spectral indices for the galaxies are much more widely scattered than those for the hotspots in the same objects (Fig. 7). We again use model synchrotron-loss spectra to estimate the differences between the two samples in the rest frame, with the same assumptions employed for the hotspots in Section 4.1. The result is shown in Fig. 7b.
The most striking feature is that two of the radio galaxies, 3C223.1 and 3C403, have very high values of (27 & 20 GHz respectively). The reason for this is clear from Fig. 2: both sources show essentially no spectral gradients ( averaged over lowest three bins is and ). Given that they are the two most extreme examples of “winged” sources in our sample, we might naively expect substantial synchrotron losses. We have made additional high-frequency observations of these sources and defer discussion of this extremely puzzling result to a later paper.
Excluding these two peculiar sources, the mean values of are similar for the galaxies and quasars and there is no evidence for a correlation between and . The errors on a given rest-frame break frequency decrease with redshift, and this may account for the lower dispersion for the quasars. Increasing the injection index to gives a qualitatively similar plot with larger values of . With the exception of the “winged” sources, there is therefore no evidence from our data alone for differences in the rest-frame spectra of the low surface-brightness regions of the quasars and radio galaxies.
It is clear, however, that the lowest surface-brightness bins are not in the same parts of the lobes in two samples. In the radio galaxies, we observe the steepest spectra close to the core, but the corresponding regions in the quasars are usually below our surface-brightness limit. As has already been remarked, the most striking difference between the quasars (Fig.1 of Paper 1) and the radio galaxies (Fig. 1) is that the lobes of all the radio galaxies except 3C405 meet at the middle of the source, while most of the lobes in the quasars stop well short of the core.
The lack of detected emission toward the cores of the quasars occurs, at least partly, because we observe the quasars at higher emitted frequencies. Additionally, we might expect differences in rest-frame spectra because the quasars have greater radio power and therefore, probably, greater magnetic fields. In either case, bridges should be detected at lower frequencies. As mentioned earlier in the context of estimation of lobe volumes, Leahy et al. (1989) have indeed shown this to be the case for luminous radio galaxies and quasars. They also estimated values of for the steepest-spectrum regions of the lobes (roughly equivalent to our low surface-brightness bins), but using the hot-spot spectrum to define the injection index and observing frequencies of 0.15 and 1.4 GHz. For the objects in common, Leahy et al. calculate break frequencies which are lower than ours by a factor 4. This provides some evidence that lobes of the quasars have suffered more severe synchrotron losses than those in the galaxies, but in view of the differences in assumed injection spectrum and the large uncertainties, we do not regard it as conclusive. The fact that 3C405 shows the most extreme spectral steepening close to the core, also suggests that synchrotron losses may be more extreme in powerful sources.
5 Orientation-dependent effects
The new data presented here show no contradiction with the interpretation of jet sidedness as an orientation effect; neither is there any evidence that the morphologies or spectra of the hotspots and associated emission share the sidedness of the jets. Black (1992) found no tendency for the jet to be directed at the smaller hot-spot or the hot-spot of higher surface brightness in the full FRII sample of Black et al. (1992). Similarly, spectral asymmetries in the present sample at high and low brightness levels are entirely attributable to environmental or intrinsic effects. In contrast, the quasars described in Paper 1 and Bridle et al. (1994) show asymmetries attributable to orientation: the brightness of compact hotspots and the spectra of the hot-spot regions. (They also show environmental/intrinsic effects: the spectra of the extended regions and the lobe size). In Paper 1, we concluded that relativistic flow must persist beyond the hotspots and that the most likely reasons for the spectral asymmetry are that a curved hot-spot spectrum is Doppler shifted in frequency, or that we observe different parts of the flow on the two sides as a result of Doppler enhancement and suppression of the post-shock flow. There are two obvious differences between the samples: the quasars are likely, on average, to have axes closer to the line of sight and they are significantly more powerful and distant. We address these points in turn.
The original sample of Black et al. (1992) was selected at a low frequency and should, therefore, have a random distribution of orientations. We have imposed the additional criterion that at least one jet be detected. Suppose that all sources are intrinsically identical, with symmetrical, relativistic jets and that we detect a fraction of the sample with observed jet flux above some limit. These will then be within of the line of sight for the observed detection fraction of 60% (this will, of course, be an oversimplification because of sample variations). Unified models for powerful radio galaxies and quasars assume that they form a homogeneous population, the broad-line region and nuclear continuum source being obscured unless is less than some critical angle . A source is classified as a quasar if , otherwise as a radio galaxy. Barthel (1989) estimated that from the relative numbers of 3CR quasars and radio galaxies with 0.5. By this argument, roughly half of our galaxy sample is expected to lie in the quasar orientation range. Thus, although the galaxies should be further from the line of sight on average, we should still expect to see some orientation-dependent effects in their hotspots if flow speeds are sufficiently fast.
If unified models also apply to our galaxy sample, then we can estimate directly from the observed frequency of BLRG, which are thought to be intrinsically weak quasars. Of the 26 FRII sources in the original sample of Black et al. (1992), 6 (3C111, 227, 303, 382, 390.3 and 445) are classified as BLRG, implying that that (one other, 3C321, has a broad H line detected in polarized flux; Young et al. 1996). This is likely to be an underestimate since a substantial fraction of sources at this power level show low-excitation or absorption-line optical spectra and cannot be observed as BLRG at any orientation (Laing et al. 1994.) We note that the two BLRG in our galaxy sample (3C382 and 390.3) make good candidates for being moderately close to the line of sight irrespective of obscuration-based unified schemes: both have strong cores and 3C390.3 is a possible superluminal (Alef et al. 1996).
These arguments suggest that we might expect to see spectral asymmetries in the high-brightness emission at least in the two BLRG, if not in other sample members. The fact that we do not, suggests that the spectral differences between the quasar and galaxy samples reflect differences in power or redshift rather than orientation. We can identify three effects which could contribute to this difference, all of them in the same sense:
-
1.
the post-shock flow is likely to be slower in weaker jets;
-
2.
the hot-spot spectra are observed at higher emitted frequency in the more distant objects
-
3.
the rest-frame spectra of the quasar hotspots show more curvature than those of the galaxies (Section 4.1).
6 Summary and Conclusions
We have obtained high quality radio images suitable for a two-frequency spectral analysis for a sample of low-power (nearby) FRII radio galaxies with detected jets. The resolution is high enough to distinguish hot-spot and extended lobe material.
6.1 Jet side and orientation
-
1.
Neither in this sample nor in a sample of higher radio–power quasars (Paper 1) is there evidence of a correlation between jet side and the spectral index of extended lobe emission.
-
2.
In the galaxy sample we do not detect the spectral asymmetry correlated with jet side which we found in the hot-spot regions of the quasars.
The spectral asymmetry in the high surface brightness regions of the quasars is likely to be caused by material moving relativistically at angles close to the line of sight. The absence of any such asymmetry in the radio galaxies could occur because they are, on average, closer to the plane of the sky. Alternatively, it may result from the differences between the power and redshift distributions for the samples. We favour the latter explanation because we see no asymmetries related to jet-side in the two broad-lined radio galaxies, but this argument is not yet conclusive.
6.2 Environmental/intrinsic effects
-
1.
In the low surface-brightness regions of both radio galaxies and quasars, the larger lobe (by volume) has the flatter spectrum. This asymmetry is consistent with differing rates of synchrotron loss or adiabatic expansion resulting from an external density gradient (a more detailed discussion is given in Paper 1).
-
2.
Two low-power radio galaxies with large “wings” show remarkably uniform and flat spectra across their entire structures. These sources will be the topic of a later paper.
-
3.
The hot-spot spectra of the higher powered (more distant) sources are steeper at a given emitted frequency, so the observed correlation between and is not just the result of redshifting a universal synchrotron-loss spectrum.
ACKNOWLEDGEMENTS
JDT, RAL and PAGS would like to thank the NRAO and Alan and Mary Bridle for their hospitality. Thanks to Paul Alexander for anmap software used in production of theoretical spectra. We are grateful to W. van Breugel, J. Burns, C. Carilli, J.P. Leahy, K. Roettiger and S. Spangler for allowing us to use their data and images. JDT thanks the British taxpayers for assistance in the form of a PPARC studentship. This research was partly supported by European Commission, TMR Programme, Research Network Contract ERBFMRXCT96-0034 ‘CERES’. The NRAO is a facility of the National Science Foundation, operated under cooperative agreement by Associated Universities, Inc.
References
- [Alef et al. 1996] Alef W., Wu S. Y., Preuss E., Kellermann K. I., Qiu Y. H., 1996, Astron. Astrophys., 308, 376
- [Barthel 1989] Barthel P. D., 1989, Astrophys. J., 336, 606
- [Best et al. 1995] Best P. N., Bailer D. M., Longair M. S., Riley J. M., 1995, Mon. Not. R. astr. Soc., 275, 1171
- [Black 1992] Black A., 1992, Ph.D. thesis, University of Cambridge
- [Black et al. 1992] Black A., Baum S., Leahy J., Perley R., Riley J., Scheuer P., 1992, Mon. Not. R. astr. Soc., 256, 186
- [Bridle et al. 1994] Bridle A. H., Hough D. H., Lonsdale C. J., Burns J. O., Laing R. A., 1994, Astron. J., 108, 766
- [Carilli et al. 1991] Carilli C., Perley R., Dreher J., Leahy J., 1991, Astrophys. J., 383, 564
- [Dennett-Thorpe et al. 1997] Dennett-Thorpe J., Bridle A., Scheuer P., Laing R., Leahy J., 1997, Mon. Not. R. astr. Soc., 289, 753
- [Dreher et al. 1987] Dreher J., Carilli C., Perley R., 1987, Astrophys. J., 316, 611
- [Fanaroff & Riley 1974] Fanaroff B., Riley J., 1974, Mon. Not. R. astr. Soc., 167, 31P
- [Fernini et al. 1993] Fernini I., Burns J., Bridle A., Perley R., 1993, Astron. J., 105, 1690
- [Fernini et al. 1997] Fernini I., Burns J. O., Perley R. A., 1997, Astron. J., 114, 2292
- [Garrington & Conway 1991] Garrington S., Conway R., 1991, Mon. Not. R. astr. Soc., 2500, 198
- [Garrington et al. 1988] Garrington S., Leahy J., Conway R., Laing R., 1988, Nature, 331, 147
- [Gopal-Krishna et al. 1996] Gopal-Krishna Kulkarni V. K., Wiita P. J., 1996, Astrophys. J., 467, 191
- [Jaffe & Perola 1973] Jaffe W., Perola G., 1973, Astron. Astrophys., 26, 423
- [Jenkins & McEllin 1977] Jenkins C., McEllin M., 1977, Mon. Not. R. astr. Soc., 180, 219
- [Kardashev 1962] Kardashev N. S., 1962, Astron. Zh., 39(3), 393
- [Laing 1988] Laing R., 1988, Nature, 331, 149
- [Laing 1996] Laing R., 1996, in Ekers R., C. F., Padriell L., eds, IAU Symp 175, Extragalactic Radio Sources. Kluwer
- [Laing et al. 1994] Laing R., Jenkins C., Wall J., Unger S., 1994, in Bicknell G., Dopita M., Quinn P., eds, The First Stromlo Symposium: The physics of active galaxies. Astronomical Society of the Pacific, San Francisco
- [Laing & Peacock 1980] Laing R., Peacock J., 1980, Mon. Not. R. astr. Soc., 190, 903
- [Leahy et al. 1997] Leahy J., Black A., Dennett-Thorpe J., Hardcastle M., Perley R., Riley J., Scheuer P., 1997, Mon. Not. R. astr. Soc., 291, 20
- [Leahy & Perley 1991] Leahy J., Perley R., 1991, Astrophys. J., 102, 537
- [Leahy et al. 1989] Leahy J. P., Muxlow T. W. B., Stephens P. W., 1989, Mon. Not. R. astr. Soc., 239, 401
- [Leahy & Perley 1995] Leahy J. P., Perley R. A., 1995, Mon. Not. R. astr. Soc., 277, 1097
- [Liu & Pooley 991a] Liu R., Pooley G., 1991a, Mon. Not. R. astr. Soc., 249, 343
- [Liu & Pooley 991b] Liu R., Pooley G., 1991b, Mon. Not. R. astr. Soc., 253, 669
- [McCarthy et al. 1991] McCarthy P., van Breugel W., Kapahi V., 1991, Astrophys. J., 371, 478
- [Myers & Spangler 1985] Myers S., Spangler S., 1985, Astrophys. J., 291, 52
- [Pacholczyk 1970] Pacholczyk A., 1970, Radio Astrophysics. Freeman, San Francisco
- [Pedelty et al. 989a] Pedelty J., Rudnick L., McCarthy P., Spinrad H., 1989a, Astron. J., 97, 647
- [Pedelty et al. 989b] Pedelty J., Rudnick L., McCarthy P., Spinrad H., 1989b, Astron. J., 98, 1232
- [Roettiger et al. 1994] Roettiger K., Burns J., Clarke D., Christiansen W., 1994, Astrophys. J. Lett., 421, L23
- [Swain 1996] Swain M. R., 1996, Ph.D. thesis, University of Rochester.
- [Van Breugel & Dey 1993] Van Breugel W. J. M., Dey A., 1993, Astrophys. J., 414, 563
- [Young et al. 1996] Young S., Hough J. H., Efstathiou A., Wills B. J., Axon D. J., Bailey J. A., Ward M. J., 1996, Mon. Not. R. astr. Soc., 279, L72