A 3 dimensional diagnostic diagram for Seyfert 2s: probing X-ray absorption and Compton thickness
Abstract
We present and discuss a ”3-dimensional” diagnostic diagram for Seyfert2 galaxies obtained by means of X-ray and [OIII] data on a large sample of objects (reported in the Appendix). The diagram shows the K iron line equivalent width as a function of both the column density derived from the photoelectric cutoff and the 2-10 keV flux normalized to the [OIII] optical line flux (the latter corrected for extinction and assumed to be a true indicator of the source intrinsic luminosity). We find that the hard X-ray properties of type 2 objects depend on a single parameter, the absorbing column density along the line of sight, in accordance with the unified model. The diagram can be used to identify Compton thick sources and to isolate and study peculiar objects. From this analysis we have obtained a column density distribution of Seyfert 2 galaxies which is thought to be a good approximation of the real distribution. A large population of heavily absorbed objects is discovered, including many Compton thick candidates. Our results indicate that the mean Log N/ cm in type 2 Seyferts is 23.5 and that as much as 23-30 of sources have N 10 cm.
Subject headings: Active galactic nuclei- Seyfert 2 galaxies- Seyfert 2-high energy spectra; X-rays- [OIII] line emission
1 Introduction
The discovery of broad emission lines in the
polarized spectrum of a number of Seyfert 2 galaxies,
has provided the first observational evidence in favour of the unified model
which states that the main discriminating parameter between the two Seyfert
(Sey) types is the inclination of our line of sight with respect to an
obscuring torus
surrounding the nucleus (see Antonucci 1993 for a review).
X-ray data have subsequently reinforced this idea by
demonstrating that type 2 objects are generally characterized by
strong absorption, corresponding to column densities N
10 cm (Smith Done 1996, Turner et al. 1997a,
Maiolino et al. 1998).
X-ray measurements of the column densities in Sey2s
proved to be important in our understanding the nature
of the absorbing medium, the validity of the unifying theory and also
the relevance of type 2 objects to the synthesis of the X-ray
background.
The intrinsic absorption also defines the source characteristics:
for N 10 cm, X-rays
above a few keV can penetrate the torus making the source nucleus visible to
the observer and the column density measurable; in this case the source
is called ”Compton thin”.
For values of N around a few 10 cm, only X-rays
in the 10-100 keV range pass through the torus and so only data in this
band allow an estimate of the source column density.
For values of N higher than 10 cm, also
X-rays above a few tens of keV
are absorbed (as photons, after a few scattering,
are redshifted down to the photo-absorption regime) and the nucleus
is totally hidden to our view; in these sources only emission
reflected by the torus
(cold reflected component) or scattered by warm material near the nucleus
(warm scattered component) is observed. In this case, the photoelectric cut-off
(if any) in the observed spectrum does not provide information
on the real column density
absorbing the primary X-ray source and so the galaxy may be erroneously
classified as a low absorption object; therefore, for N
10 cm, the X-ray data can only provide a lower limit to the
value of the column density. These so called ”Compton thick”
sources are extremely faint
in X-rays and therefore until recently only a few were known
(Matt 1997).
The improvement in sensitivity of current X-ray telescopes has allowed
few more sources of this type to be discovered
(Turner et al. 1997b, Maiolino et al. 1998).
Evidence for the presence of obscuring material can also be obtained via X-ray spectroscopy as iron line emission is expected to be produced either via transmission through (Leahy Creighton 1993) or scattering/reflection by (Ghisellini et al. 1994, Matt et al. 1996a) the absorbing material . In most Compton thin cases the observed equivalent widths (EW) are of the order of a few hundred eV, consistent with the typical spectra of Sey1s transmitted through the observed column densities (Turner et al. 1998). When the column density increases to a few 10 cm, the line EW increases as it is measured against a depressed continuum; the EW can be higher than 1 keV for column densities 10 cm and such values are indeed observed in highly absorbed objects and Compton thick sources (Matt 1997, Maiolino et al. 1998). Although it is tempting to identify all sources with high equivalent width as Compton thick systems, such condition can also occur if the ionizing radiation is anisotropic (Ghisellini et al 1991), or if there is a lag between a drop in the continuum and in the line emission as indeed observed in NGC2992 by Weaver et al. (1996). Therefore when looking for Compton thick candidates, it is important to take other evidence into consideration.
Measuring the X-ray luminosity against an isotropic indicator of the intrinsic brightness of the source offers an alternative method for evaluating N: assuming that the unifying theory is correct, the X-ray flux is depressed with respect to this isotropic indicator by an amount related to the absorbing column density. Many authors have used the [OIII]5007 and Far-infrared (hereafter [OIII] and FIR respectively) luminosities as isotropic indicators of the source nuclear strength, without however considering their limitations: the [OIII] flux may be affected by large scale obscuration in the host galaxy (Maiolino Rieke 1995, Hes et al. 1993), while the FIR flux may be contaminated by a starburst component (Maiolino et al. 1995). While it is difficult to account for the starburst component, it is possible to correct the [OIII] emission for the extinction towards the Narrow Line Region as deduced from the Balmer decrement. Studies performed in the past have found that the ratio between the 2-10 keV X-ray and [OIII] fluxes (hereafter T or thickness parameter) cover the range 1-100 for both type 1 and type 2 objects. This was taken as evidence that the torus column density is never high on average (Mulchaey et al. 1994, Alonso-Herrero et al. 1997). However, these results were strongly biased for type 2 objects as it will become apparent in the following.
2 A 3D diagnostic diagram in the X-ray band
As the X-ray band provides 3 ways to measure the absorption along the line of sight (the photoelectric cutoff, the iron line EW and the thickness parameter T) it is convenient to plot Seyfert galaxies in this 3-dimensional parameter space.
Figure 1 is a plot of T versus EW for a large sample of Sey2s, with the value of the column density derived from the photoelectric cutoff coded in the symbols as indicated. In the Appendix, we present the database used for the present study. It consists of a sample of 73 objects for which ”good” X-ray spectra were available in the literature (see the Appendix for details on the selection criterion). The spectral fit of the hard X-ray data of these sources were quite homogeneous: an absorbed power law and a gaussian to account for the Fe line. [OIII] fluxes were also collected from the literature. Particular care has been taken to correct the [OIII] fluxes for reddening affecting the Narrow Line Region; this correction is not negligible in several cases (see Appendix) and provides a more meaningful estimate of the T parameter with respect to previous studies (Mulchaey et al. 1994, Alonso-Herrero et al. 1997). A few objects, although present in the Tables of the Appendix, have been discarded from the following analysis because of dubious data: F09104+4109 and Cygnus A have X-ray data probably contaminated by intracluster emission while for NGC5128 it is difficult to estimate both the [OIII] flux (see Appendix) and the nuclear X-ray flux (Turner et al. 1997c). In three cases (NGC3031/M81, NG6251 and IRAS20210+1121) a 6.7 keV line is the only iron K line detected and so its EW is plotted in the figure.
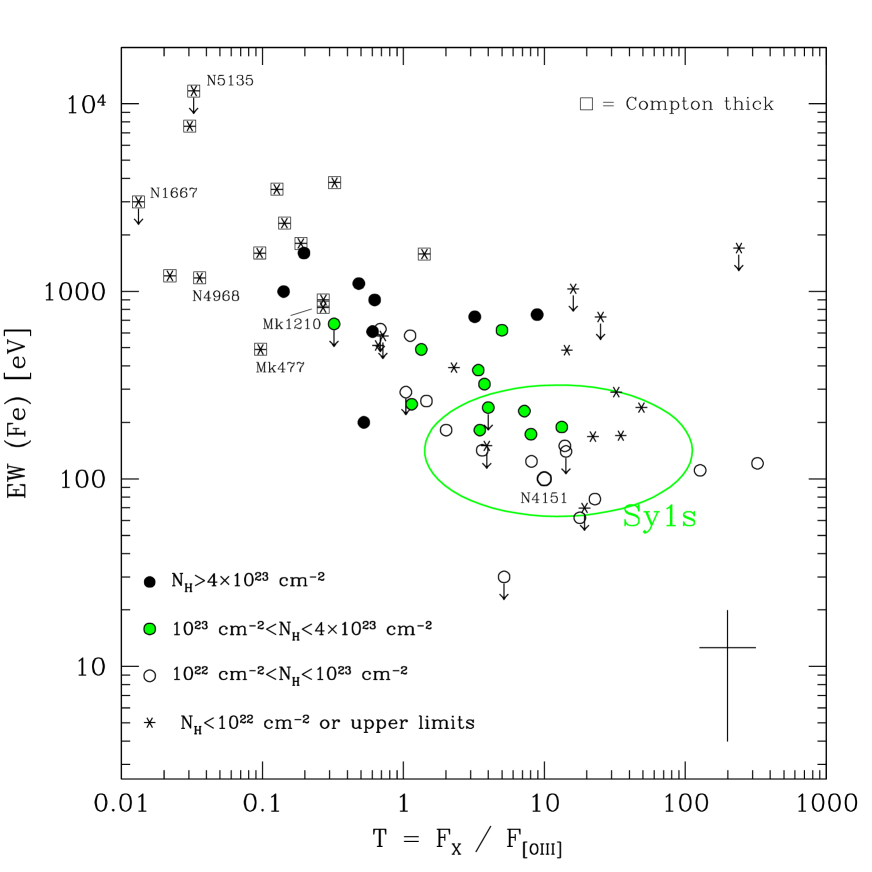
An immediate result of figure 1 is a T distribution quite different from previous reports; in particular T can be 1, in a significant fraction of Sey2s whereas all well studied Sey1s have T 1 (Maiolino et al. 1998). Since the sample used in building up this diagnostic diagram is highly heterogeneous, the relative populations of the various portions of it may not correspond to the real distribution. However the general shape of the diagram, which appears to be qualitatively in agreement with the unified theory and with the assumption that the dereddened [OIII] flux is an isotropic indicator of the intrinsic luminosity of the Sey nucleus, is meaningful and translates into quantitative terms the relations between the 3 absorption indicators which were sketched qualitatively in the introduction.
The relationship shown in figure 1 can be used to confirm already known Compton thick sources and to suggest new candidates; in particular, sources where the flux is too weak for spectral fitting and T is known to be 0.1 are likely to be highly absorbed objects (i.e. with N 10 cm).
In figure 1, 14 likely Compton thick sources are shown (see also Table 2 of the Appendix). These have a square around the symbol corresponding to the N value. Most of them have already been proposed as Compton thick sources in the literature (see for example Matt (1997) for NGC1068, Circinus galaxy and NGC6240, Malaguti et al.(1998) for NGC7674, Ueno et al. (1998) for F20210+1121 and Maiolino et al. (1998) for NGC1386, NGC2273, NGC3393 and NGC5643) and we confirm this classification on the basis of our diagram. Note that since for the sources discussed by Maiolino et al. (1998) the X-ray parameters are deduced from a simple model (see Appendix), NGC4939 is classified here as Compton thin although its nature is still uncertain.

.
The same diagram suggests five new Compton thick candidates: NGC5135, NGC4968 NGC1667, MKN1210 and MKN477. The cases of NGC5135 and NGC4968 were considered inconclusive by Turner et al. (1997b) because of the large uncertainty on the line EW. However the low value of T for both of them, almost two orders of magnitude lower than the average in Sey1s, and the small measured column density, consistent with being entirely due to galactic absorption, make them very likely Compton thick candidates. The same considerations apply to NGC1667 whose classification was also considered uncertain by Turner et al. Note, however, that an alternative interpretation for the location of this source in the diagnostic diagram is possible (see discussion below). MKN1210 and MKN477 can also be considered as Compton thick objects according to our diagnostic diagram, although their nature is less well defined than in previous cases. In particular, the EW is lower than expected in MKN477 but both the low T value and the observed flat X-ray spectrum, typical of reflection dominated sources, are consistent with our suggestion. On the other hand, the Compton thick nature of three other sources discussed by Turner et al. (1997b), namely MKN 273, MKN463 and NGC2992 is still questionable according to figure 1. In MKN 273 and MKN463, the 6.4 keV line EW is smaller than 600 keV and compatible with the observed column densities while the not so low values of T, 0.7 and 0.3 respectively, are consistent with Sey1 values if a correction for absorption is applied to the X-ray flux. Different is the case of NGC2992: Weaver et al. (1996) studied this source and reported a systematic decrease in the 2-10 kev luminosity by a factor of 16 over the last 20 years, while the iron line flux decreased only by a factor 2-3 and the reflection component became 5 times stronger. These authors interpreted the data in terms of a lag between reprocessed and intrinsic fluxes and accordingly located the reprocessor at the torus. We rephrase their statement and suggest that when an active nucleus fades away it moves along the diagnostic diagram at a constant column density, in a way which depends on the geometry and physics of the reflecting material. The temporal ”evolution” of NGC2992 in our diagnostic diagram is shown in figure 2, based on data in Table 1-2 of the Appendix and past data (Weaver et al. 1996). Another object similar to NGC2992 is NGC1808, which declined significantly in flux from Ginga to ASCA observation (Polletta et al. 1996, Turner et al. 1997a), thus moving in the diagram towards the region of high EW and low T values (see figure 2). It is therefore possible that, at a certain stage of their fading process, these ”dying” objects can be easily mistaken for Compton thick sources. This ambiguity is for example present in the case of NGC1667 (also displayed in figure 2), which historically has varied by a factor of 150 in the 2-10 keV band (Polletta et al. 1996, Turner et al. 1997a) moving in T from 1.5 to 0.01; only future observations will be able to assess the correct interpretation for this object. For the time being, we consider NGC1667 as a likely Compton thick candidate also in view of the significant uncertainties associated with the Ginga observation (Smith and Done 1996).
3 The distribution of absorption column densities in Sey2s
A 3D plot like figure 1 for a sample with known selection and completeness properties would provide statistically significant information on the true distribution of absorption column densities. Such an information would be extremely valuable for constraining the geometric parameters of the torus. The available sample is not statistically valid, nevertheless it provides some bounds to this true distribution. Figure 3 (upper panel) reports the distribution of column densities for all sources in our sample excluding objects with upper limits on N , but including MCG-05-18-002, which has been classified as a Compton thick source by Maiolino et al. (1998) simply on the basis of its low T value. Sources identified as Compton thick, i.e. with N 10 cm are indicated by a shaded area in the histogram; in particular since only data above 10 keV can rule out an absorbing column density in the range 10-10 cm , Compton thick sources for which these data are lacking are placed at N 10 cm, while the others are placed at N 10 cm. The most remarkable result of our analysis is the discovery of a large population of highly absorbed sources: more than half of the sample has N 10 cm, with 25 of the sources having N 10 cm.

In order to proceed beyond this statement, we have considered the intersection between our X-ray sample and the sample of Sey2s defined by Maiolino Rieke (1995) . The latter is an optical spectroscopic sample drawn from the RSA catalog of galaxies, which in turn is magnitude limited with respect to the host galaxy. According to the extensive discussion presented by the authors, the Maiolino Rieke sample of local active nuclei is much less affected by orientation and luminosity biases than any other similar sample. Out of the 71 Sey2s contained in Maiolino Rieke (1995), 36 are in our database and their column density histogram is also shown in figure 3 (lower panel). For this sample 64 of the objects has N 10 cm (even more if intermediate types are excluded) while the 28 with N 10 cm correspond to Compton thick or nearly Compton thick objects. The distribution has a mean Log N/cm of 23.5, significantly higher than what determined in the past.
We have also considered the intersection of our database and the extended 12 sample (Rush, Malkan Spinoglio 1993), which is a flux limited sample of 893 galaxies selected according to infrared properties. In this case, 31 objects appear in our X-ray catalog (irrespective of their classification in the 12 sample) and their N distribution is similar to those reported in figure 2: half of the sample (52) has N 10 cm, with 23 of the sources having N 10 cm. The results on both these sub-samples are in line with the finding of Maiolino et al. (1998) that the average obscuration of Sey2s, selected solely on the basis of their [OIII] flux, is much higher than found previously.
However, also the N distribution of these sub-samples may still be affected by biases. Even if the optical/infrared selection is unbiased, the X-ray selection (expecially for the EXOSAT, Ginga and the oldest ASCA data) favors sources already detected in previous all-sky surveys and therefore X-ray bright and/or little absorbed. We can then conclude that the true N distribution is likely to be even more shifted towards high N values. An estimate of the effect of this residual bias (hence an estimate of the ”true” N distribution) is presented in Risaliti (1998), who identifies the dominant bias in the various subsamples contributing to the X-ray database and extrapolates the partial N distributions to the entire Maiolino Rieke sample. At any rate, the large fraction of heavily obscured Sey2s that are beginning to be found may have important implications for the synthesis of the X-ray background and has to be taken in due account in future refinements of existing models (see for example Comastri et al. 1995).
Finally, note that a few sources in figure 3 have N values consistent with pure galactic absorption (i.e a few 10 cm); they also have T values typical of Sey1s. Some of them (M81 and NGC 5033) may be wrongly classified as Sey2s and probably are intermediate type 1.5 objects; also NGC4579 is probably a LINER, so that the low N value is compatible with its classification (see Appendix). On the other hand, NGC7590 and NGC3147 are bona-fide Sey2s in the optical and yet have negligible absorption. The low N could be reconciled with their Sey2s nature only if they were Compton thick, but this is not supported by their large T values (7 and 14, respectively) . Also, NGC3147 has an iron line equivalent width of 500 eV (consistent with a high absorption), but no line is detected in NGC7590. It is therefore tempting to conclude that there might be a few objects in which the Sey2s appearence is intrinsic and not due to obscuration. If confirmed, this would revive the long standing idea of a population of Sey2s (the ”true Sey2s”?) which just miss their broad line region (Tran 1995). Obviously more sources of this type should be identified before confirming this hypothesis.
4 Conclusions
We have presented a ”three dimensional” diagnostic diagram in the X-ray band for a large sample of Sey2s. The diagram shows the K iron line equivalent width as a function of both the N derived from the observed photoelectric cutoff and the 2-10 keV flux normalized to the [OIII] line flux (the latter corrected for extinction in the Narrow Line Region and assumed to be a true indicator of the source intrinsic luminosity). The source distribution in this 3-dimensional parameter space is in qualitative agreement with the unified model, suggesting that the optical thickness of the torus along the line of sight is the main parameter responsible for the source X-ray properties. The diagram is useful to calibrate N as a function of the flux ratio T: for faint sources this may be the only way to determine their Compton thick nature. It is also useful to isolate and study peculiar objects like ”dying” AGNs (like NGC2992) and ”true” Sey2s (like NGC7590). Finally, and most importantly, our results provide an estimate of the true N distribution for type 2 objects, which is an important input for the synthesis models of the X-ray background. From our sample we find a mean column density log N/cm 23.5, significantly larger than what determined in the past. We also find a large fraction of heavily absorbed objects, including a high percentage of Compton thick systems; out of these, several are newly classified ones.
Acknowledgement
M.D. acknowledges the CNR for a fellowship and the TeSRE Institute for the hospitality. This research has made use of data obtained through (1)NASA/IPAC Extragalactic Database (NED) which is operated by the Jet Propulsion Laboratory,Caltech under contract with the National Aeronautics and Space Administration, (2)the High Energy Astrophysics Science Archive Research Center (HEASARC) on line service provided by NASA-Goddard Space Flight Center and (3) the SIMBAD database at CDS, Strasbourg, France. Financial support by MURST, CNR and ASI is gratefully acknowledged; in particular, M.S., R.M. and G.R. have been partially supported by ASI through grant ARS-96-66 and G.Z. through grant ARS-96-70.
5 APPENDIX. The Catalog
The catalog presented in this Appendix contains all Sey 2s for which a ’reliable’ hard X-ray spectrum was available in the literature, i.e those galaxies having a spectrum observed in the 2-10 keV band that allows the determination of at least three of the following quantities: the photon index, the absorbing column density derived from the photoelectric cutoff, the 2-10 keV flux and the EW of the iron K line at 6.4 keV. In a few objects, the reported iron line energy is higher than 6.4 keV; these cases are highlighted by a note. Only objects classified as Seyferts of type 1.8, 1.9 or 2.0 either in NED, SIMBAD or according to Maiolino and Rieke (1995), have been included in the catalog. A few exception must be justified. The recently discovered galaxies AXJ131501+3141 and AXJ1749+684 have been included on the basis of their type 2 characteristics (akiy98; iwas97a). For some objects in the sample the classification based on their optical spectra is uncertain. In particular, some have features intermediate between those of Seyferts and LINERs, while intense star formation is present in some other sources. We also came across objects with uncertain Seyfert 2 classification (for example some sources have been recently reclassified as type 1-1.5 objects by mora96, ho97 and iwas98). These ambiguous, intermediate or composite classifications are indicated in Table 1 whenever possible.
In order to estimate the thickness parameter T=F/F, the catalog has been complemented with additional information on the [OIII] emission line flux and on the Balmer decrement (the latter aimed at the extinction correction). The [OIII] fluxes were obtained by various sources in the literature where we favored apertures larger than 100pc as projected on the source, so that most of the [OIII] emission coming from the Narrow Line Region is included. The contribution to the [OIII] flux from circumnuclear star forming regions is usually negligible. We favored data with higher signal to noise ratio and most recent publications. Also, to determine the Balmer decrement, we preferred data that were corrected for H stellar absorption. Whenever more than one paper provided data of similar quality, the average value for both the Balmer decrement and the [OIII] line flux was estimated and in the [OIII] case also the standard deviation between the various data was reported in the table as an uncertainty estimate. The [OIII] fluxes were corrected for optical reddening whenever a value of the Balmer decrement was available by using the following relation:
F= F [(H/H)/(H/H)]
and assuming an intrinsic Balmer decrement (H/H) =3. Whenever a broad component for H or H was present (Seyfert 1.8 and 1.9), only the narrow components were used.
The sample presented here contains 73 objects (57 of type 2.0, 11 of type 1.9, 4 of type 1.8 and 1 NLXG) which are listed in Table 1 along with optical position in equatorial coordinates for epoch J2000 (col.[2]), redshift z (col. [3]) as reported in NED (NASA Extragalactic Database), Seyfert type (col.[4]), galactic HI column density from 21 cm measurements in units of 10 cm (col.[5]) from HEASARC (High Energy Astrophyisics Science Archive Research Center) on line service, Balmer decrement (col.[6]) and reddening corrected [OIII] emission line flux (col.[7]) in units of 10 erg cm s. References relative to the Balmer decrement as well as to the [OIII] flux are quoted as small numbers in col. [6] and [7] respectively and reported at the end of the Table. The origin of the classification is reported in small letters next to col. [4]. The redshift of most sources falls in the interval 0.002 z 0.03 with the largest redshift in the sample being z0.4.
X-ray data are presented in Table 2, which reports the photon index (col.[2]),the hydrogen column density N in units of 10 cm derived from the photoelectric cutoff (col. [3]), the fluorescence iron line Equivalent Width in eV (col.[4]) as well as the 2-10 keV flux both observed (col.[5]) and corrected for the measured absorption (col.[6]) in units of 10 erg cm s; data reported in col.[2],[3] and [4] are listed together with their associated errors (generally these corresponds to 90 confidence level except in a few cases, see for example turn97a). The majority of our X-ray data come from either Ginga or ASCA observations supplemented with recent measurements performed by the BeppoSAX satellite(maio98; mala98; ueno98). Most of these hard X-ray data (which are reported here as quoted in the original reference) were fitted with an absorbed power law and a gaussian to account for the iron line. Some authors presented also alternative fits (eg. reflected continua as done for example in turn97a; maio98); but we always adopted the transmission model (absorbed power law), both for homogeneity with the other data and to avoid the a priori assumption of a Compton thick model (the Compton thick nature of some sources is what we want to determine a posteriori by means of our diagram).
In order to enlarge the dataset, we have also searched the ASCA public archive for spectra of sources fulfilling our selection criterium and not yet available in the literature. Data preparation has been done using version 1.3 of the XSELECT software package and version 4.0 of FTOOLS. Good time intervals were selected by applying the ”Standard REV 2 Screening” criteria (as reported in Chapter 5 of the ASCA Data Reduction Guide, rev 2.0). Only GIS2 and GIS3 data have been analyzed; HIGH,MEDIUM and LOW bit rate data have been combined together. Source counts were extracted from a circular region around the centroid of the X-ray emission whose radius maximize the signal to noise ratio; similarly background data were taken from circular uncontaminated regions close to the X-ray source. The gis2v4-0.rmf and gis3v4-0.rmf were used as detector redistribution matrix(RMF). The Ancillary Response Files (ARF) were created with the version 2.7 ASCAARF at the source location in the detector. In order to improve the statistics a combined GIS2+GIS3 spectrum was produced together with its respective background and response matrix files following the recipe given in the ASCA Data Reduction (rev2.0) Guide. In order to use the statistics in the fitting procedure spectral data have been rebinned to give at least 20 counts per bin. Only for 3 sources (NGC3281, NGC7590 and F17020+4544) useful data could be obtained (mostly due to the low signal to noise ratio of the observations); in these cases count rates have been analyzed by using the XSPEC 10.0 (X-ray Spectral Fitting) software package for data modelling. Each of these observations have been fitted with a simple model consisting of an absorbed power law plus a narrow gaussian line and an additional power law component to take into account the soft X-ray emission; the spectral indices of the two power law components have been tied together. Fitting the data with more complex models, as suggested by recent works (see for example turn97a and references therein), is beyond the purpose of this work and is therefore postponed to a future paper.
The number beside the name of each object indicates the reference (listed at the end in a footnote) from which the parameters reported in Table 2 were obtained; the letter beside some sources, those identified as Compton thick in section 2, indicate the lower limit available on N. For some sources more than one dataset was available in the literature: in order to facilitate the use of the catalog only one entry, generally that representing the most complete, recent or best fit publication has been included in Table 2. The list of references contained in Table 1 and 2 should represent to the best of our knowledge a complete survey of the literature up to the end of 1997, giving the largest sample of hard X-ray data on Seyfert 2 galaxies yet available. The complete catalog is available in computer readable form (ASCII file). Copies can be requested from L. Bassani (Istituto TESRE/CNR- Via Gobetti 101, 40129 Bologna, ITALY, loredana@botes1.tesre.bo.cnr.it).
| Name | RA & Dec. (2000) | z | class | N | H/H | F | |
|---|---|---|---|---|---|---|---|
| 1 | MKN 937 | 00 10 10.0 04 42 38 | 0.02952 | S2/S1 | 3.34 | ||
| 2 | MKN348 | 00 48 47.1 +31 57 25 | 0.01514 | S2 | 5.86 | 6.02 | 0.176 |
| 3 | IC1631 | 01 08 44.8 46 28 33 | 0.03084 | S2 | 2.17 | 7.30 | 0.052 |
| 4 | NGC526a | 01 23 54.2 35 03 56 | 0.01922 | S2/S1.5 | 2.20 | 3.00 | 0.027 |
| 5 | NGC1068 | 02 42 40.6 00 00 48 | 0.00379 | S2 | 3.53 | 7.00 | 15.86 |
| 6 | NGC1275 | 03 19 48.1 +41 30 42 | 0.01756 | S1.9/S1.5 | 14.9 | 5.00 | 0.311 |
| 7 | NGC1365 | 03 33 36.3 36 08 26 | 0.00546 | S1.8 | 1.39 | 8.70 | 0.141 |
| 8 | NGC1386 | 03 36 45.3 35 59 57 | 0.00290 | S2 | 1.37 | 5.70 | 0.655 |
| 9 | MCG0112006 | 04 25 55.6 08 34 07 | 0.03920 | S2 | 6.23 | 11.50 | 0.018 |
| 10 | NGC1672 | 04 45 42.1 59 14 57 | 0.00450 | S2 | 2.28 | 6.80 | 0.077 |
| 11 | NGC1667 | 04 48 37.1 06 19 12 | 0.01517 | S2 | 5.49 | 9.74 | 0.197 |
| 12 | [HB89]0449183 | 04 51 37.3 18 18 44 | 0.33800 | S2 | 3.88 | 7.00 | 0.005 |
| 13 | F045757537 | 04 55 59.6 75 32 27 | 0.01810 | S2 | 8.56 | 12.5 | 0.331 |
| 14 | NGC1808 | 05 07 42.3 37 30 46 | 0.00334 | S2/SB | 2.70 | 14.2 | 0.131 |
| 15 | F051892524 | 05 21 01.4 25 21 45 | 0.04256 | S2 | 1.92 | 23.4 | 0.083 |
| 16 | NGC2110 | 05 52 11.4 07 27 22 | 0.00762 | S2 | 18.3 | 8.15 | 0.321 |
| 17 | MKN3 | 06 15 36.3 +71 02 15 | 0.01351 | S2 | 8.38 | 6.67 | 4.600 |
| 18 | NGC2273 | 06 50 08.7 +60 50 45 | 0.00614 | S2 | 6.97 | 6.92 | 0.277 |
| 19 | MKN1210 | 08 04 05.9 +05 06 50 | 0.01350 | S2 | 3.73 | 5.20 | 0.482 |
| 20 | NGC2639 | 08 43 38.0 +50 12 20 | 0.01062 | S1.9 | 3.00 | 4.16 | 0.005 |
| 21 | F09104+4109 | 09 13 44.0 +40 56 34 | 0.44200 | S2 | 0.98 | 3.00 | 0.035 |
| 22 | NGC2992 | 09 45 42.0 14 19 35 | 0.00771 | S1.9 | 5.26 | 6.97 | 0.680 |
| 23 | MCG52316 | 09 47 40.2 30 56 54 | 0.00828 | S2 | 8.00 | 8.00 | 0.409 |
| 24 | NGC3031/M81 | 09 55 33.2 +69 03 55 | 0.0001 | S1.8/S1.5 | 4.16 | 3.19 | 0.043 |
| 25 | NGC3081 | 09 59 29.5 22 49 35 | 0.00796 | S2 | 4.61 | 4.40 | 0.215 |
| 26 | NGC3079 | 10 01 57.8 +55 40 47 | 0.00375 | S2/L/SB | 7.89 | 25.0 | 0.090 |
| 27 | NGC3147 | 10 16 53.6 +73 24 03 | 0.00941 | S2 | 3.64 | 5.26 | 0.009 |
| 28 | NGC3281 | 10 31 52.0 34 51 12 | 0.01154 | S2 | 6.42 | 6.13 | 0.045 |
| 29 | MCG+1210067 | 10 44 08.7 +70 24 19 | 0.03280 | S2 | 2.64 | 7.20 | 0.075 |
| 30 | NGC3393 | 10 48 24.0 25 09 40 | 0.01370 | S2 | 6.05 | 4.12 | 0.316 |
| 31 | NGC4258 | 12 18 57.5 +47 18 14 | 0.00149 | S1.9 | 1.16 | 9.12 | 0.262 |
| 32 | NGC4388 | 12 25 47.2 +12 39 40 | 0.00842 | S2/SB | 2.60 | 5.50 | 0.374 |
| 33 | NGC4507 | 12 35 36.5 39 54 33 | 0.01180 | S2 | 7.23 | 4.50 | 0.158 |
| 34 | NGC4579 | 12 37 43.5 +11 49 05 | 0.00507 | S1.9/L | 2.47 | 3.22 | 0.009 |
| 35 | NGC4594 | 12 39 58.8 11 37 28 | 0.00364 | S1.9/L | 3.77 | 3.45 | 0.007 |
| 36 | NGC4939 | 13 04 43.3 10 20 23 | 0.01038 | S2 | 3.35 | 4.50 | 0.112 |
| 37 | NGC4941 | 13 04 13.1 05 33 06 | 0.00370 | S2 | 2.42 | 6.80 | 0.355 |
| 38 | NGC4945 | 13 05 27.5 49 28 06 | 0.00187 | S2/SB | 15.7 | ||
| 39 | NGC4968 | 13 07 06.0 23 40 43 | 0.00986 | S2 | 9.16 | 14.9 | 1.116 |
| 40 | NGC5033 | 13 13 27.3 36 35 36 | 0.00292 | S1.9/S1.5 | 1.01 | 4.48 | 0.017 |
| 41 | AXJ1315013141 | 13 15 01.1 +31 41 28 | 0.07200 | S2 | 1.11 | 7.58 | |
| 42 | PKS B1319164 | 13 22 24.5 16 43 43 | 0.01718 | S1.8 | 5.81 | 4.17 | 0.401 |
| 43 | NGC5128/CENA | 13 25 27.6 43 01 08 | 0.00183 | S2 | 8.62 | 5.50 | 0.007 NNFor this object the only [OIII] measurement available was taken with an aperture smaller than 100pc as projected on the source and, therefore, this data are likely to miss a significant fraction of the [OIII] flux. |
| 44 | NGC5135 | 13 25 49.9 29 50 02 | 0.01372 | S2 | 4.65 | 7.80 | 0.614 |
| 45 | NGC5194/M51 | 13 29 52.3 +47 11 54 | 0.00154 | S2 | 1.57 | 8.33 | 0.228 |
| 46 | NGC5252 | 13 38 15.9 +04 32 33 | 0.02298 | S1.9 | 1.97 | 3.72 | 0.039 |
| 47 | MKN273 | 13 44 42.1 +55 53 13 | 0.02778 | S2/L | 1.09 | 9.33 | 0.084 |
| 48 | MKN463E | 13 56 02.6 +18 22 18 | 0.05100 | S2 | 2.06 | 5.59 | 0.124 |
| 49 | CIRCINUS | 14 13 10.2 65 20 21 | 0.00145 | S2/SB | 55.6 | 19.1 | 6.970 |
| 50 | NGC5506 | 14 13 14.8 03 12 27 | 0.00618 | S1.9 | 3.81 | 7.20 | 0.600 |
| 51 | NGC5643 | 14 32 40.7 44 10 28 | 0.00400 | S2 | 8.34 | 6.40 | 0.694 |
| 52 | NGC5674 | 14 33 52.2 +05 27 30 | 0.02492 | S1.9 | 2.46 | 4.90 | 0.059 |
| 53 | MKN477 | 14 40 38.1 +53 30 16 | 0.03780 | S2/NS1 | 1.30 | 5.40 | 1.238 |
| 54 | NGC6251 | 16 32 31.8 +82 32 16 | 0.02302 | S2 | 5.49 | 15.1 | 0.057 |
| 55 | NGC6240 | 16 50 27.5 +02 28 58 | 0.02448 | S2-L/SB | 5.68 | 17.2 | 0.135 |
| 56 | F17020+4544 | 17 03 30.3 +45 40 46 | 0.06040 | S2 /NS1 | 2.22 | 5.40 | 0.024 |
| 57 | MKN507 | 17 48 38.4 +68 42 16 | 0.05590 | S2/NS1 | 4.37 | 4.70 | 0.002 |
| 58 | AXJ1749+684 | 17 49 49.0 68 23 03 | 0.05000 | NLXG | 4.48 | 7.32 | 0.004 |
| 59 | NGC6552 | 18 00 07.2 +66 36 55 | 0.02600 | S2 | 4.23 | 5.11 | 0.096 |
| 60 | F183255926 | 18 36 57.9 59 24 09 | 0.02023 | S1.8 | 7.15 | 10.6 | 0.752 |
| 61 | ESO103G35 | 18 38 20.1 65 25 42 | 0.01329 | S2 | 7.64 | 6.31 | 0.112 |
| 62 | CYGNUS A | 19 59 28.2 +40 44 02 | 0.05605 | S2 | 34.7 | 5.40 | 0.080 |
| 63 | F20210+1121 | 20 23 25.9 +11 31 31 | 0.05639 | S2 | 13.8 | 6.40 | 0.314 |
| 64 | IC5063 | 20 52 01.9 57 04 09 | 0.01135 | S2 | 6.73 | 5.80 | 0.353 |
| 65 | F20460+1925 | 20 48 17.9 +19 36 57 | 0.18100 | S2 | 11.2 | 7.08 | 0.103 |
| 66 | IC 1368 | 21 14 12.1 +02 10 38 | 0.01305 | S2 | 6.55 | ||
| 67 | NGC7172 | 22 02 01.6 31 52 19 | 0.00868 | S2 | 1.65 | 3.00 | 0.004 |
| 68 | NGC7314 | 22 35 46.0 26 03 03 | 0.00474 | S1.9 | 1.46 | 20.0 | 1.770 |
| 69 | NGC7319 | 22 36 03.4 +33 58 33 | 0.02256 | S2 | 8.01 | 4.72 | 0.024 |
| 70 | F23060+0505 | 23 08 34.0 +05 21 30 | 0.17300 | S2 | 5.51 | 13.8 | 0.144 |
| 71 | NGC7582 | 23 18 23.4 42 22 15 | 0.00525 | S2 | 1.93 | 7.60 | 0.445 |
| 72 | NGC7590 | 23 18 55.0 42 14 17 | 0.00532 | S2 | 1.96 | 5.40 | 0.017 |
| 73 | NGC7674 | 23 27 56.6 +08 46 44 | 0.02906 | S2 | 5.15 | 4.80 | 0.185 |
| ⋆⋆footnotetext: Classification is as follows S=Seyfert, L=Liner, SB=Starburst §§footnotetext: Galactic HI column density from 21 cm measurements in units of 10 cm from HEASARC on line service ††footnotetext: Corrected [OIII] fluxes in units of 10 erg cm s |
References. — ()NED; ()SIMBAD; ()mari95; ()akiy98; ()iwas97a; ()mora96; ()ho97; ()vero97; ()lh96
References. — ()dade88; ()poal96; ()wink92; ()stbe95; ()vece86; ()ho97; ()stbe89; ()phil83; ()step89; ()vign98; ()veil95; ()lons92; ()witt92; ()terl91; ()craw96; ()ho93; ()cruz94; ()diaz88; ()heck80; ()durr86; ()stau82; ()oste85; ()akiy98; ()dero88; ()oste93; ()oliv94; ()Oliva, 1998 private communications; ()shud81; ()kim95; ()laur89; ()degr92; ()iwas97a; ()Moran, 1997 private communication; ()iwas95; ()stoc94; ()pere90; ()vade93; ()berg83; ()frog89; ()vace97; ()keel85.