IS COSMOLOGY SOLVED?
An Astrophysical Cosmologist’s Viewpoint
Abstract
We have fossil evidence from the thermal background radiation that our universe expanded from a considerably hotter denser state. We have a well defined, testable, and so far quite successful theoretical description of the expansion: the relativistic Friedmann-Lemaître cosmological model. The observational successes of this model are impressive but I think hardly enough for a convincing scientific case. One way to see the limitations is to compare the lists of observational constraints and free hypotheses within the model; they have similar lengths. Another way to assess the state of the cosmological tests is to consider the search for concordant measures of the mass density parameter and the cosmological constant. The scorecard shows that the high density Einstein-de Sitter model is seriously challenged, but that there is not much to choose between the grades for low mass density models with and without a cosmological constant. That is, it is hard to argue that the Friedmann-Lemaître model is strongly overconstrained, the usual criterion for a mature theory. Work in progress will significantly improve the situation and may at last yield a compelling test. If so, and the Friedmann-Lemaître model survives, it will close one line of research in cosmology: we will know the outlines of what happened as our universe expanded and cooled from high density. It will not end research, of course; some of us will occupy ourselves with the details of how galaxies and other large-scale structures came to be the way they are, others with the issue of what our universe was doing before it was expanding. The former is being driven by rapid observational advances. The latter is being driven mainly by theory, but there are hints of observational guidance.
keywords:
cosmology: theory — cosmology: observations1 Introduction
Since few of us can see any indication we are nearing the end of search and discovery in cosmology we have to adopt a convention for the meaning of “cosmology solved.” I take it to be a positive outcome of accurate and well cross-checked tests of the relativistic Friedmann-Lemaître cosmological model. We are not there yet, but all signs are that now, some seven decades after the first of the tests were proposed, we may be approaching a major closure.
Many of my colleagues have concluded that the observational successes of the Friedmann-Lemaître model combined with its logical plausibility already make the case, and it is time to move on to the issue of how initial conditions for this model were set by the deeper physics of the very early universe, and how that led to the origin of the world as we know it. This positive attitude is healthy but maybe a little incomplete. I am taken by Willem de Sitter’s (1931) remark: “It should not be forgotten that all this talk about the universe involves a tremendous extrapolation, which is a very dangerous operation.” Observational advances since then have greatly reduced the danger, but I think should leave us with a sense of wonder at the successes in probing the large-scale nature of the physical universe and caution in deciding just how well we understand the situation.
A satisfactory understanding is easily defined: there must be more pieces of evidence than parameters we are free to adjust to fit the evidence. In §2 I comment on the still uncomfortably similar lengths of the lists of hypotheses and observational constraints in cosmology. Many cosmological tests constrain the two dimensionless parameters and that measure the relative contributions of matter and Einstein’s cosmological constant to the expansion rate in the Friedmann-Lemaître model. If we can establish that concordant values of these parameters follow from many more than two observational constraints we will have an important positive test of the model. I argue in §3 that there still is an uncomfortably large number of open issues: the parameters are not strongly overconstrained. In short, many commonly discussed elements of cosmology still are on dangerous ground. Work in progress promises to improve the situation; the community will be following the results with great interest to learn whether this aspect of cosmology may at last be declared “solved.”
2 Is Our Cosmology Predictive?
2.1 The Expanding Universe
The first part of Table 1 refers to the idea that our universe has expanded from a considerably hotter denser state. Here, as Joe Silk describes in his contribution to these proceedings, we are on reasonably safe ground. Distant objects, whose recession velocities approach the velocity of light, are quite close to isotropic around us. Since distant galaxies seem to be equally good homes for observers the straightforward interpretation is that the universe is close to homogeneous in the large scale average. In a homogeneously expanding universe the recession velocity is proportional to the distance. This is Hubble’s law; it is observationally well established. We are in a uniform sea of cosmic background radiation, the CBR, with a spectrum that is quite close to thermal at K. The only known explanation is relaxation to statistical equilibrium. This could not have happened in the universe as it is now because space is transparent: distant galaxies are observable as radio sources at CBR wavelengths. The inference is that the CBR is a remnant from a time when the universe was denser, hotter, and optically thick. That is, we have direct fossil evidence of the expansion and cooling of the universe.
All these results follow by symmetry arguments with conventional local physics; one does not need the full machinery of general relativity theory. Relativity is probed in more detailed tests.
2.2 The Cosmological Tests
Joe Silk and Michael Turner discuss another likely fossil remnant of a time when our universe was very different from now. In the hot Friedmann-Lemaître model helium and other light elements were produced in thermonuclear reactions as the universe expanded and cooled through temperatures MeV. This result is the first entry in the second part of Table 1. It uses the Friedmann-Lemaître expression for the expansion rate,
| (1) |
where
| (2) |
and is the expansion factor (such that the distance between conserved objects scales with the expansion of the universe as ). The mass density includes rest mass and the mass equivalent of energy; equation (1) is a relativistic expression. But since you can guess at its form by analogy to Newtonian mechanics it is not a very deep application of general relativity theory. For that we must consider more of the cosmological tests.
The baryon density is an adjustable parameter in this theory. It is impressive that the value of that yields a satisfactory fit to the the observed abundances of the light element fits the astronomical surveys of the baryon density (Fukugita, Hogan, & Peebles 1998), but the check is only good to a factor of three or so. The wanted baryon density is less than the mass density parameter indicated by dynamical studies of the motions of galaxies relative to the general expansion (as discussed in §3.1). That is remedied by an hypothesis, that the mass of the universe is dominated by nonbaryonic matter. The straightforward reading of the dynamical estimates is that is less than unity, contrary to the simple Einstein-de Sitter case. A popular remedy is another postulate, that the mass of the universe is dominated by dark matter outside the concentrations of galaxies.
We have a check on , from the magnificent work by two groups (Perlmutter et al. 1998a,b; Reiss et al. 1998) on the curvature of the redshift-magnitude (-) relation for supernovae of type Ia. A cautionary note is in order, however. The most distant supernovae are fainter than would be expected in the Einstein-de Sitter case. How do we know that is not because the more distant supernovae are less luminous? The authors present careful checks, but the case has to be indirect: no one is going to examine any of these supernovae up close, let alone make the trip back in time to compare distant supernovae to nearer examples. In short, the supernovae measurement is a great advance, beautifully and carefully done, but it does not come with a guarantee. The point is obvious to astronomers but not always to their colleagues in physics, and so might well be encoded in the Tantalus Principle: in astronomy you can look but never touch (with a few exceptions, such as objects in the Solar System, that are quite irrelevant for our purpose).
The straightforward reading of the SNeIa - relation within the Friedmann-Lemaître model is that is well below unity, consistent with dynamics, and that there is a significant contribution to the stress-energy tensor from Einstein’s cosmological constant (or a term in the stress-energy tensor that acts like ). The latter has to be counted as another hypothesis, of course. This in turn can be checked by still more cosmological tests, such as the expansion time. But as discussed in the next section we don’t yet have the wanted precision.
Our tour of the second set of tests in Table 1, that probe space-time geometry, shows no postulates that appear artificial, which is encouraging. But we do see that each constraint is met with a new free parameter, which is a dangerous operation, to quote de Sitter (1931).
2.3 Structure Formation
The third part of Table 1 refers to tests of the Friedmann-Lemaître model from the condition that it admit a theory for the origin of cosmic structure: galaxies and all that. Here the danger is that we are testing two theories, cosmology and structure formation. Within the gravitational instability picture the latter requires a prescription for the important dynamical actors — it may include cold dark matter, massive neutrinos, cosmic strings, or other fields — and the character of the departures from homogeneity at high redshift. A commonly discussed model assumes Gaussian adiabatic fluctuations in cold dark matter, baryons, massless neutrinos, and the thermal cosmic background radiation (the CBR). That leaves one free function, the power spectrum of the initial mass density fluctuations, to fit to two functions, the spectra of fluctuations in the present space distribution of the mass and in the present angular distribution of the CBR. It is impressive that we can adjust the one function to match both sets of observations. But as discussed in §3.4 we do not yet have firm evidence that the initial conditions are Gaussian, or that they are adiabatic, or that the model takes account of all the important dynamical actors. We expect to have a check: if precision measurements in progress of the CBR and the large-scale matter distributions match in all detail the predictions of one of the simple models now under discussion, for reasonable values of the cosmological parameters, it will make believers of us all (or at least many of us). But before deciding to become a believer it might be wise to wait to see what the measurements reveal.
3 A Scorecard
I turn now to some details. The scorecard in Table 2 shows three parameter choices. In the Einstein-de Sitter case the density parameter is and space curvature and the cosmological constant are negligibly small. The second case has zero space curvature and positive , the third negligibly small and negative space curvature. A passing grade () means the measurements are consistent with the parameters within the Friedmann-Lemaître model, a negative grade (X) that there seems to be a significant inconsistency. The greater the number of question marks the greater the level of doubt about the grade.
3.1 Dynamical Mass Estimates
Here is an example that illustrates features common to many dynamical estimates of the mean mass density.
We are near the edge of a concentration of galaxies that de Vaucouleurs (1956) called the Local Supercluster. It is centered near the Virgo cluster, at distance
| (3) |
where Hubble’s constant is written as
| (4) |
and the dimensionless parameter is thought to be in the range . In the Friedmann-Lemaître model the gravitational attraction of the mass excess in this region produces a peculiar motion of inflow (relative to the general expansion of the universe). In linear perturbation theory the mass conservation law relates the peculiar velocity and the mass density contrast by the equation
| (5) |
The divergence is with respect to comoving coordinates x, where a physical length interval is (and the expansion parameter appears in eq. [1]). The density fluctuations are assumed to have grown by gravity out of small primeval irregularities, so the mass density contrast varies as , where is the growing solution to the time evolution of in linear perturbation theory. The result of integrating equation (5) over a sphere of radius and applying Gauss’s theorem is the wanted relation,
| (6) |
Here is the unit normal of the sphere, is the radial inward peculiar velocity averaged over the surface, and is the mass contrast averaged within the sphere. The dimensionless factor is
| (7) |
The power law is a good approximation if or space curvature vanishes.
For a sphere centered on the Virgo Cluster, with us on the surface, estimates of the mean radial flow through the sphere and the contrast in galaxy counts within the sphere are
| (8) |
The velocity is from a survey in progress by Tonry et al. (1998); it is consistent with earlier measurements (eg. Faber & Burstein 1988). The density contrast in counts of IRAS galaxies within our distance from the Virgo cluster is (Strauss et al. 1992). IRAS galaxies are detected because they are rich in gas and have high star formation rates, making them prominent in the 60 to 100 micron range of the IRAS satellite survey. IRAS galaxies avoid dense regions, likely because collisions and the ram pressure of intracluster gas have stripped the galaxies of the gas that fuels bursts of star formation and high infrared luminosity; a commonly used correction factor of 1.4 would bring the contrast for optical galaxy counts to . A preliminary analysis of the Optical Redshift Survey (Santiago et al. 1996) by Strauss (1998) gives . With , equations (6) to (8) give
| (9) |
This is plotted as the right-hand point in Figure 1.
There are three key assumptions. First, the analysis uses conventional gravity physics. An alternative, Milgrom’s (1995) modified Newtonian dynamics (MOND), has been quite durable in applications to individual galaxies (de Blok & McGaugh 1998). An extension to the analysis of large-scale flows would be interesting, but the focus here is the test of cosmology based on the conventional gravity physics of general relativity theory. Second, the relation between peculiar velocities and the mass distribution follows from the assumption that structure grew by gravity out of small primeval departures from homogeneity. (Thus the boundary condition for eq. [7] is at .) Most dynamical measures of use this assumption; the exception is relaxed systems that have forgotten their initial conditions (as in the velocity dispersion measure used by Marzke et al. 1995.) We have no viable alternative to the gravitational instability picture for structure formation on large scales, but it will be checked by consistency with all the other cosmological tests, when they are better established. Third, and most contentious, equation (9) assumes the mass clusters with the galaxies. If the mass contrast were reduced to then the other numbers would be consistent with . The concept that the galaxy distribution may be a biased measure of the mass distribution has been influential, and rightly so; this important issue had to be explored. But as discussed next I think it is also fair to say that there never was any evidence for what I would expect to be the distinctive signature of biasing: void galaxies.
If we must decide where most of the mass is. It can’t be in groups and clusters of galaxies: Figure 1 shows that analyses similar to the above yield similar values of in the Local Group (Peebles 1996) and in clusters of galaxies (Carlberg et al. 1996). That leaves the voids, spaces between the concentrations of giant galaxies. We know the voids are not undisturbed: absorption lines in quasar spectra show that at redshift space was filled with clouds of hydrogen. Thus voids would have to be regions where star or galaxy formation was suppressed. I find it hard to believe the suppression was so complete as to leave nothing observable; surely there would be irregulars or dwarfs from almost failed seeds. Searches in relatively nearby voids, where galaxies are observable well into the faint end of the luminosity function, reveal no such population. Perhaps the gravitational growth of clustering swept the void galaxies into the concentrations of normal ones, but in that case gravity would have pulled the mass with the galaxies, suppressing biasing (Tegmark & Peebles 1998). Perhaps our picture for structure formation needs tuning; that will be checked as the cosmological tests improve. The straightforward reading is that biasing is not a strong factor; is substantially less than unity. This is the basis for the grades in line 1a in Table 2. The grades are subject to negotiation, of course; the discovery of a population of void galaxies would make a big difference to me.
The theory of the origin of the light elements requires baryon density parameter for . It is not easy to reconcile the dynamical analyses with such a small value for . As I noted in the last section, the common assumption is that the mass of the universe is dominated by nonbaryonic dark matter. There certainly is nothing unreasonable about the idea—Nature need not have put most of the matter in a readily observable form—but the cosmology certainly would be cleaner if we had a laboratory detection of this hypothetical mass component.
3.2 Expansion Rate and Time
Since we are considering what the Friedmann-Lemaître model does and does not predict we should note that the model allows solutions without a Big Bang, that trace back through a bounce to contraction from arbitrarily low density. This requires and positive space curvature, and, if the universe is going to contract by a substantial factor before bouncing, very large space curvature and small matter density: the redshift at the bounce is . The bounce case is seldom mentioned, and I suspect rightly so, for apart from the bizarre initial conditions the redshift required for light element production requires quite unacceptable density parameters. If this assessment is valid we are left with Friedmann-Lemaître solutions that trace back to infinite density, which is bizarre enough but maybe can be finessed by inflation and resolved by better gravity physics.
A Friedmann-Lemaître model that expands from exceedingly high density predicts that stellar evolution ages and radioactive decay ages are less than the cosmological expansion time . Numerical examples are
The Hubble Space Telescope Key Project (Freedman et al. 1998; Madore et al. 1998) reports
| (11) | |||||
The systematic error includes length scale calibrations common to most measurements of . A recent survey of evolution ages of the oldest globular cluster stars yields Gyr. (Chaboyer et al. 1998). We have to add the time for expansion from very high redshift to the onset of star formation; a commonly used nominal value is 1 Gyr. If the universe is 14 Gyr old this would put the onset of star formation at in the Einstein-de Sitter model, if and . Since star forming galaxies are observed in abundance at (Pettini et al. 1998 and references therein) this is conservative. These numbers give
| (12) |
where the standard deviations have been added in quadrature.
The result agrees with the low density models in equation (3.2). The Einstein-de Sitter case is off by 1.6 standard deviations, not a serious discrepancy. It could be worse: Pont et al. (1998) put the minimum stellar evolution age at 13 Gyr. With 1 Gyr for star formation this would make the Einstein-de Sitter model off. It could go the other way: an analysis of the distance scale implied by the geometry of the multiply lensed system PG 1115+090 by Keeton & Kochanek (1997) puts the Hubble parameter at . At Gyr this says , nearly centered on the Einstein-de Sitter value. An elegant argument based on the globular cluster distance to the Coma Cluster of galaxies leads to a similar conclusion (Baum 1998). Most estimates of are larger, however, and the correction to for the time to abundant star formation is conservative, so in line 1b of Table 2 I give the Einstein-de Sitter model a modest demerit for its expansion time.
The low density cases pass the time-scale constraint at the accuracy of the present measurements. Since a satisfactory and it is to be hoped feasible measurement would distinguish between the open and flat cases I lower their grades from this test to ?.
3.3 Probes of Spacetime Geometry
If spacetime is close to homogeneous and isotropic and described by a single line element then the geometry is represented by two functions of redshift: fixes the angle subtended by an object of given linear size at redshift , and fixes proper world time as a function of redshift. The latter determines , the former the - relation. In the measurements of the - relation by Perlmutter et al. (1998a,b) and Reiss et al. (1998) the cosmologically flat Friedmann-Lemaître model with and is within one standard deviation, the open model with and is about off, and the Einstein-de Sitter model is some off. I explained in §2.2 why I suspect the case against the open low density model is serious but maybe premature: we should await further consideration of these new measurements by the authors and the community. The Einstein-de Sitter model would require a more substantial reconsideration, so it gets a more serious demerit in line 1c in Table 2.
Both functions, and , enter galaxy counts and the rate of lensing of quasars by the gravitational deflection of the masses in foreground galaxies. The importance of the latter was demonstrated by Fukugita, Futamase, & Kasai (1990) and Turner (1990). The analysis by Falco, Kochanek, & Muñoz (1998) indicates that, in a cosmologically flat model, at . An open low density model does better: is at the contour.
This constraint from lensing depends on the galaxy mass function. The predicted peak of the lensing rate at angular separation arc sec is dominated by the high surface density branch of early-type galaxies at luminosities (where the galaxy mass function is approximated as , with ). The number density of these objects is not well known, because it is difficult to separate counts of early-type galaxies in the high surface density branch from a low density branch that is likely to be irrelevant for lensing (Kormendy 1987). Masataka Fukugita and I have been unable to find a reliable way around this ambiguity using available surveys.
If further tests of the lensing and redshift-magnitude constraints confirmed the apparent inconsistency in entries 1c and 1d the lesson could be that the cosmological constant is dynamical, rolling to zero, as Ratra & Quillen (1992) point out.
I keep a line in Table 2 for counts because galaxies are observed at redshifts greater than unity, where the predicted counts are quite sensitive to the cosmological parameters. The counts are quite sensitive to galaxy evolution, too, but people may learn how to deal with that as the understanding of galaxy evolution improves.
3.4 Fluctuations in the Distributions of Mass and the CBR
As noted in §§2.3 and 3.1, structure formation on the scale of galaxies and larger is thought to have been dominated by the gravitational growth of small departures from homogeneity present in the very early universe. The nature of the initial conditions is open because we do not have an established theory of what the universe was doing before it was expanding. We do have a consistency condition, that a single set of initial values must match many observational constraints. I discuss here second moments of the large-scale fluctuations in the distributions of galaxies and the thermal cosmic background radiation (the CBR).
It is sensible to try the simplest prescription for initial conditions first. Most widely discussed is the adiabatic cold dark matter (ACDM) model Joe Silk mentions in his introduction. In the simplest case the universe is Einstein-de Sitter and the density fluctuations are scale-invariant (the density contrast appearing on the Hubble length is independent of time). This case tends to underpredict large-scale density fluctuations; the problem is remedied by lowering or (Blumenthal, Dekel, & Primack 1988; Efstathiou, Sutherland, & Maddox 1990).111Lowering or lowers the expansion rate at the epoch of equality of mass densities in matter and radiation, and the larger expansion time when the universe is dominated by the pressure of the CBR increases the clustering length. The wanted value of is below most estimates of this parameter, so the more commonly accepted interpretation is that is less than unity. This leads to the grade in line 2a. It depends on the model for structure formation, of course.
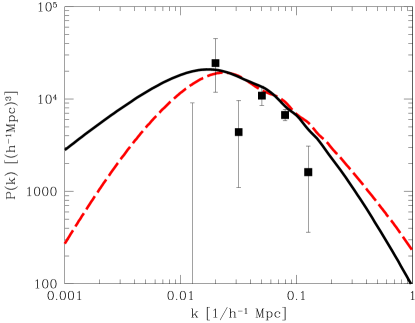
Examples of second moments of the galaxy space distribution and the angular distribution of the CBR are shown in Figures 2 and 3. The power spectrum of the space distribution is
| (13) |
where the dimensionless galaxy two-point correlation function is
| (14) |
for the smoothed galaxy number density . The data in Figure 2 are from the IRAS PSC-z (point source catalog) redshift survey (Saunders et al. 1998) of the far infrared-luminous galaxies mentioned in §3.1. Since infrared radiation is not strongly affected by dust this promises to be an excellent probe of the large-scale galaxy distribution.
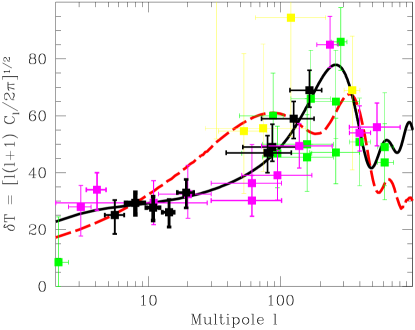
The expansion in spherical harmonics of the CBR temperature as a function of direction in the sky is
| (15) |
Figure 3 shows second moments of the expansion, defined as
| (16) |
In the approximation of the sum over as an integral the variance of the CBR temperature per logarithmic interval of is . The data in Figure 3 are from the survey of the measurements by Tegmark (1998a).
The solid curves in figures 2 and 3 are the prediction (Tegmark 1998a,b) of an ACDM model with a scale-invariant primeval mass fluctuation spectrum and the parameters
| (17) |
It is impressive to see how well this model fits the two sets of measurements. But at the present accuracy of the measurements there is at least one other viable model, shown as the dashed curves. It assumes the same dynamical actors as in ACDM—cold dark matter, baryons, the CBR, and three families of massless neutrinos—but the isocurvature initial condition is that the primeval mass density and the entropy per baryon are homogeneous, and homogeneity is broken by an inhomogeneous primeval distribution of the CDM. A simple model for the spectrum of primeval CDM fluctuations is . A rough fit to the measurements has parameters
| (18) |
Further details and a pedigree within the inflation picture are in Peebles (1999a, b). The solid curve fits the CBR anisotropy measurements better, but it is based on a much more careful search of parameters to fit the data. A bend in would do wonders for the dashed curve. Hu (1998) gives another example of how the prediction of the CBR angular fluction spectrum depends on the details of the structure formation model.
As mentioned in §2.3, the point of this discussion is that reading the values of the cosmological parameters from the CBR anisotropy measurements in Figure 3 is a dangerous operation because it depends on the theory for structure formation as well as the Friedmann-Lemaître model. This applies to other entries in category 2 in Table 2 (and to line 1a: a satisfactory quantitative understanding of galaxy formation would include an understanding of the relation between the distributions of galaxies and mass).
Our knowledge of and will be considerably improved by work in progress. Redshift surveys to probe and the large-scale mass distribution include the Century Survey, the Two Degree Field Survey (2dF), and the Sloan Digital Sky Survey (SDSS); precision measurements of the CBR include BOOMERANG, MAP, PLANCK, and other ground, balloon, and satellite projects (Geller et al. 1997; Page 1997; Nordberg & Smoot 1998; Eisenstein, Hu, & Tegmark 1998; and references therein). If one of the structure formation models now under discussion fits all the bumps and wiggles in the measured spectra it will inspire confidence.
In the Einstein-de Sitter case a scale-invariant ACDM model normalized by the assumption that galaxies trace mass gives quite a good fit to the CBR angular fluctuation spectrum ; on this score it would merit a pass in line 2b. But the assumptions that galaxies trace mass and that imply quite unacceptable peculiar velocites. The situation is different from line 1a, where the issue is whether can be saved by the postulate that galaxies do not trace mass. Thus I think it is fair to give the Einstein-de Sitter case separate demerits in lines 1a and 2b, but with a question mark for the latter because it depends on the model for structure formation.
Several authors have concluded that the low density flat ACDM model (with ) is a better fit to the measurements than is the low density open case (Gawiser & Silk, 1998; Tegmark 1998a). Others note that other treatments of the still quite new measurements can lead to the opposite conclusion (Górski et al. 1998; Ratra 1998). Since the former approach seems to treat the measurements in the more literal way the flat case gets the higher grade in line 2b.
3.5 The Evolution of Clusters of Galaxies
Bahcall and colleagues (Bahcall & Fan 1998 and references therein) have emphasized the importance of the time evolution of the number of clusters of galaxies as a probe of the cosmology. The condition that a CDM model fit the present cluster number density is (White, Efstathiou, & Frenk 1993; Bahcall & Fan 1998)
| (19) |
where is the rms contrast in the mass found within a randomly placed sphere of radius Mpc. Since the rms fluctuation of galaxy counts is close to unity on this scale, , equation (19) says galaxies trace mass if , while biasing has to be substantial if . I have already indicated why I am skeptical of the latter. More important, Bahcall & Fan (1998) demonstrate that with the Einstein-de Sitter parameters the ACDM model normalized to fit the present cluster number density quite underpredicts the abundance of clusters at .
This result assumes Gaussian initial density fluctuations. If the present mass fraction in clusters is small, so the normalization is to a steeply falling part of the Gaussian. The time evolution of the rms density fluctuation consequently causes a large evolution in the predicted number of clusters. The Gaussian case is simple and natural to consider first, and it follows from simple models for inflation, but there are other possibilities. In the ICDM model (§3.4) the CDM could be a massive field squeezed from its ground level during inflation, in which cases the primeval CDM mass distribution is , where is a random Gaussian process with zero mean. In this model the mass fluctuation distribution is much less steep than a Gaussian, the cluster abundance accordingly is a less sensitive function of the rms mass fluctuation, and the Einstein-de Sitter model predicts acceptable evolution of the cluster mass function (Peebles 1999b). It is not clear whether the constraint from the skewness of the galaxy count distribution (Gaztañaga & Fosalba 1998) allows the primeval mass fluctuations to be non-Gaussian enough for acceptable cluster evolution in the Einstein-de Sitter case.
The evolution of structure is a key probe of cosmology, and Bahcall and colleagues have demonstrated that the rich clusters of galaxies offer a particularly sensitive measure. But I am inclined to keep the question marks on the grades in line 2c until we can be more sure of the nature of the initial conditions for structure formation.
3.6 Cluster Baryon and Dark Matter Masses
This important probe was pioneered by White et al. (1993). In the survey by White & Fabian (1995) the ratio of the mass in X-ray emitting gas to the gravitational mass in rich clusters of galaxies is
| (20) |
Myers et al. (1997) find from the measurement of the Sunyaev-Zeldovich effect in three clusters
| (21) |
In their contributions to this discussion Silk and Turner explain why the consensus value of the density parameter in baryons to account for light element abundances is . If clusters are fair samples of baryon and total masses then is the same as . If most of the cluster baryons are in the plasma we get from these mass ratios and . The correction for baryons in stars decreases . Energy injected by winds from supernovae in cluster galaxies would tend to lower the plasma mass; a correction for this effect would further lower (Metzler & Evrard 1998). At this measure of is well below Einstein-de Sitter.
On the other hand, if baryons settled to cluster centers, increasing the local ratio of baryon to total mass, it would bias this measure of low. It is not hard to make up a story for how this might have happened. Imagine that before there were clusters there were gas clouds dense enough that the baryons dissipatively settled, leaving dark matter halos. We have to postulate the clouds were small enough that the radiation from this dissipative settling is not objectionably hard, and we have to postulate that feedback from star formation prevented catastrophic collapse of the baryons. Now imagine many of these systems fall together to form a proto-cluster. Numerical N-body simulations of merging show that the dense parts of the substructure tend to settle relative to less dense parts, producing the wanted segregation of baryons from the dark matter. Numerical simulations of cluster formation fail to show any evidence of this story; I do not know whether that is because it is only a story or possibly because it is hard to explore all scenarios in numerical simulations.
One does hears mention of the possibility of an inhomogeneous primeval entropy per baryon, but with little enthusiasm.
As indicated in line 2d this constraint on so far has proved difficult to finesse.
3.7 Pure Thought
There are three issues to consider: coincidences, inflation, and our taste as to how the world might best end.
If we flourish at a special epoch, just as the universe is making the transition from matter-dominated to - or curvature-dominated expansion within the Friedmann-Lemaître model. Maybe this is pure chance. Maybe it is an effect of selection: perhaps galaxies as homes for observers would not have existed if were very different from unity (Martel, Shapiro & Weinberg 1998 and references therein). Maybe there is no coincidence: perhaps really is close to unity. Most of us consider the last the most reasonable possibility. But the observational entries in Table 2 show that if then Nature has presented us with a considerable set of consistently misleading clues. The much more likely reading of the evidence is that, within the Friedmann-Lemaître model, . We should pay attention to arguments from aesthetics; the history of physical science has many examples of the success of ideas driven by logic and elegance. But there are lots of examples of surprises, too. The evidence that is significantly less than unity is a surprise. I enter it as a demerit for the Friedmann-Lemaître model, but not a serious one: surprises happen.
The conventional inflation picture accounts for the near homogeneity of the observable universe by the postulate that an epoch of near exponential expansion driven by a large effective cosmological constant stretched all length scales in the primeval chaos to unobservably large values, making the universe we can see close to uniform. The same process would have made the radius of curvature of space very large. Thus in their book, The Early Universe, Kolb & Turner (1988) emphasize that a sensible inflation theory requires negligibly small space curvature: may be less than unity, but if it is a cosmological constant makes equal to unity. The argument is sensible but model-dependent. Gott (1982) pioneered a variant of inflation that produces a near homogeneous Friedmann-Lemaître model with open space sections. Ratra & Peebles (1994) revived the concept; details of the history and application are in Górski et al. (1998). Most proponents of inflation I have talked to share the preference for but agree that they could learn to live with the open version if that is what the observations required. The flat low density case does get the higher grades in Table 2, from the - relation and the CBR anisotropy, but my impression is that both results are too preliminary to support a decision on open versus flat space sections.
The values of the cosmological parameters tell us how the world ends according to the Friedmann-Lemaître model, whether it is collapse back to a Big Crunch or expansion into the indefinitely remote future. But why should we pay attention to an extrapolation into the remote future of a theory we can be pretty sure is at best only an approximation to reality? For example, suppose improved tests showed that , that the dimensionless measure of Einstein’s cosmological constant is quite small, , and that space curvature correspondingly is negative. The straightforward interpretation would be that our universe is going to expand forever more, but it need not follow. If were constant and less than zero, then no matter how small the Friedmann-Lemaître model would predict that the expansion will eventually stop and the universe will contract back to a Big Crunch.222The example is contrived but not entirely frivolous. Standard and successful particle theory includes a cosmological constant, in the form of the energy density of the vacuum, but quite fails to explain why its value is in the observationally acceptable range. Until we have a deeper theory that deals with this I don’t see how we can exclude the idea that it has or ends up with an exceedingly small negative value. This may be of some comfort if the Big Crunch is more to your taste. To my taste the main lesson is that we should stop all this talk about how the world ends until we can think of some scientific meaning to attach to the answer.
4 Concluding Remarks
It is impressive to see how well the Friedmann-Lemaître model fits the full range of observations summarized in Table 2. We have to to bear in mind that many of the measurements still are open to discussion, however, and that the entries in category 2 depend on a model for structure formation that also has to be tested. Thus there is a large number of question marks (even though I believe I have been an easy grader). Perhaps the best lesson one might draw from the length of the discussion of Table 2 in §3 is that we theorists ought to resist the temptation to draw large conclusions from the latest observational reports; these are extraordinarily difficult measurements that we best praise by respectful cautious consideration.
I think we should also bear in mind that substantial parts of the left-hand column of Table 1 were formulated a full seven decades ago, and that much of the rest was driven by observational advances. That is, although we have many elegant new theoretical ideas in cosmology, we have little evidence in hand on which Nature has chosen.
The right-hand column of Table 1, that represents the observational constraints, is considerably longer than it would have been in a list made ten years ago, and ten years ago there would have been a lot more question marks in Table 2. We can be sure work in progress will produce a considerably tighter network of cosmological tests ten years from now. I see no reason to think the results will fail to support the Friedmann-Lemaître model, but that will be revealed in the fullness of time and a lot of hard work.
Acknowledgements.
I am grateful to David Hogg, Wayne Hu, and Max Tegmark for stimulating discussions. This work was supported in part at the Princeton Institute for Advanced Study by the Alfred P. Sloan Foundation.References
- [1]
- [2] Bahcall, N. A. & Fan, X. 1998, ApJ 504, 1.
- [3]
- [4] Baum, W. A. 1998, AJ 116, 31.
- [5]
- [6] Blumenthal, G. R., Dekel, A., & Primack, J. R. 1988, ApJ 326, 539.
- [7]
- [8] Carlberg, R. G et al. 1996, ApJ 462, 32.
- [9]
- [10] Chaboyer, B., Demarque, P., Kernan, P. J., & Krauss, L. M. 1998, ApJ 494, 96.
- [11]
- [12] de Blok, W. J. G. & McGaugh, S. S. 1998 (astro-ph/9805120).
- [13]
- [14] de Sitter, W. 1931, Nature 127, 708.
- [15]
- [16] de Vaucouleurs, G. 1956, in Vistas in Astronomy II, ed. A. Beer (New York: Pergammon) 1584.
- [17]
- [18] Efstathiou, G., Sutherland, W. J., & Maddox, S. J. 1990, Nature 348, 705.
- [19]
- [20] Eisenstein, D. J., Hu, W., & Tegmark, M. 1998 (astro-ph/9807130).
- [21]
- [22] Faber, S. M. & Burstein, D. 1988, in Large-Scale Motions in the Universe, eds. V. C. Rubin & G. V. Coyne (Princeton: Princeton University Press).
- [23]
- [24] Falco, E. E., Kochanek, C. S., & Muñoz, J. A. 1998, ApJ 494, 47.
- [25]
- [26] Freedman, W. L., Mould, J. R., Kennicutt, R. C. Jr., & Madore, B. F. 1998, in IAU Symposium 183, Kyoto, August 1997 (astro-ph/9801080).
- [27]
- [28] Fukugita, M., Futamase, T., & Kasai, M. 1990, MNRAS 246, 24p.
- [29]
- [30] Fukugita, M., Hogan, C. J., & Peebles, P. J. E. 1998, ApJ 503, 518.
- [31]
- [32] Gawiser, E. & Silk, J. 1998, Science 280, 1405.
- [33]
- [34] Gaztañaga, E. & Fosalba, P. 1998, MNRAS 295, 35.
- [35]
- [36] Geller, M. J., Kurtz, M. J., Wegner, G., Thorstensen, J. R., Fabricant, D. G., Marzke, R. O. Huchra, J. P., Schild, R. E., & Falco, E. E. 1997, AJ 114, 2205.
- [37]
- [38] Górski, K. M., Ratra, B., Stompor, R., Sugiyama, N., & Banday, A. J. 1998, ApJS 114, 1.
- [39]
- [40] Gott, J. R. 1982, Nature 295, 304.
- [41]
- [42] Hu, W. 1998 (astro-ph/9809142).
- [43]
- [44] Keeton, C. R. & Kochanek, C. S. 1997, ApJ 487, 42.
- [45]
- [46] Kolb, E. W. & Turner, M. S. 1988, The Early Universe (Redwood City: Addison-Wesley).
- [47]
- [48] Kormendy, J. 1987, in Nearly Normal Galaxies: From the Planck Time to the Present, ed. S. Faber (Berlin: Springer) 163.
- [49]
- [50] Madore, B. F. et al. 1998, Nature 395, 47.
- [51]
- [52] Martel, H., Shapiro, P. R., & Weinberg, S. 1998, ApJ 492, 29.
- [53]
- [54] Marzke, R. O., Geller, M. J., da Costa, L. N., & Huchra, J. P. 1995, AJ 110, 477.
- [55]
- [56] Metzler, C. A. & Evrard, A. E. 1998 (astro-ph/9710324).
- [57]
- [58] Milgrom, M. 1995, ApJ 455, 439.
- [59]
- [60] Myers, S. T., Baker, J. E., Readhead, A. C. S., Leitch, E. M., & Herbig, T. 1997, ApJ 485, 1.
- [61]
- [62] Nordberg, H. P. & Smoot, G. F. 1998 (astro-ph/9805123).
- [63]
- [64] Page, L. 1997, in Critical Dialogues in Cosmology, ed. N. Turok (Singapore: World Scientific) 343.
- [65]
- [66] Peebles, P. J. E. 1996, ApJ 473, 42.
- [67]
- [68] Peebles, P. J. E. 1999a, ApJ in press (astro-ph/9805194).
- [69]
- [70] Peebles, P. J. E. 1999b, ApJ in press (astro-ph/9805194).
- [71]
- [72] Perlmutter, S., et al. 1998a, Nature 391, 51.
- [73]
- [74] Perlmutter, S., et al. 1998b, LBNL-41801 preprint.
- [75]
- [76] Pettini, M., Kellogg, M., Steidel, C. C., Dickinson, M., Adelberger, K. L. & Giavalisco. M. 1998, ApJ in press (astro-ph/9806219).
- [77]
- [78] Pont, F., Mayor, M., Turon, C., & VandenBerg, D. A., 1998, Astron. Ap. 329, 87.
- [79]
- [80] Ratra, B. 1998, private communication.
- [81]
- [82] Ratra, B. & Peebles, P. J. E. 1994, ApJ 432, L5.
- [83]
- [84] Ratra, B. & Quillen, A. 1992, MNRAS 259, 738.
- [85]
- [86] Reiss, A. G. et al. 1998, AJ 115 (astro-ph/9805201).
- [87]
- [88] Santiago, B. X. et al. 1996, ApJ 461, 38.
- [89]
- [90] Saunders, W., et al. 1998, in Extragalactic Astronomy in the Infrared, eds. G. A. Mamon, Trinh Xuan Thuan, & J. Tran Thanh Van (Gif-sur-Yvette: Editions Frontieres).
- [91]
- [92] Strauss, M. A. 1998, private communication.
- [93]
- [94] Strauss, M. A., Davis, M., Yahil, A., & Huchra, J. P. 1992, ApJ 385, 421.
- [95]
- [96] Tegmark, M. 1998a (astro-ph/9809201).
- [97]
- [98] Tegmark, M. 1998b, private communication.
- [99]
- [100] Tegmark, N. & Peebles, P. J. E. 1998, ApJ 500, L79.
- [101]
- [102] Tonry, J. L. et al. 1998, private communication.
- [103]
- [104] Turner, E. L. 1990, ApJ 365, L43.
- [105]
- [106] White, D. & Fabian, A. C. 1995, MNRAS 273, 72.
- [107]
- [108] White, S. D. M., Efstathiou, G., & Frenk, C. S. 1993, MNRAS 262, 1023.
- [109]
- [110] White, S. D. M., Navarro, J. F., Evrard, A. E. & Frenk, C. S. 1993, Nature 366, 429.
- [111]
![[Uncaptioned image]](/html/astro-ph/9810497/assets/x1.png)
![[Uncaptioned image]](/html/astro-ph/9810497/assets/x2.png)