Abstract
A technique for detecting the presence of cloud in the field of view of an atmospheric Čerenkov telescope using a far infra red radiometer is described. Models for the radiative emission from clear and cloudy skies are tested and found to represent the measurements.
Key words: gamma ray astronomy, gamma ray telescopes, atmospheric Čerenkov technique, cloud detection
Section 1 Introduction
Measurement of atmospheric Čerenkov radiation is an important technique finding increasing application in high energy astrophysics [Fegan (1997)]. Observations are customarily made under conditions of cloudless and moonless dark skies. A long standing problem has been the need to monitor the clarity of the atmosphere — the radiating medium of the Čerenkov light production and detection system. A number of possibilities exist; recent suggestions, triggered by plans for future large air shower recorders, employ active systems involving laser probing of the atmosphere and measurements of the scattered light [Abu-Zayyad et al. (1997)] or the monitoring of a complete hemisphere using a matrix of fixed far infra red (FIR) radiometers [Bird et al. (1997)]. Alternatively, monitoring of the brightness of a star in the field of a gamma ray telescope is a passive method already employed for ground based gamma ray astronomy [Armstrong et al. (1998)]. However, this method has not found general application because measurements of faint stars using inexpensive CCD detectors tend to be noisy giving an imprecise estimate of atmospheric clarity. Often the performance of the gamma ray telescope when measuring the Čerenkov radiation produced by the cosmic ray background is used as a monitor of the transparency of the atmosphere. This has the disadvantage of depending on the performance of the Čerenkov detector itself.
We report here a technique involving measuring the radiative temperature of the night sky and sensing the presence of cloud and other obscurants against the cold clear sky. The method is quick, sensitive and independent of the performance of the atmospheric Čerenkov detector.
We present a range of observational radiometric data for the temperature of clear and cloudy skies and describe these data using two simple models for the temperature of clear sky and of clouds at various heights.
Section 2 Experimental Equipment
Measurements of the sky temperature have been made with FIR radiometers (Heimann model KT 17 and KT 19) sensitive in the 8 – 14 m waveband which coincides with an atmospheric window. The radiometers have a temperature range C – C, a temperatue resolution of C, and an aperture of defined by a germanium lens. The radiometers were calibrated including allowance for the effects of the instrument temperature on the performance of the radiometer (C change in indicated temperature for a C change in the temperature of the instument).
Measurements were made with radiometers mounted on the Mark 6 gamma ray telescope [Armstrong et al. (1998)] in Narrabri, NSW, Australia and on steerable alt-azimuth platforms and on fixed mounts in Durham, England. Data from the measurements made at various angles to the zenith, throughout the day and night during different seasons over a period of years are available. Cloud base measurements were made in 1998 using a LIDAR ceilometer for a subset of the data. Full meteorological data are available for all observations.
Section 3 Results
3.1 Correlation between telescope background count rate and sky radiation temperature
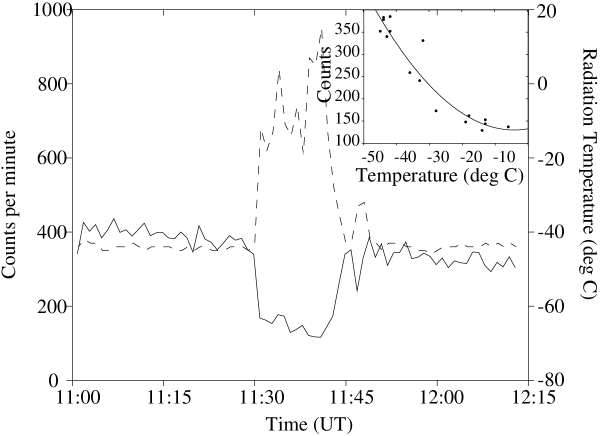
The performance of a gamma ray telescope and the stability of the atmosphere has often been monitored on the basis of the background cosmic ray count rate of the telescope. This method has a number of disadvantages. It depends upon the integrity of the telescope performance and it is governed by the statistics of counting (at rates with current telescopes up to 1000 cpm). We show in Figure 1 the correlation between the background count rate of the telescope and the radiative temperature of the sky during an observation using the Mark 6 telescope at Narrabri. The sky temperature is seen to be very sensitive to the presence of the warmer clouds and correlates with the background count rate of the telescope. The presence of clouds caused a decrease in telescope count rate and an increase in sky temperature. It thus presents an instantaneous, sensitive and independent monitor of the clarity of the sky in the beam of the gamma ray telescope.
3.2 Zenith angle dependence of temperature of a clear sky
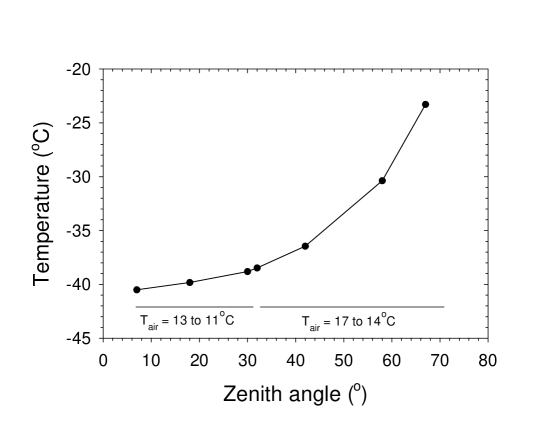
We show in Figure 2 the measured temperature of a clear sky using the Narrabri radiometer as a function of zenith angle of observation in the range . The plot is based on data from observations during two nights when there was a small difference in air temperature, which is noted. The radiative temperature of the clear sky increases as the zenith angle is increased and the measurement is made through an increasing slant thickness of warm lower atmosphere. The data of the figure also show that the temperature of the clear sky from night to night is reproducible.
3.3 Diurnal variation of temperature of a clear sky
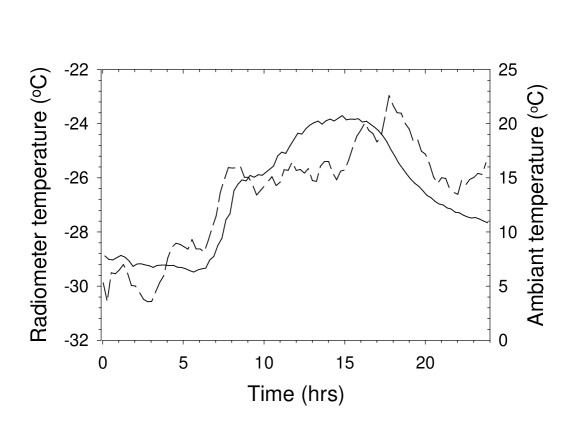
The profile of the sky temperature (measured at the zenith near Durham, England) during a typical 24 hour period during which the sky was clear is shown in Figure 3. The air temperature at screen height is also plotted and it is noted that the vertical clear sky temperature tracks the air temperature at screen height. Such data taken over a long period are the basis for a simple phenomenological model linking the observed sky radiometric temperature with the air temperature and humidity at screen height — see Section 4.
3.4 Annual variation of temperature of a clear sky
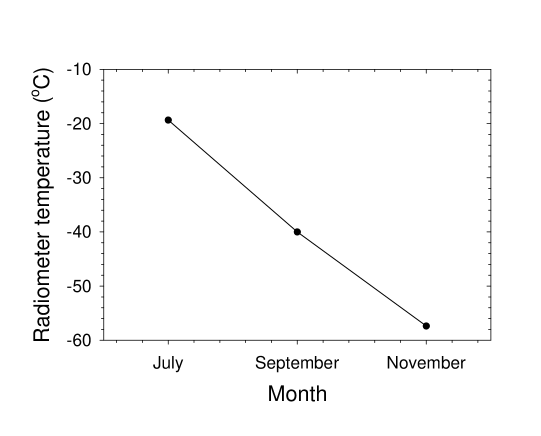
The temperature of a clear sky measured at the zenith at 1400 UTC near Durham, England averaged over a four week period during July, September and November is shown in Figure 4. A systematic reduction in the sky temperature occurs during the transition from summer to winter illustrating the annual variation.
3.5 Temperature of clouds
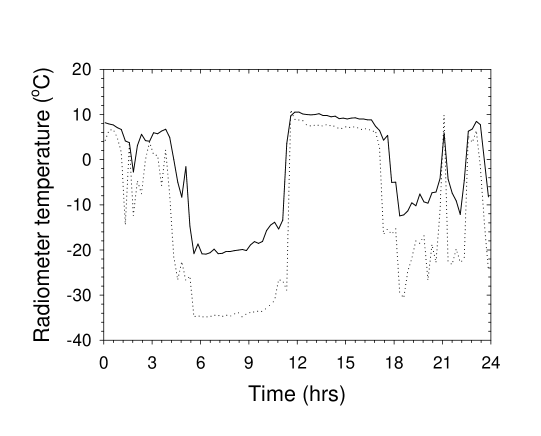
Figure 5 shows measurements of the sky temperature at the zenith and to the zenith during a 24 hour period when clear skies were replaced by total overcast clouds with a base at 600 m at about 1200 UTC. The temperature of the clear sky is seen to be about C cooler than than that of the low overcast cloud which is very similar to the ground level air temperature.
3.6 Variation of radiometric temperature of clouds with height
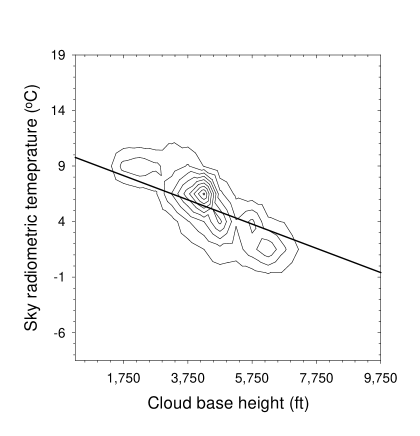
The temperatures of clouds with bases at different heights were measured at the zenith using a radiometer boresighted with a LIDAR ceilometer — see Figure 6. The radiometer has an aperture of about and on occasion a part of the cold clear sky is viewed when the cloud base indicated by the narrow angle LIDAR is low. This is the origin of some spread of the data in Figure 6. An increase in cloud base height from 1000 to 7000 ft corresponds to a decrease in measured cloud temperature from C to C.
Section 4 A Model for the Temperature of Clear Skies
4.1 A simple empirical model
The data of Figure 7 show the relation between the radiometric temperature of a clear sky and the air temperature at screen height for measurements near Durham, England. They suggest that the major factor governing the clear sky temperature is the temperature of the air at the observation level. This is representative of the temperature of the atmosphere through which the measurement is made.
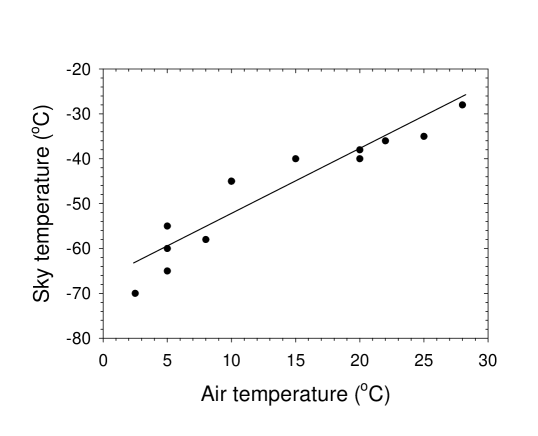
An approximate representation of the sky radiative temperature is given by
| (1) |
where is the sky radiative temperature (in ∘C) and is the air temperature at screen height (in ∘C).
4.2 The model of Idso (1981)
A number of models for the emission of long wave radiation from clears skies have been developed, normally for use with the modelling of meteorological conditions and in energy-balance models (see e.g. ?, ?). Because of this principle application, the majority of these models predict the longwave radiation integrated over a complete hemisphere and not from a small area of the sky. A recent example of this type of model is that due to ? (?).
? (?) described a model which can be used to predict the radiation from a small area of clear sky. The model incorporates both the effects of air temperature and vapour pressure at ground level in the prediction of sky temperatures.
? showed that the full spectrum radiated by a clear sky, , may be represented by
| (2) |
where is the full spectrum clear sky emittance, is the screen level air temperature in K and is the Stefan-Boltzmann constant.
An equation for , appropriate to the 8 – 14 m wave band at the zenith, was given by ? as
| (3) |
where is the screen level (ground level) vapour pressure and can be calculated using an equation given by ? (?).
4.3 Validation of the Idso model
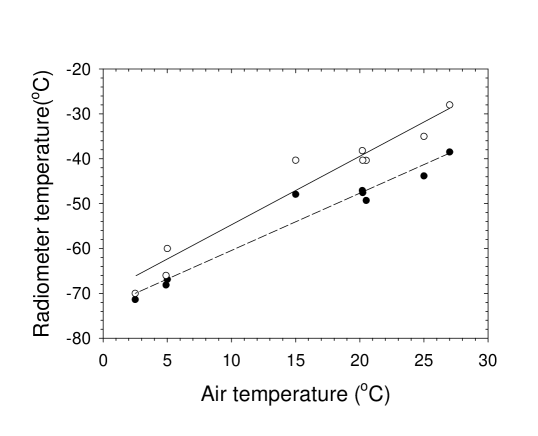
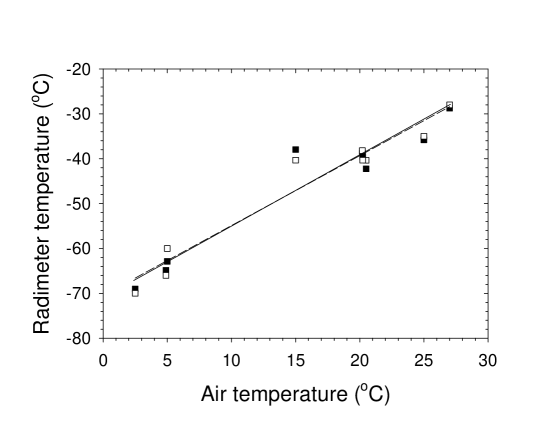
Data were selected from observations on clear days and the vapour pressure and air temperatures measured on these days were employed as input to the model to calculate the radiometer sky temperature. The predicted sky temperature was compared with the measured values. Figure 8 shows the measured sky temperatures and the predictions of the model for varying air temperatures at screen height (the variation in vapour pressures were also allowed for). The predicted and observed variation of temperature can each be fitted by a straight line. It can be seen that the predicted and observed temperatures represented by the straight lines differ by C at low air temperatures and C at high air temperatures.
This simple model therefore provides a reasonable representation of temperature of the clear sky. Explanations may exist for the differences noted. For example, it is possible that the constants of the model should be adjusted to take account of the difference in climate in the northeast of England (where our measurements were made) and in Arizona (where the original data used to validate the Idso model were recorded). A small adjustment has been made to equation 3 specifying the 8 – 14 m clear sky emissivity () which reduces the values by and reconciles the predictions of the model and our measurements. The original formulation by Idso has been modified to
| (4) |
This is the form of the equation appropriate for skies observed under climatic conditions found in northeastern England. Figure 9 shows the comparison of the predictions from this modified model and experimental measurements; the fitted lines are indistinguishable.
Section 5 A Model for the Temperature of Clouds
If clouds are present in the sky, they produce an additional contribution to the thermal radiation detected at ground level. For a cloudy sky, therefore, the measured sky radiative temperature is increased. As is the case for clear skies, much of the discussion in the literature has been of models for the prediction of the thermal emission from a complete hemisphere for use in meteorological models (e.g. ?, ?; ?, ?). However ? (?) have developed a model that can be used to predict the cloud temperature at a specified zenith angle.
5.1 The model of Kimball et al. (1982)
This model for the emission from a cloudy sky is based on the clear sky model of ? (?) but with an additional term to include radiation effects of the cloud. In this model the contribution to the thermal radiation from clouds, , is
| (5) |
where is the cloud emittance (a value dependant on cloud type in the range 0.5 to 1.0), is the fraction of black body radiation emitted in the 8 – 14 m band, (taken as 1.0 in this work), is the fraction of sky covered with cloud, is the Stephan-Boltzmann constant and is the transmittance of the atmosphere in the 8 – 14 m window where
| (6) |
and is the 8 – 14 m sky emittance [Idso (1981)] — see equation 3.
is the cloud temperature, which is calculated assuming the standard temperature lapse rate (see e.g. ?, ?). According to this the equation for the temperature of the cloud is
| (7) |
where is the air temperature at screen height in K and is the height of the cloud in meters.
The total predicted sky thermal radiation, , received at the earth’s surface from the cloudy sky is then
| (8) |
where is the clear sky radiation — see equation 2.
5.2 Validation of the model
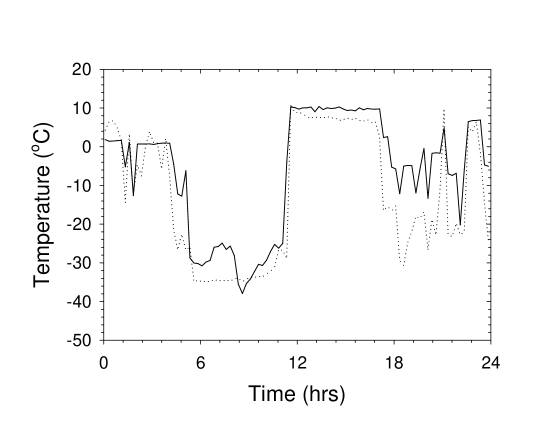
The cloud model developed by ? (?) was used to predict radiometer temperatures for cloudy skies which may be compared with observations. Figure 10 shows a comparison between the predictions of the model and observations on a day which included changes in cloud cover. The data were taken in August in northeast England. The best fit of the model predictions and observations (which is shown) was when the cloud emissivity was taken to be 0.8 (a reasonable mid-range value).
Comparison of the predictions of the ? model with the measurements of temperature for clouds at different heights are shown in Figure 6. There is good agreement between the solid line representing the predictions and the contours repesenting the data when a value of 0.8 is used for the cloud emissivity.
Section 6 Summary
The use of a FIR radiometer sensitive to the 8 – 14 m waveband mounted on a ground based gamma ray telescope provides a simple and inexpensive method of reliably monitoring the atmospheric clarity in the telescope’s field of view. The response of the radiometer is prompt and is independent of the performance of the telescope itself.
The predictions of simple semi-empirical models of the longwave emission from clear skies [Idso (1981)] and cloudy skies [Kimball et al. (1982)] have been compared with our measurements. They provide theoretical underpinning for the observed variation of radiative temperature of the sky and clouds with the air temperature and relative humidity at screen height.
Acknowledgements
We are grateful to the UK Particle Physics and Astronomy Research Council for support of the gamma ray project and Muir Matheson Limited for the loan of the LIDAR system. Many members of the Gamma Ray Astronomy Group in the Department of Physics contributed to the collection of data in Australia. Observations made in Northeast England were part of a program conducted by the Industrial Research Laboratories, University of Durham on behalf of the Science and Technology Division, Defence Clothing and Textiles Agency. These data are reproduced with the permission of the Director, Science and Technology Division, Defence Clothing and Textiles Agency.
References
- Abu-Zayyad et al. (1997) Abu-Zayyad, T., Al-Seady, M., Belov, K., Bird, D. J., Boyer, J., Chen, G., Clay, R. W., Dai, H. Y., Dawson, B. R., Ho, Y., Huang, A., Jui, C. C. H., Kidd, M., Kieda, D. B., Knapp, B., Lee, W., Loh, E. C., Mannel, E. J., Matthews, J. N., O’Halloran, T., Salman, A., Simpson, K. M., Smith, J. D., Sokolsky, P., Sommers, P., Taylor, S., Thomas, S.B., Wiencke, L. R., and Wilkinson, C. R.: 1997 Proc. 25th Int. Cosmic Ray Conf., Durban, 5, 345–348.
- Alados-Arboledas et al. (1995) Alados-Arboledas, L., Vida, J. and Olmo, F. J.: 1995, Int. J. Climatology, 15, 107–116.
- Armstrong et al. (1998) Armstrong, P., Chadwick, P. M., Cottle, P. J., Dickinson, J. E., Dickinson, M. R., Dipper, N. A., Hilton, S. E., Hogg, W., Holder, J., Kendall, T. R., McComb, T. J. L., Moore, C. M., Orford, K. J., Rayner, S. M., Roberts, I. D., Roberts, M. D., Robertshaw, M., Shaw, S. E., Tindale, K., Tummey, S. P. and Turver, K. E.: 1998, Exp. Astron., in the press.
- Ashley and Jurcevic (1991) Ashley, M. C. B. and Jurcevic, J. S.: 1991, Proc. Astron. Soc. Australia, 9, 334–335.
- Bird et al. (1997) Bird, D. J., Clay, R. W., Dawson, B. R., Gregory, A. G., Smith, A. G. K., Johnston, M. and Wild, N. R.: 1997, Proc. 25th Int. Cosmic Ray Conf., Durban, 5, 353–356.
- Fegan (1997) Fegan, D. J.: 1997, J. Phys. G.: Nucl. Part. Phys., 23, 1013–1060.
- Idso (1981) Idso, S. B.: 1981, Water Resour. Res., 17, 295–304.
- Kimball et al. (1982) Kimball, B. A., Idso, S. B. and Aase, J. K.: 1982, Water Resour. Res., 18, 931–936.
- Lutgens and Tarbuck (1998) Lutgens, F. K. and Tarbuck, E. J.: 1998 The Atmosphere, (Prentice Hall, New York), 15.
- Malek (1997) Malek, E.: 1997, Atmos. Res., 45, 41–54.
- Monteith and Unsworth (1990) Monteith, J. L. and Unsworth, M. H.: 1990, Principles of Environmental Physics, 2nd. ed., (Edward Arnold, London).
- Prata (1996) Prata, A. J.: 1996, Q. J. R. Meteorol. Soc., 122, 1127–1151.
- Wiesner (1970) Wiesner, C. J.: 1970, Hydrometeorology, (Chapman and Hall, London), 43.