Hard X-ray variability of the black-hole candidate GRO J042232 during its 1992 outburst
Abstract
We have studied the hard X-ray variability of the soft X-ray transient GRO J042232 with BATSE in the 20–100 keV energy band. Our analysis covers 180 days following the first X-ray detection of the source on 1992 August 5, fully covering its primary and secondary X-ray outburst. We computed power density spectra (PDSs) in the 20–50, 50–100, and 20–100 keV energy bands, in the frequency interval 0.002–0.488 Hz. The PDSs of GRO J042232 are approximately flat up to a break frequency, and decay as a power law above, with index 1. During the first 70 days of the X-ray outburst, the PDSs of GRO J042232 show a significant QPO peak near 0.2 Hz, superposed on the power-law tail.
The break frequency of the PDSs obtained during the primary X-ray outburst of GRO J042232 occurs at 0.0410.006 Hz; during the secondary outburst the break is at 0.0810.015 Hz. The power density at the break ranged between 44 and 89% Hz-1/2 (20–100 keV). The canonical anticorrelation between the break frequency and the power density at the break, observed in Cyg X-1 and other BHCs in the low state, is not observed in the PDSs of GRO J042232.
We compare our results with those of similar variability studies of Cyg X-1. The relation between the spectral slope and the amplitude of the X-ray variations of GRO J042232 is similar to that of Cyg X-1; however, the relation between the hard X-ray flux and the amplitude of its variation is opposite to what has been found in Cyg X-1. Phase lags between the X-ray flux variations of GRO J042232 at high and low photon energies, could only be derived during the first 30 days of its outburst. During this period, the variations in the 50–100 keV, lag those in the 20–50 keV energy band by an approximately constant phase difference of 0.039(3) rad in the frequency interval 0.02–0.20 Hz. The time lags of GRO J042232 during the first 30 days of the outburst, decrease with frequency as a power law, with index 0.9 for 0.01 Hz.
1 Introduction
Soft X-ray transients (SXTs) are low-mass X-ray binaries consisting of a neutron star or black-hole primary that undergoes unstable accretion from a late-type companion. Disk instabilities (van Paradijs 1996; King, Kolb & Burderi 1996) cause brief but violent outbursts, typically lasting weeks to months, during which the X-ray luminosity abruptly increases by several orders of magnitude, to –5 erg sec-1, separated by quiescent intervals lasting from years to many decades.
The SXT GRO J042232 (Nova Persei 1992) was detected with the Burst And Transient Source Experiment (BATSE) on board the Compton Gamma Ray Observatory on 1992 August 5 (Paciesas et al. 1992). Initially, the hard X-ray flux of the source increased rapidly, reaching a maximum of 3 Crab (20–300 keV) within three days after first detection (Paciesas et al. 1992), at which level it remained for the following three days (Harmon et al. 1992). Subsequently, the hard X-ray intensity (40–150 keV) of GRO J042232 decreased exponentially with a decay time of 43.6 days (Vikhlinin et al. 1995). About 135 days after the primary X-ray maximum, the X-ray flux of GRO J042232 reached a secondary maximum, after which the flux continued to decrease with approximately the same decay time as before. The source was detected above the BATSE 3 one-day detection treshold of 0.1 Crab (20–300 keV) for 200 days following the start of the X-ray outburst. The daily averaged 40–150 keV flux history of GRO J042232 during this period is displayed in Figure 1.
The X-ray spectrum of GRO J042232 was hard and could be well described by a cut-off power law with photon index 1.5 and break energy 60 keV, detected up to 600 keV with OSSE (Grove, Kroeger & Strickman 1997). In observations of GRO J042232 during X-ray maximum with COMPTEL, the source was detected up to 1–2 MeV (van Dijk et al. 1995). Timing analysis of the hard X-ray data revealed quasi-periodic oscillations (QPOs) centered at 0.03 and 0.2 Hz (20–300 keV BATSE data, Kouveliotou et al. 1992, 1993) and 0.3 Hz (40–150 keV SIGMA data, Vikhlinin et al. 1995). These QPOs detected in hard X-rays were confirmed by ROSAT observations in the 0.1–2.4 keV energy band (Pietsch et al. 1993). The power density spectra (PDSs) of GRO J042232 were flat for frequencies, f, below the first QPO peak at 0.03 Hz, and fall as 1/f between both QPOs (Kouveliotou et al. 1992). The total fractional rms variations of the 40–150 keV flux in the 10-3–10-1 Hz frequency interval, ranged between 15% and 25% (Vikhlinin et al. 1995). The observed hard X-ray spectrum and rapid X-ray variability resemble the properties of dynamically proven black-hole candidates (BHCs) (Sunyaev et al. 1991; Tanaka & Lewin 1995; see however, van Paradijs & van der Klis 1994), which led to the suggestion that GRO J042232 is also a BHC (Roques et al. 1994).
Soon after its first X-ray detection, the optical counterpart of GRO J042232 was independently identified by Castro-Tirado et al. (1992, 1993) and Wagner et al. (1992) at a peak magnitude of V 13.2. This object was absent on the POSS down to a limiting magnitude of R 20 (Castro-Tirado et al. 1993). During the first 210 days of the X-ray outburst the optical light curve declined exponentially with an e–folding time of 170 days (Shrader et al. 1994). Then the optical brightness dropped quickly, followed by two mini-outbursts (with an amplitude of 4 mag each) before it finally reached quiescence at V 22.35, 800 days after first detection of the X-ray source (Garcia et al. 1996). Therefore, the outburst amplitude of GRO J042232 was about 9 mag in V, the largest observed in any SXT to date (van Paradijs & McClintock 1995). The optical light curve of GRO J042232, during and after the X-ray outburst, bears many characteristics similar to those of the so-called “tremendous outburst amplitude dwarf novae” (TOADs). Kuulkers, Howell & van Paradijs (1996) proposed that these similarities reflect the small mass ratios and very low mass transfer rates in SXTs and TOADs.
During the decay to quiescence, optical brightness modulations were reported at periods of 2.1, 5.1, 10.2, and 16.2 hrs, respectively (Harlaftis et al. 1994; Callanan et al. 1995; Kato, Mineshige & Hirata 1995; Chevalier & Ilovaisky 1995; Martin et al. 1995). Spectroscopic observations by Filippenko, Matheson & Ho (1995) showed that the orbital period is 5.080.01 hrs, and determined the mass function at f (M) 1.210.06 M⊙. This value of the mass function is confirmed by observations performed by Orosz & Bailyn (1995), f (M) 0.40–1.40 M⊙, and Casares et al. (1995), f (M) 0.850.30 M⊙. The orbital inclination, , of GRO J042232 was estimated from an interpretation of the double waved light curve as an ellipsoidal variation. From the I 0.03 mag semi-amplitude modulation Callanan et al. (1996) derived 45∘. This implies a mass of 3.4 M⊙ for the compact star, i.e. slightly above the (theoretical) maximum mass of a neutron star. Independently, Beekman et al. (1997) constrain the inclination of GRO J042232 from infrared and optical photometry to be between 10∘ and 31∘. Consequently, their lower limit to the mass of the compact star becomes 9 M⊙. Therefore, the compact star in GRO J042232 is most probably a black hole.
Here we report on a temporal analysis of 20–100 keV BATSE data of GRO J042232 collected during 180 days following its first detection. We derive the X-ray light curve of the source and discuss its hard X-ray spectrum. We compute daily averaged power density spectra in the frequency interval 0.002–0.488 Hz and show their evolution in time. From the Fourier amplitudes we compute cross spectra and derive the phase and time lags between the hard and soft X-ray variations of GRO J042232. We compare our results with those of similar analyses of Cyg X-1.
2 X-ray light curve and X-ray spectrum
We have determined the flux of GRO J042232 by applying the Earth occultation technique (Harmon et al. 1993) to data obtained with the BATSE large-area detectors (count rates with a 2.048 sec time resolution in 16 spectral channels). The average number of occultation steps of GRO J042232 was 13 per day, ranging from 2 to 24. The systematic error due to the variable orientation of CGRO, is typically 5–10%. The daily averaged flux history of GRO J042232 in the 40–150 keV energy band is displayed in Fig. 1. The X-ray light curve rises from first detection to a maximum of 3 Crab (20–300 keV) in three days, followed by an exponential decrease with a decay time of 43.6 days (Vikhlinin et al. 1995). During the decay of the X-ray light curve, a secondary maximum is observed at about 135 days after the main X-ray maximum. After the secondary maximum the light curve decays at approximately the same rate as before. The whole 1992 X-ray outburst of GRO J042232 lasted for 200 days.
The 40–150 keV X-ray spectrum of GRO J042232 measured by BATSE was approximated by a single power law. A single power law does not provide a good fit to the X-ray spectrum, but is useful as a coarse indicator of the spectral hardness. The power-law index of the spectrum was 2.1 at the peak of the primary outburst; the spectrum became harder during its decay (power-law index of 1.9). The distribution of one-day averaged flux measurements versus the photon power-law indices of GRO J042232 in the 40–150 keV energy band is shown in Figure 2. The distribution is flux-limited ( photons/cm2 sec-1) and contains a total of 126 data points, 23 of which corresponding to the secondary outburst. For flux values above 0.20 photons/cm2 sec-1, flux and power-law index appear to be correlated positively. For photons/cm2 sec-1, the photon power-law index is determined less accurately, and remains constant at 1.890.02 (average of 84 data points, weighted by the individual errors). The weighted average of the photon power-law index obtained during the primary outburst only (1.890.02, 61 data points), is consistent with that of the secondary outburst (1.920.04, 23 data points).
3 Time series analysis
We have used count rate data from the large-area detectors (four broad energy channels) with a time resolution of T 1.024 sec and applied an empirical model (Rubin et al. 1996) to subtract the signal due to the X-ray/gamma-ray background. This model describes the background by a harmonic expansion in orbital phase (with parameters determined from the observed background variations), and includes the risings and settings of the brightest X-ray sources in the sky. It uses eight orbital harmonic terms, and its parameters were updated every three hours.
For our analysis we considered data segments of 524.288 sec (512 time bins of 1.024 sec each) on which we performed Fast Fourier Transforms (FFTs) covering the frequency interval 0.002–0.488 Hz. The average number of uninterrupted 512 bin segments available while the source was not occulted by the Earth was 32 per day. For each of the detectors which had the source within 60∘ of the normal, we calculated the FFTs of the lowest two energy channels (20–50, 50–100 keV) of each data segment separately. These FFTs were coherently summed (weighted by the ratio of the source to the total count rates) and converted to PDSs. The source count rates were obtained from the occultation analysis. The PDSs were normalized such that the power density is given in units of (rms/mean)2 Hz-1 (see, e.g., van der Klis 1995a) and finally averaged over an entire day.
3.1 Power density spectra (PDSs)
The power spectra of GRO J042232 are approximately flat up to a break frequency, and decay as a power law above (see Figure 4). During the first 70 days of the outburst, the PDSs show a significant peak, indicative of QPOs in the time series, superposed on the power-law tail. For all PDSs obtained during this stage of the X-ray outburst, the centroid frequency of the QPO peak is above the break frequency. Beyond day 70, the QPOs are no longer detected significantly in the PDSs; the power spectra obtained during the remaing part of the outburst are well described by a broken power law only.
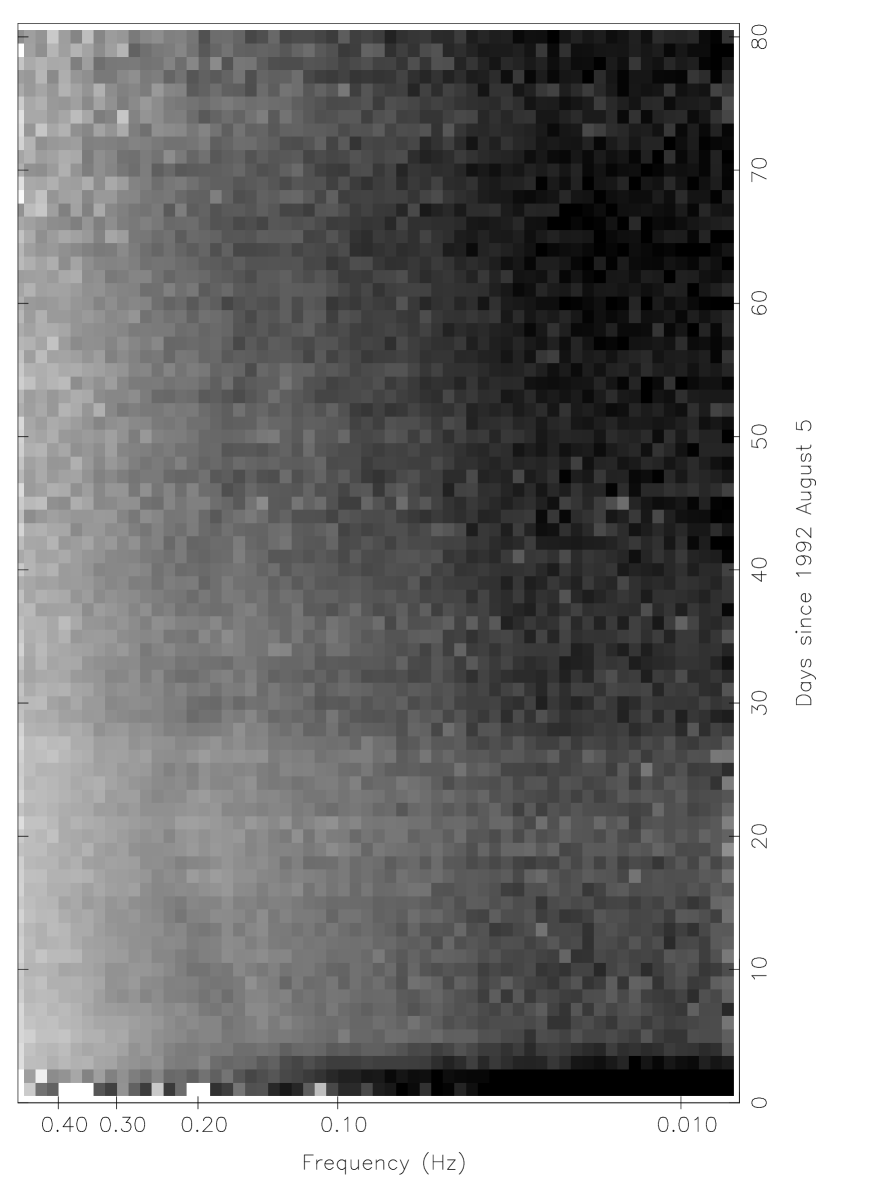
The evolution of the daily averaged PDSs (20–100 keV) of GRO J042232 during the first 80 days of the outburst is illustrated in a dynamical spectrum (Figure 3). In this representation the frequency scale is logarithmically rebinned to 61 bins; the darker the color, the higher is the power level. In Fig. 3, a dark shaded band, indicative of QPOs in the time series, is seen at centroid frequencies between 0.13 and 0.26 Hz until approximately day 70 of the outburst. The centroid frequency of the QPO increases slowly until day 20, and gradually decreases afterwards (see also Figure 6). During days 50–70 of the outburst, there is some evidence for the presence of a second, very weak peak in the power spectra. This second feature is much weaker than the main QPOs peak, and is found at frequencies between the break of the power law and the centroid frequency of the main QPO. From about 70 days after the start of the outburst onward, neither the main QPOs peak nor the second feature are present significantly in the PDSs of GRO J042232.
The break in the power spectra of GRO J042232 is clearly visible at low frequencies in the dynamical spectrum of Fig. 3. During the period displayed in this dynamical spectrum, the break frequency remains constant, and occurs at 0.0370.004 Hz. As the outburst of GRO J042232 proceeds, the power density increases over the total frequency interval of the PDSs. This effect is most prominently seen at low frequencies in the dynamical spectrum, indicated by the darker shaded area starting at day 30, but is present in the total frequency interval of the power spectra. From Fig. 3 it also follows that the power density of the PDSs obtained during the first three days of the X-ray outburst of GRO J042232 is enhanced with respect to the remaining data, indicating increased rapid variability at the very start of the outburst compared to later stages of the outburst.
3.2 Fits to the PDSs
We made fits to the PDSs in the 20–50, 50–100 and 20–100 keV energy bands, using a combination of a Lorentzian profile and a broken power law. To improve statistics, we made fits to the average PDSs of five consecutive days during the first 110 days of the outburst (obtaining 22 five-day averaged PDSs), and averages of ten consecutive days afterward (obtaining 7 ten-day averaged PDSs). A typical five-day averaged power spectrum in the 20–100 keV energy band, together with the model fit, is shown in the top panel of Fig. 4. The model requires seven parameters (three for the Lorentzian, four for the broken power law), which left 27 degrees of freedom as the PDSs were logarithmically rebinned into 34 frequency bins. The Lorentzian profile was included during the first 70 days of the outburst only (i.e. 14 five-day averaged PDSs). Inclusion of a Lorentzian profile during later stages of the outburst did not significantly improve the quality of the fit. We routinely obtained reduced values between 0.6 and 2.9 for the fits to the PDSs. As the outburst of GRO J042232 continued, the received flux decreased (see, e.g., Fig. 1) for which reason the power spectra became ill-constrained at the local flux minimum near day 120 of the outburst. During the secondary maximum the quality of the PDSs improved slightly.
The histories of the break frequency , and indices of the broken power-law component for , and (29 data points in each energy band), are presented in Figure 5. The evolution of the centroid frequency and full width at half maximum (FWHM) of the Lorentzian profile (14 data points per energy band only, as the Lorentzian profile was included only during the first 70 days of the X-ray outburst) are shown in Fig. 6. From these figures it can be seen that the centroid frequency of the Lorentzian profile increased during the first 3 weeks of the outburst of GRO J042232 from an initial value of 0.15 Hz to a maximum of 0.26 Hz, but from that moment on monotonically decreased to 0.1 Hz 70 days after the onset of the outburst. The FWHM of the Lorentzian is determined best in the PDSs in the 20–100 keV energy band. The FWHM of the QPO peak in this energy band does not change significantly during the outburst, although there may be a slight slight tendency to increase as the significance of the QPOs peak in the power spectra diminishes towards the end of the 70 days period. During the first 100 days of the outburst, the average break frequency is 0.041 0.006 Hz (20–100 keV), followed by an increase (within less than 2 weeks) to an average value of 0.081 0.015 Hz during the last 70 days of the outburst. A local minimum in the history of the break frequencies is observed near day 60 of the outburst. The low-frequency flat part of the PDSs below the break frequency appears to steepen during this period. Note that the increase of the break frequency does not coincide with the omission of the Lorentzian profile from the fitting function.
3.3 Break frequency
The relation between the break frequency and the power density at the break in the PDSs of GRO J042232, is displayed in Figure 7 for the 20–50, 50–100, and 20–100 keV energy bands. From the 20–100 keV data it follows that the power density at the break covers a broad range of values (44–89% Hz-1/2), while the break frequency appears to cluster at 0.0410.006 and 0.0810.015 Hz. Data obtained from the secondary outburst of GRO J042232 (7 ten-day averaged PDSs) are indicated in Fig. 7 by triangles, while those of the primary outburst (22 five-day averaged PDSs) are denoted by dots. The 20–100 keV data in this figure (right panel), clearly show that the break frequencies near 0.08 Hz all correspond to PDSs obtained during the secondary outburst of GRO J042232. Those of the primary outburst, all cluster at a frequency near 0.04 Hz. The distribution of the break frequency and the power density at the break determined in the 20–50 keV and the 50–100 keV data shows more scatter, but follows the same trend: the low break frequency corresponds to the primary outburst of GRO J042232, while the high break frequency occurs during the secondary outburst.
This effect is illustrated again in Figure 8, in which we show two averaged power spectra of GRO J042232 in the 20–100 keV energy band, obtained during different stages of its outburst, as well as their respective model fits. The left panel contains two PDSs with equal break frequency, but different power density at the break, i.e., both PDSs were obtained during the primary outburst of GRO J042232. The PDS of day 3–7 (indicated by dots) has a break frequency and power density at the break of (, rms) (0.0380.004 Hz, 552% Hz-1/2); triangles indicate the PDS corresponding to day 68–72 with (0.0370.002 Hz, 762% Hz-1/2). The right panel displays two PDSs with equal power density at the break, but different break frequency, selected from both the primary and secondary outburst. Dots indicate the PDS obtained during day 3–7 as in the left panel, while the triangles correspond to the PDS obtained during day 153–162. The break frequency and power density at the break in this power spectrum were (0.0730.008 Hz, 571% Hz-1/2).
3.4 Fractional rms amplitudes
We determined fractional rms amplitudes by integrating the single-day averaged PDSs of GRO J042232 in the 20–50, 50–100, and 20–100 keV energy bands over three different frequency intervals. One interval covered the flat part of the power spectrum below the break frequency (0.005–0.03 Hz; 12 bins). A second interval was selected in the power-law tail of the PDSs (0.10–0.48 Hz; 199 bins), and the last frequency interval was chosen across the break frequency (0.01–0.10 Hz; 46 bins), including both the flat part and the power-law tail of the PDSs. The history of the integrated fractional rms amplitudes of GRO J042232 in time are given in Figure 9. For each frequency interval over which the PDSs were integrated, the general shapes of these curves in the three different energy bands are very similar. The largest rapid X-ray variability occurs in the lowest energy band.
During the onset of the primary X-ray outburst of GRO J042232, the fractional rms amplitudes decrease rapidly over the total frequency interval in each of the three energy bands of the daily averaged PDSs. The fractional rms amplitudes are especially large during the first two days of the outburst in the low frequency intervals, which can also be seen in the dynamical power spectrum of Fig. 3. At the X-ray maximum of GRO J042232 and shortly thereafter, the rms amplitudes continue to decrease, but at a slower pace. About two weeks after X-ray maximum, the rms amplitudes reach an absolute minimum in each of the three energy bands and in each frequency interval. From that moment on, the fractional rms amplitudes gradually increase until day 65 of the outburst, after which they suddenly decrease to a local minimum at day 73. Such variations in the fractional rms amplitude, are present in each of the histories displayed in Fig. 9. The flux history of GRO J042232 does not show any features during this phase of the outburst, but proceeds its smooth exponential decay (see Fig. 1).
After the local minimum in fractional rms amplitude at day 73 of the outburst, the amplitudes increase again, but become uncertain and are dominated by detector noise at low flux levels of GRO J042232 due to unresolved sources in the uncollimated field of view of BATSE. The largest fractional rms amplitudes are obtained shortly before the onset of the secondary maximum in the light curve. At this secondary maximum, the fractional rms amplitudes obtained in the 0.01–0.10 and 0.10–0.48 Hz frequency intervals again reach a local minimum. The fractional rms amplitudes obtained in the 0.001–0.03 Hz interval do not exhibit such a minimum, but appear to be flat during the remainder of our analysis.
We have plotted the 20–100 keV fractional rms amplitudes obtained in the 0.005–0.03, 0.01–0.10 and 0.10–0.48 Hz frequency intervals, versus the 40–150 keV flux and photon power-law index of GRO J042232 in Figure 10. The distribution is flux-limited, similar to Fig. 2 (0.04 photons/cm2 sec-1), and consists of 103 data points of the primary, and 23 data points of the secondary outburst. The fractional rms amplitudes appear to be anticorrelated with the flux of GRO J042232; the smallest rms amplitudes were obtained at the highest flux values. The single point deviating from the general trend in the fractional rms amplitude versus flux distribution in the 0.005–0.03 and 0.01–0.10 Hz frequency intervals corresponds to day 2 of the outburst. Again, this suggests that the low frequency X-ray variability of GRO J042232 was exceptionally high during the start of its outburst. The photon power-law indices and fractional rms amplitudes also appear to be anticorrelated: the trend in Fig. 10 is one of larger fractional rms amplitudes as the X-ray spectrum of GRO J042232 hardens.
4 Lag spectra
We have calculated lags between the X-ray variations in the 20–50 and 50–100 keV energy bands of the 1.024 sec time resolution data of GRO J042232. The cross amplitudes were created from the Fourier amplitudes , where is the number of time bins (512), denotes the count rate in bin and channel number 0, 1 and corresponds to Fourier frequencies . The complex cross spectra of channel 0 and 1 are given by and were averaged daily. Errors on the real and imaginary parts of these daily averaged cross spectra were calculated from the respective sample variances, and formally propagated when computing the phase and time lags. The phase lags as a function of frequency are obtained from the cross spectra via arctan[Im()/Re()], and the time lag , with the frequency in Hz of the -th frequency bin. With these definitions, lags in the hard (50–100 keV) with respect to the soft (20–50 keV) X-ray variations, appear as positive angles.
The phase lags of GRO J042232 between the X-ray variations in the 20–50 and 50–100 keV energy bands, averaged over a 30 day interval at the start of the outburst, and averaged over an interval covering the following 95 days, are presented in Figure 11. Cross spectra for a large number of days must be averaged and converted to lag values to obtain sufficiently small errors. Cross spectra of the final 55 days of our analysis were not taken into account in the second average, as inclusion of these data did not significantly improve the quality of the average cross spectrum. Figure 12 shows the corresponding time lags on a logarithmic scale. Lags at frequencies above 0.5 are displayed but not taken into account in our analysis, as Crary et al. (1998) have shown that lags between 0.5 and can be affected by data binning, and therefore, decrease artificially to zero. Our results show that at the lowest frequencies the phase lags are consistent with zero (0.0140.006 rad, 0.001–0.02 Hz; 9 bins). At frequencies 0.02 Hz, the hard X-rays lag the soft by 0.0390.003 rad (average of 0.02–0.20 Hz; 94 bins) during the 30 days following start of the outburst of GRO J042232. The phase lag derived for the following 95 days (0.0170.007 rad, 0.02–0.20 Hz) is not statistical significant. During the first 30 days of the outburst of GRO J042232, the hard X-rays lag the soft by an amount of 0.02–0.2 sec in the frequency interval 0.02–0.20 Hz. The time lags decrease in this period with frequency as a power law, with index 0.880.04 for frequencies 0.01 Hz. Although primarily consisting of upper limits, the time lags in the 95 day average are consistent with those obtained at the beginning of the outburst (power-law index of 1.040.32 for 0.01 Hz).
5 Discussion
Soon after the X-ray detection of GRO J042232, a possible optical counterpart was identified by Wagner et al. (1992) and Castro-Tirado et al. (1992, 1993). During the decay to quiescence, its optical brightness was reported to be modulated at several periods ranging between 2.1 and 16.2 hrs. Filippenko et al. (1995) determined the mass function and orbital period to be 1.210.06 M⊙, and 5.080.01 hrs, respectively. This relatively low value for the mass function was confirmed by Orosz & Bailyn (1995) and Casares et al. (1995). The mass function of GRO J042232 is one of the lowest measured values for the SXTs analyzed to date, and provides by itself no dynamical evidence that the compact star in GRO J042232 is a black hole. Callanan et al. (1996) derived an upper limit to the orbital inclination of 45∘ from the ellipsoidal variations. Combined with the spectroscopic measurements, this limiting inclination implies a mass of the compact star in GRO J042232 in excess of 3.4 M⊙. The limits put to the inclination of GRO J042232 by Beekman et al. (1997) from infrared and optical photometry (10∘–31∘) imply an even higher mass limit of the compact star: 9 M⊙. Therefore, based on dynamical arguments, it can be concluded that GRO J042232 most probably contains a black hole. Thus, the dynamical evidence on GRO J042232 supports the early suggestion (Roques et al. 1994), made on the basis of the X-ray properties, that this system contains a black hole.
It is not possible on the basis of BATSE observations alone, to distinguish between black hole source states. However, two independent observations at low X-ray energies during the decay of the X-ray light curve of GRO J042232, suggest that it was in the low (or hard) state. The X-ray spectrum of GRO J042232, obtained about 24 days after the start of the outburst by TTM (2–30 keV) and HEXE (20–200 keV) on board Mir-Kvant, had a power-law shape (photon index 1.5), with no strong soft component and an exponential cutoff at energies above 100 keV (Sunyaev et al. 1993). ROSAT HRI (0.1–2.4 keV) observations 42 days after the start of the outburst, also show no indication for an ultrasoft excess in the X-ray spectrum (Pietsch et al. 1993). Therefore, these observations show that 24–42 days after the X-ray outburst had started, GRO J042232 was in the low state. The lack of significant changes in the hard X-ray properties (see Section 2), indicate that this conclusion applies to the whole outburst.
5.1 Comparison to Cyg X-1
From an analysis of approximately 1100 days of BATSE data (20–100 keV) of the BHC Cyg X-1, covering the period 1991–1995, Crary et al. (1996a) found a strong correlation between the spectral slope and both the high energy X-ray flux and the variability thereof. Although low-energy coverage was lacking, it is likely that Cyg X-1 was in the low state during almost the entire period based on its strong rapid X-ray variability and the presence of a hard spectral component (Crary et al. 1996b). A possible transition to the high state may have lasted for 180 days, starting 1993 September, as the source flux gradually declined over a period of 150 days to a very low level. After that, the flux rose within 30 days, back to the level it approximately had before the low flux episode occured (Crary et al. 1996b).
The strong correlation of the flux and power-law index of GRO J042232 in the 40–150 keV energy band, shown in Fig. 2, is different from the correlation between the same quantities in Cyg X-1 as observed by Crary et al. (1996a). For flux values above 0.20 photons/cm2 sec-1, the flux and photon power-law index of GRO J042232 are related linearly; the larger the high-energy X-ray flux, the softer the X-ray spectrum. The power-law index is constant at 1.890.02 for F0.20 photons/cm2 sec-1. The correlation between the flux and power-law index of Cyg X-1 in the 45–140 kev energy band, however, is in the opposite direction; the larger the 45–140 keV flux of Cyg X-1, the harder its X-ray spectrum (Crary et al. 1996a). For comparison, the figures of Crary et al. (1996a) are reproduced in Figure 13. These show the correlations between the fractional rms amplitude (0.03–0.488 Hz) in the 20–100 keV energy band, and the photon power-law index and flux, for both GRO J042232 and Cyg X-1.
The correlations between the photon power-law index and fractional rms variability in Cyg X-1 and GRO J042232 are very similar; for both sources, the lower the photon power-law index, the larger the fractional rms amplitude.
As a result, the correlation between the flux and the fractional rms amplitude in the 20–100 keV energy band are entirely different for Cyg X-1 and GRO J042232. In the Cyg X-1 data, the distribution of flux and fractional rms amplitude measurements (frequency interval 0.03–0.488 Hz) follows a broad, upturning band, i.e., larger fractional amplitudes at higher flux values (Crary et al. 1996a). However, a strong anticorrelation is found between the 20–100 keV fractional rms amplitude (both 0.01–0.10 and 0.10–0.48 Hz) of GRO J042232, and its 40–150 keV flux (see, e.g., Fig.10). This distribution traces a narrow path in the diagram, with the smallest fractional amplitudes occurring at the largest flux values, or equivalently, at the start of the outburst of GRO J042232.
Crary et al. (1998) studied the Fourier cross spectra of Cyg X-1 with BATSE during a period of almost 2000 days. During this period, Cyg X-1 was likely in both the low, and high or intermediate state. Crary et al. (1998) found that the lag spectra between the X-ray variations in the 20–50 and 50–100 keV energy bands of Cyg X-1 do not show an obvious trend with source state. The X-ray variations of Cyg X-1 in the 50–100 keV energy band lag those in the 20–50 keV energy band over the 0.01–0.20 Hz frequency interval by a time interval proportional to (Crary et al. 1998). The general shape and sign of the phase and time lag spectra of GRO J042232 are very similar to those of Cyg X-1. Significant phase (or equivalently, time) lags in the GRO J042232 data could only be derived during the early stage of its outburst. During this period, the variations in the 50–100 keV energy band lag those in the 20–50 keV energy band by 0.039(3) rad in the frequency interval 0.02–0.20 Hz. The time lags of GRO J042232 during the first 30 days of its outburst, decrease with frequency as a power law, with index 0.9 for 0.01 Hz.
5.2 Break frequency
In several BHCs the break frequency of the PDSs has been observed to vary by up to an order of magnitude while the high frequency part remained approximately constant (Belloni & Hasinger 1990a; Miyamoto et al. 1992). As a result, the break frequency and power density at the break are strongly anticorrelated. Méndez & van der Klis (1997) have collected the relevant data on all BHC power spectra in the low, intermediate and very high state for six BHCs, and show that among these sources the break frequency is anticorrelated to the power density at the break. As this correlation appears to hold across different source states, Méndez & van der Klis (1997) suggest a correlation with mass accretion rate may exist, i.e. the break frequency increases (and the power density decreases) with increasing mass accretion rate (see also van der Klis 1994a).
The break frequency and power density at the break in the PDSs of GRO J042232 are clearly not anticorrelated (see Fig. 7). The power density at the break in the 20–100 keV energy band ranged between 44 and 89% Hz-1/2, while the break frequency was rather constant, at either 0.0410.006 or 0.0810.015 Hz. All PDSs in which the break of the power spectrum was detected near 0.04 Hz were obtained during the primary X-ray outburst of GRO J042232; all PDSs obtained during the secondary outburst have a break frequency near 0.08 Hz. Therefore, the relation between the break frequency and power density at the break is different from the one observed in Cyg X-1 (Belloni & Hasinger 1990a; Miyamoto et al. 1992). This contrast between the PDSs of GRO J042232 and Cyg X-1 was also reported by Grove et al. (1994) based on OSSE data of the first stage of the X-ray outburst of GRO J042232.
The break frequency and power density at the break of BHC power spectra in the low, intermediate and very high state (LS, IS, VHS) collected by Méndez & van der Klis (1997) are reproduced in Figure 14, together with the 20–100 keV data of GRO J042232. However, this representation should be taken with caution, as it combines data obtained in different energy bands, and data of different source states. Fig. 14 shows a clear anticorrelation of the break frequency and power density at the break over two orders of magnitude in both frequency and power density. The low state BATSE data (20–100 keV) of GRO J171924 (van der Hooft et al. 1996) and Cyg X-1 (Crary et al. 1996a), and low state EXOSAT data of Cyg X-1 (Belloni & Hasinger 1990a), clearly follows this anticorrelation. However, the power density at the break detected in the PDSs of GS 2023338 is approximately constant for break frequencies in the 0.03–0.08 Hz interval, but shows a sudden turnover at frequencies 0.03 Hz to large power densities. The absence of the anticorrelation of the break frequency and the power density at the break in the power spectra of GS 2023338 was first reported by Oosterbroek et al. (1997). Although these studies of GRO J042232 and GS 2023338 show that the relation between the break frequency and power density at the break differs in detail from other BHCs in the LS, the data of GRO J042232 and GS 2023338 displayed in Fig. 14 does fit the general anticorrelation, observed in several sources over two decades of frequency and power density, within a factor of 2. It is interesting to note that the absence of an anticorrelation of the break frequency and power density at the break, is found in the PDSs of the two sources which show the lowest break frequencies of all BHCs: GRO J042232 and GS 2023338.
5.3 Earlier temporal analyses of GRO J042232
The hard X-ray variability of GRO J042232 has been studied by Grove et al. (1994) with OSSE (35–600 keV), and by Denis et al. (1994) and Vikhlinin et al. (1995) with SIGMA in the 40–300 and 40–150 keV energy band. The OSSE observations were obtained from 1992 August 11 until September 17, i.e., days 7–44 of the X-ray outburst. Grove et al. (1994) computed PDS in the 35–60 and 75–175 keV energy band. The power spectra show breaks at frequencies of 10-2 Hz and a few Hz, and a strong peaked noise component at 0.23 Hz. Statistically significant noise is detected at frequencies above 20 Hz. The total fractional rms in the 0.01–60 Hz frequency interval for the entire OSSE pointing is 40% (35–60 keV) and 30% (75–175 keV), respectively.
SIGMA observed GRO J042232 from 1992 August 15 until September 25 (days 11–52). Vikhlinin et al. (1995) computed power spectra in the frequency interval 10-4–10 Hz. The power density is nearly constant below a break frequency at 0.03 Hz, and decreases as a power law above, with index 0.9. A strong QPOs peak is detected at a frequency of 0.3 Hz. At the start of the SIGMA observation of GRO J042232 (August 15–27), the PDSs show a significant decrease of the power densities for frequencies lower than 3.510-3 Hz. Such turnover of the PDSs at low frequencies is unusual; PDSs typically exhibit strong very-low frequency noise, or are constant for such low frequencies. The total fractional rms variations (40–150 keV) of GRO J042232 in the frequency interval 10-3–10-1 Hz increased from 15% at the start of the SIGMA observations to 25% at the end. Denis et al. (1994) reported an increase of the fractional rms variation over the same period from 25% (2 upper limit) to 50% (150–300 keV) in the 210-4–1.2510-1 Hz frequency interval.
These results of Vikhlinin et al. (1995) and Grove et al. (1994) are consistent with the results presented here. The shape of the power spectrum of GRO J042232 in the 0.01–0.5 Hz interval is essentially identical in the three studies, although different, but partly overlapping, energy bands have been used. The values of the break frequency and power-law index (both, below and above the break frequency) determined in the OSSE and SIGMA data, are consistent with those presented here. However, OSSE and SIGMA only covered the early phases of the X-ray outburst of GRO J042232, with the exception of its very start. Therefore, the significant change of the break frequency during later stages of the X-ray outburst was missed. Fractional rms amplitudes were determined on a daily basis in the OSSE data (0.01–60 Hz) and SIGMA data (3.610-4–810-2 Hz). At the beginning of the OSSE and SIGMA observations, the fractional rms amplitudes remained constant, or perhaps slightly decreasing, followed by a turnover and gradual increase, similar to the fractional rms amplitude histories displayed in Fig. 9. However, due to data gaps, the moment of turnover is difficult to determine in the OSSE and SIGMA data.
Low-frequency QPOs (0.04–0.8 Hz) have been observed in the PDSs of several BHCs: Cyg X-1, LMC X-1, GX 3394 and GRO J171924 (van der Klis 1995b; van der Hooft et al. 1996). These QPOs were observed while the sources were likely in the low state, with the exception of LMC X-1 where a 0.08 Hz QPO was found while an ultrasoft component dominated the energy spectrum, showing that the source was in the high state. During our observations GRO J042232 was probably in the low state and its PDSs showed a strong QPOs peak with a centroid frequency between 0.13 and 0.26 Hz (20–100 keV). Therefore, GRO J042232 is the fourth BHC with shows low-frequency QPOs in its PDSs while in the low state.
Peaked noise components and QPOs peaks in the power spectra of GRO J042232 have been reported by various groups. Kouveliotou et al. (1992, 1993) reported QPO peaks centered at 0.03 and 0.2 Hz in different BATSE energy bands covering 20–300 keV. Grove et al. (1994) detected a strong peaked noise component in the OSSE data (35–60, 75–175 keV) at a centroid frequency of 0.23 Hz (FWHM 0.2 Hz), and evidence for additional peaked components near 0.04 and 0.1 Hz with a day to day variable intensity. Vikhlinin et al. (1995) report a strong QPO peak in the SIGMA data (40–150 keV) at 0.31 Hz (FWHM 0.16 Hz), with a fractional rms variability of 12%. Likely, the reports of strong noise components at a few 10-1 Hz all refer to the same feature in the PDSs of GRO J042232; the strong QPO peak with a centroid frequency ranging between 0.13 and 0.26 Hz (20–100 keV), present in the power spectra of GRO J042232 during the first 70 days of its outburst. The peaked noise at a few 10-2 Hz reported by Kouveliotou et al. (1992, 1993) and Grove et al. (1994), is detected near the break frequency of the power spectra. These detections may be supported by Vikhlinin et al. (1992), who reported peaked noise at 0.035 Hz (FWHM 0.02 Hz) in 40–70 keV SIGMA data, obtained early in the SIGMA pointing. However, Kouveliotou et al. (1993) report that this peaked noise structure is only detected occasionally in the PDSs of GRO J042232. In the analysis presented here, we do not find significant evidence for such peaked noise structures at a few 10-2 Hz, possibly due to our daily averaging routine, or the fact that these noise components occur close to the break frequency.
5.4 Comptonization models
The power law hard X-ray spectral component of accreting BHCs, which dominate the X-ray emission in the low state, can be described well by Compton upscattering of low-energy photons by a hot electron gas (Sunyaev & Trümper 1979). In such a case, the energy of the escaping photons on average increases with the number of scatterings, and therefore, with the time they reside in the cloud. Therefore, high-energy photons lag those with lower energies by an amount proportional to the photon travel time. If the hard X-rays are emitted from a compact region in the immediate vicinity of the black hole, the resulting time lags should be independent of Fourier frequency and of the order of milliseconds.
The hard X-ray photons (50–100 keV) of GRO J042232 lag the low-energy photons (20–50 keV) by as much as 0.1–1 sec at low frequencies. The time lags are strongly dependent on the Fourier frequency, and decrease roughly as . Similar lag behaviour have been observed in Cyg X-1 (Cui et al. 1997; Crary et al. 1998) and GRO J171924 (van der Hooft et al. 1998) while in the low state. Recently, Kazanas, Hua & Titarchuk (1997) argued that the Comptonization process takes place in an extended non-uniform cloud around the central source. Such a model can account for the form of the observed PDS and energy spectra of compact sources. Hua, Kazanas & Titarchuk (1997) showed that the time lags of the X-ray variability depend on the density profile of such an extended but non-uniform scattering atmosphere. Their model produces time lags between the hard and soft bands of the X-ray spectrum that increase with Fourier period, in agreement with the observations. Therefore, analysis of the hard time lags in the X-ray variability of black-hole candidates could provide information on the density structure of the accretion gas (Hua et al. 1997). The time lags observed in GRO J042232, Cyg X-1 and GRO J171924 are quite similar and support the idea that the Comptonizing regions around these black holes are similar in density distribution and size.
However, the observed lags require that the scattering medium has a size of order 103 to 104 Schwarzschild radii. It is unclear how a substantial fraction of the X-ray luminosity, which must originate from the conversion of gravitational potential energy into heat close to the black hole, can reside in a hot electron gas at such large distances. This is a generic problem for Comptonization models of the hard X-ray time lags. Perhaps very detailed high signal-to-noise cross-spectral studies of the rapid X-ray variability of accreting BHCs, and combined spectro-temporal modeling can solve this problem.
6 Conclusions
We have analyzed the hard X-ray variability of GRO J042232. The canonical anticorrelation between the break frequency and the power at the break observed in Cyg X-1 and other BHCs in the low state, is not present in the PDSs of GRO J042232. The relation between the photon power-law index of the X-ray spectrum and the amplitude of the X-ray variations of GRO J042232 has similarities to that of Cyg X-1; however, the relation between the hard X-ray flux and the amplitude of its variation is opposite to what has been found in Cyg X-1.
References
- Beekman et al. (1997) Beekman, G., Shahbaz, T., Naylor, T., Charles, P.A., Wagner, R.M. & Martini, P. 1997, MNRAS, 290, 303
- (2) Belloni, T. & Hasinger, G. 1990a, A&A, 227, L33
- (3) Belloni, T & Hasinger, H. 1990b, A&A, 230, 103
- Belloni et al. (1997) Belloni, T., van der Klis, M., Lewin, W.H.G., van Paradijs, J., Dotani, T., Mitsuda, K. & Miyamoto, S. 1997, A&A, 322, 857
- Castro-Tirado et al. (1992) Castro-Tirado, A.J., Pavlenko, P., Shlyapnikov, A., Gershberg, R., Hayrapetyan, V., Brandt, S. & Lund, N. 1992, IAU Circ., 5588
- Castro-Tirado et al. (1993) Castro-Tirado, A.J., Pavlenko, E.P., Shlyapnikov, A.A., Brandt, S., Lund, N. & Ortiz, J.L. 1993, A&A, 276, L37
- Callanan et al. (1995) Callanan, P.J., Garcia, M.R., McClintock, J.E., Zhao, P., Remillard, R.A., Bailyn, C.D., Orosz, J.A., Harmon, B.A. & Paciesas, W.S. 1995, ApJ, 441, 786
- Callanan et al. (1996) Callanan, P.J., Garcia, M.R., McClintock, J.E., Zhao, P., Remillard, R.A. & Haberl, F. 1996, ApJ, 461, 351
- Casares et al. (1995) Casares, J., Martin, A.C., Charles, P.A., Martin, E.L., Rebolo, R., Harlaftis, E.T. & Castro-Tirado, A.J. 1995, MNRAS, 276, L35
- Chevalier & Ilovaisky (1995) Chevalier, S. & Ilovaisky, S.A. 1995, A&A, 297, 103
- (11) Crary, D.J., Kouveliotou, C., van Paradijs, J., van der Hooft, F., Scott, D.M., Paciesas, W.S., van der Klis, M., Finger, M.H., Harmon, B.A. & Lewin, W.H.G. 1996a, ApJ, 462, L71
- (12) Crary, D.J., Kouveliotou, C., van Paradijs, J., van der Hooft, F., Scott, D.M., Zhang, S.N., Rubin, B.C., Finger, M.H., Harmon, B.A., van der Klis, M. & Lewin, W.H.G. 1996b, A&A Supp., 120, 153
- Crary et al. (1998) Crary, D.J., Finger, M.H., Kouveliotou, C., van der Hooft, F., van der Klis, M., Lewin, W.H.G. & van Paradijs, J. 1998, ApJ, 493, L71
- Cui et al. (1997) Cui, W., Zhang, S.N., Focke, W., Swank, J.H. 1997, ApJ, 484, 383
- Denis et al. (1994) Denis, M., Olive, J.-F., Mandrou, P., Roques, J.P., Ballet, J., Goldwurm, A., Laurent, Ph., Cordier, B., Vikhlinin, A., Churazov, E., Gilfanov, M., Sunyaev, R., Dyachkov, A., Khavenson, N., Kremnev, R. & Kovtunenko, V. 1994, ApJS, 92, 459
- Filippenko, Matheson & Ho (1995) Filippenko, A.V., Matheson, T. & Ho, L.C. 1995, ApJ, 455, 614
- Garcia et al. (1996) Garcia, M.R., Callanan, P.J., McClintock, J.E. & Zhao, P. 1996, ApJ, 460, 932
- Grove et al. (1994) Grove, J.E., Johnson, W.N., Kinzer, R.L., Kroeger, R.A., Kurfess, J.D. & Strickman, M.S. 1994, in AIP Conf. Proc. 304, The Second Compton Symposium, 192
- Grove, Kroeger, & Strickman (1997) Grove, J.E., Kroeger, R.A. & Strickman, M.S. 1997, in The Transparent Universe: Proc. 2nd INTEGRAL Workshop, ed. C. Winkler, T.J.-L. Courvoisier & Ph. Durouchoux (Noordwijk: ESTEC/ESA), 197
- Harlaftis et al. (1994) Harlaftis, E., Jones, D., Charles, P. & Martin, A. 1994, in AIP Conf. Proc. 308, The Evolution of X-ray Binaries, ed. S. Holt & C.S. Day (New York: AIP), 91
- Harmon et al. (1992) Harmon, B.A., Wilson, R.B., Fishman, G.J., Meegan, C.A., Paciesas, W.S., Briggs, M.S., Finger, M.H., Cameron, R., Kroeger, R. & Grove, E. 1992, IAU Circ., 5584
- Harmon et al. (1993) Harmon, B.A., Wilson, C.A., Brock, M.N., Wilson, R.B., Fishman, G.J., Meegan, C.A., Paciesas, W.S., Pendleton, G.N., Rubin, B.C. & Finger, M.H. 1993, in: AIP Conf. Proc. 280, “1st Compton Gamma Ray Observatory Symp.”, eds. M. Friedlander, N. Gehrels & D. Macomb (New York: AIP), 314
- Hua, Kazanas & Titarchuk (1997) Hua, X.-M., Kazanas, D., Titarchuk, L. 1997, ApJ, 482, L57
- Kato, Mineshige & Hirata (1995) Kato, T., Mineshige, S. & Hirata, R. 1995, PASJ, 47, 31
- Kazanas, Hua & Titarchuk (1997) Kazanas, D., Hua, X.-M., Titarchuk, L. 1997, ApJ, 480, 735
- King, Kolb & Burderi (1996) King, A.R., Kolb, U. & Burderi, L. 1996, ApJ, 464, L127
- Kouveliotou et al. (1992) Kouveliotou, C., Finger, M.H., Fishman, G.J. Meegan, C.A., Wilson, R.B. & Paciesas, W.S. 1992, IAU Circ., 5592
- Kouveliotou et al. (1993) Kouveliotou, C., Finger, M.H., Fishman, G.J., Meegan, C.A., Wilson, R.B., Paciesas, W.S., Minamitani, T. & van Paradijs, J. 1993, in AIP Conf. Proc. 280, Proc. Compton Gamma Ray Observatory, ed. M. Friedlander, N. Gehrels & D.J. Macomb (New York: AIP), 319
- Kuulkers, Howell & van Paradijs (1996) Kuulkers, E., Howell, S.B. & van Paradijs, J. 1996, ApJ, 462, L87
- Martin et al. (1995) Martin, A.C., Charles, P.A., Wagner, R.M., Casares, J., Henden, A.A. & Pavlenko, E.P. 1995, MNRAS, 274, 559
- Méndez & van der Klis (1997) Méndez, M. & van der Klis, M. 1997, ApJ, 479, 926
- Miyamoto et al. (1991) Miyamoto, S., Kimura, K., Kitamoto, S., Dotani, S. & Ebisawa, K. 1991, ApJ, 383, 784
- Miyamoto et al. (1992) Miyamoto, S., Kitamoto, K., Iga, S., Negoro, H. & Terada, K. 1992, ApJ, 391, L21
- Miyamoto et al. (1993) Miyamoto, S., Iga, S., Kitamoto, S. & Kamado, Y. 1993, ApJ, 403, L39
- Orosz & Bailyn (1995) Orosz, J.A. & Bailyn, C.D. 1995, ApJ, 446, L59
- Oosterbroek et al. (1997) Oosterbroek, T., van der Klis, M., van Paradijs, J., Vaughan, B., Rutledge, B., Lewin, W.H.G., Tanaka, Y., Nagase, F., Dotani, T.,Mitsuda, K. & Miyamoto, S. 1997, A&A, 321, 776
- Paciesas et al. (1992) Paciesas, W.S., Briggs, M.S., Harmon, B.A., Wilson, R.B. & Finger, M.H. 1992, IAU Circ., 5580
- Pietsch et al. (1993) Pietsch, W., Haberl, F., Gehrels, N. & Petre, R. 1993, A&A, 273, L11
- Roques et al. (1994) Roques, J.P., Bouchet, L., Jourdain, E., Mandrou, P., Goldwurm, A., Ballet, J., Claret, A., Lebrun, F., Finoguenov, A., Churazov, E., Gilfanov, M., Sunyaev, R., Novikov, B., Chulkov, I., Kuleshova, N. & Tserenin, I. 1994, ApJS, 92, 451
- Rubin et al. (1996) Rubin, B.C., Lei, F., Fishman, G.J., Finger, M.H., Harmon, B.A., Kouveliotou, C., Paciesas, W.S., Pendleton, G.N., Wilson, R.B. & Zhang, S.N. 1996, A&A Supp., 120, 687
- Shrader et al. (1994) Shrader, C.R., Wagner, R.M., Hjellming, R.M., Han, X.H. & Starrfield, S.G. 1994, ApJ, 434, 698
- Sunyaev & Trümper (1979) Sunyaev, R.A. & Trümper, J. 1979, Nature, 279, 506
- Sunyaev et al. (1991) Sunyaev, R. Churazov, E., Gilfanov, M., Pavlinsky, M., Grebenev, S., Babalyan, G., Dekhanov, I., Vamburenko, N., Bouchet, L., Niel, M, Roques, J.P., Mandrou, P., Goldwurm, A., Cordier, B., Laurent, P. & Paul, J. 1991, A&A, 247, L29
- Sunyaev et al. (1993) Sunyaev, R.A., Kaniovsky, A.S., Borozdin, K.N., Efremov, V.V., Aref’ev, V.A., Melioransky, A.S., Skinner, G.K., Pan, H.C., Kendziorra, E., Maisack, M., Doebereiner, S. & Pietsch, W. 1993, A&A, 280, L1
- Tanaka & Lewin (1995) Tanaka, Y. & Lewin, W.H.G. 1995, in: X-ray Binaries, eds. W.H.G. Lewin, J. van Paradijs & E.P.J. van den Heuvel (Cambridge: Cambridge University Press) p. 126
- van der Hooft et al. (1996) van der Hooft, F., Kouveliotou, C., van Paradijs, J., Rubin, B.C., Crary, D.J., Finger, M.H., Harmon, B.A., van der Klis, M., Lewin, W.H.G., Norris, J.P. & Fishman, G.J. 1996, ApJ, 458, L75
- van der Hooft et al. (1998) van der Hooft, F. et al. 1998, subm. to ApJ
- van der Klis (1994) van der Klis, M. 1994, A&A, 283, 469
- (49) van der Klis, M. 1995a, in: The lives of the neutron stars, eds. M.A. Alpar, Ü. Kiziloǧlu & J. van Paradijs (Dordrecht: Kluwer Academic Publishers), 301
- (50) van der Klis, M. 1995b, in: “X-ray Binaries”, eds. W.H.G. Lewin, J. van Paradijs & E.P.J. van den Heuvel (Cambridge: Cambridge University Press), 252
- van Dijk et al. (1995) van Dijk, R., Bennett, K., Collmar, W., Diehl, R., Hermsen, W., Lichti, G.G., McConnell, M., Ryan, J., Schönfelder, V., Strong, A., van Paradijs, J. & Winkler, C. 1995, A&A, 296, L33
- van Paradijs & van der Klis (1994) van Paradijs, J. & van der Klis, M. 1994, A&A, 281, L17
- van Paradijs & McClintock (1995) van Paradijs, J. & McClintock, J.E. 1995, in: X-ray Binaries, eds. W.H.G. Lewin, J. van Paradijs & E.P.J. van den Heuvel (Cambridge: Cambridge University Press), 58
- van Paradijs (1996) van Paradijs, J. 1996, ApJ, 464, L139
- Vikhlinin et al. (1992) Vikhlinin, A., Finoguenov, A., Sitdikov, A., Sunyaev, R., Goldwurm, A., Paul, J., Mandrou, P. & Techine, P. 1992, IAU Circ., 5608
- Vikhlinin et al. (1995) Vikhlinin, A., Churazov, E., Gilfanov, M., Sunyaev, R., Finoguenov, A., Dyachkov, A., Kremnev, R., Sukhanov, K., Ballet, J., Goldwurm, A., Cordier, B., Claret, A., Denis, M., Olive, J.F., Roques, J.P. & Mandrou, P. 1995, ApJ, 441, 779
- Wagner et al. (1992) Wagner, R.M., Bertram, R., Starrfield, S.G. & Shrader, C.R. 1992, IAU Circ., 5589