Possible High-Redshift, Low-Luminosity AGN Activity
in the Hubble Deep Field
Abstract
In the Hubble Deep Field (HDF), twelve candidate sources of high-redshift (z3.5) AGN activity have been identified. The color selection criteria were established by passing spectra of selected quasars and Seyfert galaxies (appropriately redshifted and modified for “Lyman forest” absorption), as well as stars, observed normal and starburst galaxies, and galaxy models for various redshifts through the filters used for the HDF observations. The actual identification of AGN candidates also involved convolving a Laplacian-of-Gaussian filter with the HDF images, thereby removing relatively flat galactic backgrounds and leaving only the point-like components in the centers. Along with positions and colors, estimated redshifts and absolute magnitudes are reported, with the candidates falling toward the faint end of the AGN luminosity function. One candidate has been previously observed spectroscopically, with a measured redshift of 4.02. The number of sources reported here is consistent with a simple extrapolation of the observed quasar luminosity function to magnitude 30 in BJohnson. Implications for ionization of the intergalactic medium and for gravitational lensing are discussed.
1 Introduction
The Hubble Deep Field (HDF) is a Director’s Discretionary program on the Hubble Space Telescope, which provides the deepest image available for investigating galaxies at very high redshifts (see Williams et al. 1996). The field has an area of about 5 square arcminutes, and it was selected for having low extinction and no bright foreground sources. Combined images were obtained with the WFPC-2 camera through four filters: F300W, F450W, F606W, and F814W. For brevity, we call them U, B, V, and I, respectively. The net efficiency curves for the bandpasses are illustrated in Figure 1, taking into account both the filter throughput and the quantum efficiency of the CCD detector. Also shown is an example of a high-redshift quasar spectrum superimposed on the filter bandpasses.
The multicolor HDF images provide a unique opportunity for investigating the faint end of the AGN luminosity function near the epoch of galaxy formation, by identifying point sources within galaxies and with AGN-like colors. Finding pervasive, comparatively low-level AGN sources could be quite important for a variety of reasons. For instance, Steidel and Sargent (1989) postulated the existence of many low-luminosity AGN during the epoch of galaxy formation, in order to explain ionization of the intergalactic medium at high redshift (see Gunn and Peterson 1965). In this regard, Rees (1993) has pointed out that, if intrinsically bright quasars are responsible for intergalactic medium ionization, then they may influence or modulate the development of large-scale environmental inhomogeneities in the early Universe. On the other hand, the situation would be different for more smoothly distributed, comparatively low-level AGN sources. Also, Narayan (1989) noted that a possible gravitational lensing explanation of reported quasar-galaxy correlations could be facilitated by large numbers of faint AGN at high redshift.

Extrapolation of observed quasar surface densities (e.g., MacAlpine et al. 1988; Zamorani et al. 1991) to magnitude 30 in BJohnson for the area of the HDF suggests the likelihood of finding approximately 3 to 30 objects. For a redshift of about 4, this apparent magnitude corresponds to an absolute magnitude of roughly -16, near the low end of the class 1 Seyfert galaxy luminosity function. Although this simple process involves a huge extrapolation in magnitude and thus should not be taken too seriously, it provides a crude first estimate of what one might expect.
We note that Elson et al. (1996) examined unresolved objects in the HDF with I 28 and found no convincing very-high-redshift quasar candidates. Because of our search technique, involving convolution with a Laplacian-of-Gaussian filter, we were able to identify additional unresolved sources within host galaxy backgrounds. None of the AGN candidate sources reported here are in the Elson et al. list, as discussed in Section 4.
A number of groups have derived photometric redshifts for galaxies in the HDF. One of these studies, by Lanzetta et al. (1996), reported 54 galaxies with z = 3 - 4 and 36 with z 4, including 4 with z 6. In our investigation, we did not find what we consider to be convincing evidence for AGN at z 5. In addition, we note that, when we determined the colors for some of the previously reported very-high-z candidate galaxies using only their high S/N central regions, we obtained values consistent with relatively low-redshift galaxies. Only when we expanded the radius of integration for each galaxy, leading to very low S/N characteristics, did the galaxy colors move into the extremely high-redshift region of the color-color plane. We do not consider those colors to be reliable.
The results presented in this paper represent a continuation of work previously reported by Jarvis et al. (1996). Since that time, we have considerably refined our technique for picking out AGN candidates. As noted above and discussed below, we now use a Laplacian-of-Gaussian filter to find star-like sources within galaxies, whose colors are then investigated. This technique produces significantly more reliable identifications, compared with our old method of finding AGN within galaxies by simply looking for compact groups of pixels that have quasar-like colors.
2 Selection Criteria
Because the HDF was observed through four filters, up to three independent colors may be employed in the selection criteria. To determine what criteria are most useful for identifying AGN, we investigated the colors for many different objects: specifically stars, observed galaxies including starbursts, modeled galaxies, quasars, and Seyfert galaxies. Ultimately, we decided not to use the U filter in the bulk of this study and to concentrate on the B-V and V-I colors. The reasons for this decision are twofold. First, we could not get reliable spectral data in that passband for most of the objects of interest, and thus could not accurately determine the predicted U-B colors (for instance). Second, the stars from which we calibrated our point-source magnitudes (see below) were quite dim in U, so we could not get a very good fit for this bandpass, and thus the values for these magnitudes are not very reliable. Because of Lyman line and continuum absorption, we would expect weak U-band fluxes for high-z AGN sources. We retroactively test our candidates for this after the identification process.
For each type of object used in establishing the color selection criteria, we considered measured spectra whenever possible and theoretical or extrapolated spectra when necessary due to limited spectral coverage of the observed data. We integrated each spectrum weighted by the throughput for each filter. Then, effective AB magnitudes were calculated using constant, where is the constant flux that would give the same integrated light as the actual spectrum, and the constant is determined from the published zero points of the WFPC-2 filters. A summary of the results may be seen in the color-color plot of Figure 2, and more information about the spectra is presented below.
2.1 Stars
For sample stars, we used actual spectra observed by Gunn and Stryker (1983). Their data include spectra of main sequence stars from O5 to M8 plus a range of giants and supergiants. The most important for this study are the K and M dwarfs since they begin to approach the region of color space where high-z AGN are found. Specifically, they have B-V colors approaching 2.
2.2 Observed Galaxies
For some of the galaxy colors, we used spectra of nearby galaxies observed by Kennicutt (1992). Because these data do not extend far enough toward the blue for our purposes, we added appropriate extrapolations toward shorter wavelengths, as derived from models by Worthey (1994). Artificially redshifting the spectra, we found their resulting colors for redshifts up to 0.3. Above this, the colors are probably not accurate (see, for example, Dorman et al. 1993), and modeled galaxies may be expected to provide more appropriate spectra.

2.3 Modeled Galaxies
For very high redshifts, we considered modeled (stellar population synthesis) galaxy spectra. We chose to use the Bruzual and Charlot (1993) constant star formation models for ages of 106, 107, 108, and 109 years.
The spectra and colors of high-redshift objects are influenced by absorption due to intergalactic neutral hydrogen. Whereas most of the hydrogen is ionized, enough exists in the neutral state to cause significant Lyman absorption (the Lyman forest), along with weaker Lyman , and Lyman continuum absorption. Using the technique originally employed by Oke and Korycansky (1982), Zuo et al. (1993) characterized this effect with three parameters: , and , corresponding to Lyman , and continuum (hereafter Ly, Ly and Lyc) absorption, respectively. Their best fit for involves a formula that changes at some redshift which they call . In their predicted functional form for , there are 4 parameters: , , , and . They did a least squares fit for these parameters based on 32 QSO spectra and obtained the following results:
for ;
for ),
where the best fit parameters are , , , and .
One way to understand the physical meaning of is that the optical depth due to the Ly forest is . Alternatively, is the average value of the observed flux between Ly and Ly, divided by the continuum flux level just longward of Ly. Whereas Ly absorption has by far the dominant impact on the broadband colors, we have also included associated Ly and Lyc absorption at relevant frequencies.
Taking these absorption effects into account, the modeled galaxy spectra for each age were artificially shifted to redshifts between 0 and 5, with the resulting colors shown in Figure 2. Numbers inside the triangles indicate integral values of z.
2.4 Starburst Galaxies
We considered actual spectra of the starburst nucleus galaxies Mkn 357 and NGC 6090 (from the Astrophysics Data Facility IUE Archives), with necessary extrapolations toward longer wavelengths taken from the broad-band spectral energy distributions of Schmitt et al. (1997). Colors for each of these galaxies were plotted for incremental redshifts between 0 and 2 in Figure 2. We could not meaningfully consider redshifts above 2 due to lack of knowledge about the relevant spectral properties for wavelengths shortward of 1200 Å.
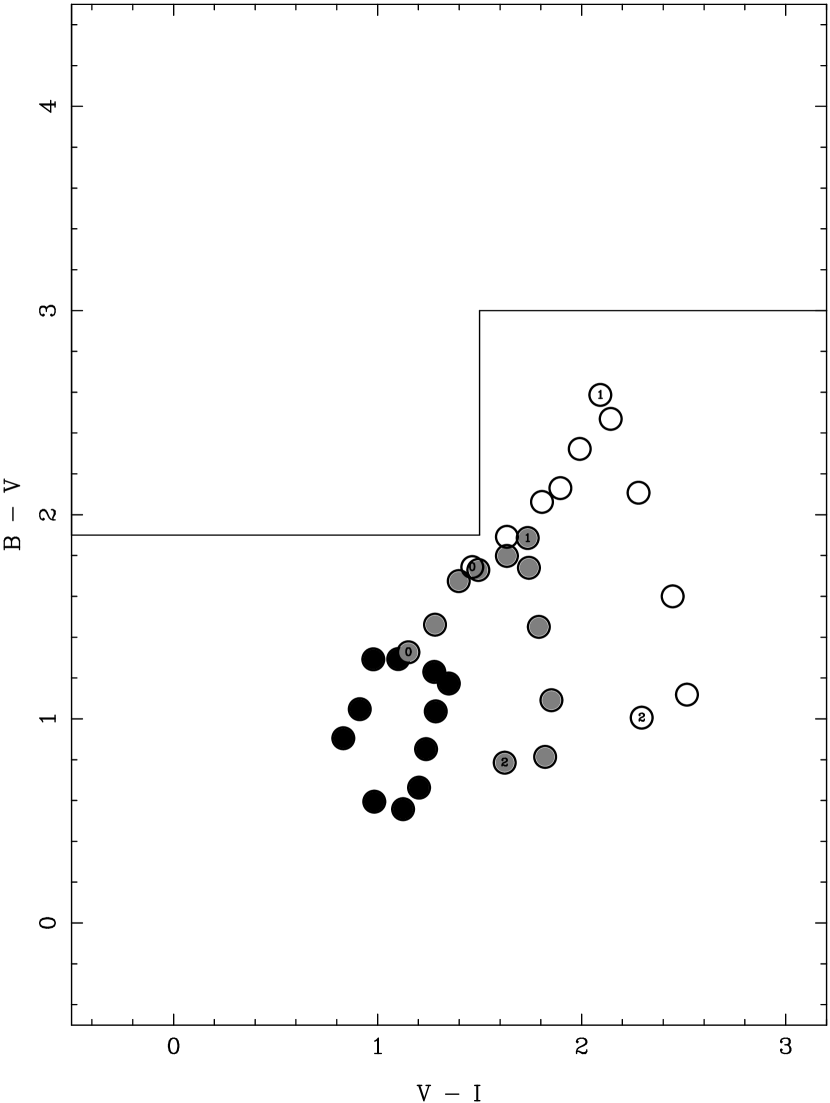
We also investigated what colors could result if low to moderately-high redshift starburst galaxies have substantial internal dust obscuration. Figure 3 shows three additional examples for possible starburst galaxy spectral colors with incremental redshifts from 0 to 2. The black circles correspond to the NGC 6090 spectrum (with additional data from Schmitt et al.), reddened using Osterbrock’s (1989) average reddening law with c = 0.5. The grey and open circles correspond to the same galaxy with c = 1.0 and 1.5, respectively. These are fairly extreme amounts of reddening, but not impossible for a starburst galaxy. The numbers in some circles are integral values of z.
2.5 Quasars
We used the 34 high-redshift (3.1 z 4.9) quasar spectra observed by Schneider et al. (1991a,b). A power law extrapolation of (Zheng et al. 1997) was inserted at the blue end where necessary. Since the observed spectra have effects of intergalactic hydrogen absorption for their actual redshifts, we removed what was already there using the above formulae and then put it back for the appropriate synthetic redshift in each case. On Figure 2, we plotted the quasars’ colors as artificially redshifted to values of z within of the observed redshifts, with colors designated by isolated numbers at integral redshift values.
2.6 Seyfert Galaxies
We considered both class 1 and 2 Seyfert galaxies. Seyfert 1 spectra include Mkn 509, NGC 3783 and NGC 5548, as reported by Koratkar et al. (1997). For Seyfert 2 galaxies, we used spectra of Mkn 573 (see MacAlpine 1988) and Mkn 3 (from the Astrophysics Data Facility IUE Archive). In all cases, geocoronal Ly emission was removed if necessary, an continuum extrapolation was added for Å, absorption effects of intergalactic hydrogen were included as discussed above, and colors were plotted for incremental redshifts between 0 and 5 in Figure 2.
The Seyfert 1 and 2 locations in the color-color plane do not differ substantially, and both are only moderately shifted to higher B-V and lower V-I compared with the quasars. The latter may be understood as a luminosity effect, whereby lower-luminosity AGN have higher line equivalent widths for a given redshift (Baldwin 1997) and also (possibly) partly as an evolution effect involving stronger line cores for lower-redshift objects (see Francis and Koratkar 1995).
Based on Figures 2 and 3, color selection criteria for identifying AGN-like spectra at redshifts from about 3.5 to 5 are: B-V 1.9 and V-I 1.5, or B-V 3 and V-I 1.5, as delineated by lines on the figures. Part of this region of color space may also be expected to contain z 4 galaxies according to the Bruzual and Charlot models.

3 HDF Data Analysis
Since AGN are characterized as being galaxies with star-like sources in the centers, we convolved a second derivative filter with the images to enhance the contrast in the data before looking at colors. Specifically, we used a “Laplacian-of-Gaussian operator” (e.g., Jain et al. 1995), also known as a “sombrero” filter. It is equivalent to smoothing the image with a Gaussian filter, and then taking the Laplacian (, the two-dimensional second derivative) of the result. The scale size for the smoothing part of the function was taken to be the radius of the point spread function (PSF) for the HDF, which is optimal for identifying features of this size. The functional form of the operator is , where is a radial distance measured in units of , the PSF radius. The value of was derived from 4 stars in the field and was found to be 1.33 pixels (0.053 arcsec).
The result of the operation described above is that the contrast of star-size features is greatly magnified. This includes features which are small in only one direction, like spiral arms. The smooth parts of the galaxies are reduced to noise, since the second derivative is essentially zero. Stars are converted into islands, tall peaks surrounded by negative valued troughs111An “ideal” star, for which the flux distribution is (where is again measured in units of , the PSF radius, and A is a constant), takes the following form after being processed: .. Thus, AGN may be expected to appear morphologically as stars at the centers of where galaxies appear in the unprocessed image.
Because of the nature of this operation, it does not make sense to integrate the processed image to find magnitudes. We do know, however, that the height of a resultant “island” is proportional to the intensity of the star-like component, so actual stars would be good calibrators. Therefore, we inferred the magnitudes of the processed objects by comparing them to the processed images of 4 stars in the field, whose magnitudes are known222For these stars, we used the “total” magnitudes reported by Williams et al. (1996).. A plot of the calibration is given in Figure 4, showing the inferred magnitudes of the stars versus their actual magnitudes. We estimate that the error induced by this process is less than 0.1 in each color.

Figure 5 is a color-color plot for those objects with B-V above or near 1.9. The high-z AGN criteria require a B-V color greater than 1.9, but to avoid objects with a poorly defined color we made the additional requirement that only those processed objects with one-sigma B-V error bars that do not extend below 1.5 be included. Of these 32 sources, 12 fall within the previously defined, high-z AGN region of color space, as delineated by lines in the figure. The majority of other designated sources lie where one could expect moderate-redshift, highly-reddened starburst galaxies, as illustrated in Figure 3.
Considering the colors of their “point-like” components, we regard the 12 objects in the high-z AGN region of color space as “AGN candidates,” even though Figure 2 indicates that one might also expect to find some z 4 galaxies there. We note that the majority of these sources (all those with B-V 2.5) have significantly larger B-V measured for the processed point source than for the host galaxy (from Williams et al. 1996), as would be expected for an AGN source within a galaxy according to Figure 2. (B-V colors for galaxy models at z = 4 lie below B-V colors for AGN at z = 4.) Finally, we justify our reference to all of the 12 aforementioned objects as AGN candidates because a major result of this work is to set an upper limit to the number of such sources.
The letters in Figure 5 indicate morphologies, which are somewhat subjective and are based on the visual appearance of the unprocessed image. The letter P indicates that the unprocessed object is not much bigger that a point source - specifically, less than 0.5 arcsec in diameter. The letter C is used for compact galaxies which are clearly larger than point sources but still less than one arcsec in diameter. The letter E designates an elliptical galaxy larger than one arcsec across. Similarly, S indicates a spiral galaxy with a diameter larger than one arcsec.
Figure 6 shows both the processed and unprocessed images of all objects which fall above the line in the high-z AGN region of the diagram, plus selected others which are intended to give the reader a better idea of what the Laplacian-of-Gaussian filter does. Numbers next to the images correspond to ID numbers given by Williams et al. The effect on spiral arms is especially striking, as various features may be seen to stand out more in the processed images. Also, some ellipticals have steep enough cores that the processed shape appears similar to that of a star.
Table 1 lists all 32 sources that are shown in Figure 5. It contains each object’s ID number, its HDF coordinate position (frame, x, y), its sky position (RA, Dec), the colors and magnitude of the point source (B-V, V-I, and I), the colors and magnitude of the unprocessed galaxy (from Williams et al. 1996), the measured redshift of the object if available (from Cohen et al. 1996; Steidel et al. 1996; or Dickinson 1998), and the observed morphology using the same notation as above. For the colors and magnitudes of the point sources, estimated one-sigma errors are listed in parentheses. For example, 1.28(12) means 1.28 0.12. Errors are due to a combination of image noise and calibration noise. As mentioned above, we could not get accurate measurements of U-B colors for the processed objects because the calibrating stars were generally very faint in the U band. Therefore this color is listed, when available, for the host galaxies, but not for the point sources.
For each AGN candidate, Table 2 gives our rough estimate of the redshift based on location in Figure 5 and the implied absolute B magnitude of the host galaxy, assuming and km s-1 Mpc-1. Derived MB values for the point sources within the galaxies would be typically 1-2 magnitudes fainter.
4 Discussion
As illustrated in Figure 5, there are 12 sources which have the morphology and colors to be considered z 3.5 AGN candidates. As a further consistency check, we looked at the U-B colors of the unprocessed objects. If these host galaxies really are at z 3.5, they should also be Lyman break objects. That is, they should not have a measurable U-band magnitude. All 12 of our candidates were not visible in the U band according to the colors listed by Williams et al., so they are all considered to be viable z 3.5 AGN candidates. Precise redshift values are not possible for most of them, but we list rough estimates in Table 2.
| Table 2. Inferred Data For AGN Candidates | ||
|---|---|---|
| Estimated | ||
| ID | Redshift | MBa |
| 2-282.0 | 3.9 | -18.2 |
| 2-436.0 | 3.8 | -17.6 |
| 3-512.0b | 3.7 | -19.2 |
| 4.0 | -19.7 | |
| 3-675.0 | 4.0 | -19.5 |
| 3-775.0 | 4.0 | -18.0 |
| 3-783.0 | 4.2 | -18.4 |
| 3-853.22 | 3.7 | -17.5 |
| 4-277.0 | 4.4 | -18.7 |
| 4-280.0 | 3.7 | -17.5 |
| 4-439.1 | 4.6 | -19.4 |
| 4-551.0 | 4.1 | -17.8 |
| 4-639.2 | 3.8 | -18.5 |
aComputed absolute magnitudes for = 75 km s-1 Mpc-1 and = 0.5.
bThe italicized values for this object are based on the observed redshift.
To our knowledge, only one of our candidates has been observed spectroscopically. As reported by Dickinson (1998), #3-512.0 has a strong Ly emission line for a measured redshift of 4.02. This is reasonably close to our estimated redshift of 3.7 for this object and lends credibility to our technique.
In the Elson et al. (1996) list of unresolved HDF sources, none of the objects correspond to AGN candidates reported here, as noted in the Introduction. However, their Table 1 does contain four of our sources which have colors placing them just outside the high-z AGN candidate region of Figure 5. These are: #3-419.0, #3-491.0, #4-241.3, and #4-713.0, all of which we designated as “compact.” (We note that the x and y pixel positions given by Elson et al. are offset from ours as well as from the standard system of Williams et al. by +75 in each case.)
Absolute B magnitude estimates () in Table 2 for the host galaxies of the AGN candidates were derived for the estimated redshifts, assuming = 75 km s-1 Mpc-1 and . We used the expression (derived from a luminosity distance given by Terrell 1977) where k is the k-correction term. As noted by Peterson (1997) (see also Hewett 1992), k 0 mag for z = 3.5 quasar spectra, and k 0.5 mag for z = 4. For our calculations we used a linear fit to these values. The absolute magnitudes for AGN candidates in Table 2 represent the low-luminosity part of the expected range for class 1 Seyfert galaxies. Seyfert 1 absolute magnitudes typically range from -22 to -18 with the faintest occurring at about -16 (see Veron-Cetty and Veron 1993). The luminosity function for Seyfert 2 galaxies has a maximum about a magnitude fainter than for Seyfert 1 galaxies (Osterbrock 1989).
Our search found sources to a B magnitude of roughly 30. However, the list should not be considered complete to this level. The search technique is complex and requires that the AGN be significantly brighter than the surrounding galaxy light, so galaxies with large star forming regions very close to the AGN could have been missed. However, we do not believe it is likely that we missed many of the high-z AGN in the field, since the star-forming regions would have to be very luminous, and/or the AGN sources would have to be extraordinarily dim; and AGN candidates we did find already would represent unusually faint Seyfert galaxies. The “expected” number of AGN in the field was about 10 plus or minus half an order of magnitude. Thus, the fact that we found 12 probable AGN suggests that there is not a significant overabundance of faint, high-redshift AGN, as postulated by Steidel and Sargent (1989) to account for intergalactic medium ionization.
This result also sets strong limitations on the lensing explanation for observed quasar-galaxy correlations (e.g., Webster et al. 1988). Narayan (1989) noted that one way for a lensing explanation to be consistent with the observed data is for the faint end of the quasar/AGN luminosity function to be significantly increased. However, for this solution to work, there would have to be about 300 AGN with I 28 in the HDF, which is clearly ruled out by our result. We believe, as did Narayan, that a more likely explanation could involve a better understanding of the completeness magnitude for the survey used by Webster et al.
Of course, it must be born in mind that this investigation does not place limits on the number of AGN with z 3.5. As illustrated in Figure 2, there are too many potential sources of confusion in color space for this type of analysis to be effective at lower redshifts.
5 Summary
Using color selection criteria and a Laplacian-of-Gaussian filtering technique to identify point sources within galaxies, we have searched the Hubble Deep Field for spectral/color evidence of high-redshift, low-level AGN activity. We identified 12 possible AGN sources with estimated 3.5 z 5. In all cases, estimated luminosities lie within the low-luminosity range for Seyfert galaxies. The results are consistent with what could be expected from simple extrapolation of the observed quasar luminosity function to very faint magnitudes. This study supports the view that faint AGN activity does not play the major role in ionization of the early intergalactic medium and also the view that observed quasar-galaxy correlations do not imply a very large number of faint AGN to be gravitationally lensed.
References
- (1) Baldwin, J.A. 1977, ApJ, 214, 679.
- (2) Bruzual, G. and Charlot, S. 1993, ApJ, 405, 538.
- (3) Cohen, J.G., Cowie, L.L., Hogg, D.W., Songaila, A., Blandford, R., Hu, E., and Shopbell, P. 1996, ApJ, 471, L5.
- (4) Dickinson, Mark. 1998, astro-ph/9802064 v2.
- (5) Dorman, B. O’Connell, R.W., Rood, R.T. 1993, BAAS, 183, 101.03.
- (6) Elson, R.A.W., Santiago, B.X., and Gilmore, G.F. 1996, NewA, 1, 1.
- (7) Francis, P.J., and Koratkar, A. 1995, MNRAS, 274, 504.
- (8) Gunn, J.E. and Peterson, B.A. 1965, ApJ, 142, 1633.
- (9) Gunn, J.E. and Stryker, L.L. 1983, ApJS, 52, 121.
- (10) Hewett, P. 1992, in Physics of Active Galactic Nuclei, ed. W.J. Duschl and S.J. Wagner (Springer- Verlag), p. 649.
- (11) Jain, R., Kasturi, R., and Schunck, B.G. 1995, Machine Vision (McGraw-Hill, Inc.), p. 157.
- (12) Jarvis, R.M., MacAlpine, G.M, Lemley, S., Smith, M., and Worthey, G. 1996, BAAS, 188, 05.01.
- (13) Kennicutt, Jr., R.C. 1992, ApJS, 79, 255.
- (14) Koratkar, A., Evans, I., Pesto, S., and Taylor, C. 1997, ApJ, 491, 536.
- (15) Lanzetta, K.M., Yahil, A., and Fern ndez-Soto, A. 1996, Nature, 386, 759.
- (16) MacAlpine, G.M. 1988, PASP, 100, 65.
- (17) MacAlpine, G.M. et al. 1988, in Proceedings of a Workshop on Optical Surveys for Quasars, ed. P.S. Osmer, et al. (Astronomical Society of the Pacific), p. 107.
- (18) Narayan, R. 1989, ApJ, 339, L53.
- (19) Oke, J.B and Korycansky, D.G. 1982, ApJ, 255, 11.
- (20) Osterbrock, D.E. 1989, Astrophysics of Gaseous Nebulae and Active Galactic Nuclei (University Science Books), p. 208.
- (21) Peterson, B.M. 1997, An Introduction to Active Galactic Nuclei (Cambridge University Press), p. 165.
- (22) Rees, M.J. 1993, in First Light in the Universe: Stars or QSOs?, ed. B. Rocca-Volmerange et al. (Editions Frontieres), p. 203
- (23) Schmitt, H.R., Kinney, A.L., Calzetti, D., and Storchi-Bergmann, T. 1997, AJ, 114, 592.
- (24) Schneider, D.P., Schmidt, M., and Gunn, J.E. 1991a, AJ, 101, 2004.
- (25) ——-. 1991b, AJ, 102, 837.
- (26) Steidel, C.C., Giavalisco, M., Dickinson, M., and Adelberger, K.L. 1996, ApJ, 112, 352.
- (27) Steidel, C.C. and Sargent, W.L. 1989, ApJ, 343, L33.
- (28) Terrell, J. 1977, Am. J. Ph., 45, 869.
- (29) Veron-Cetty, M. -P. and Veron, P. 1993, A Catalog of Quasars and Active Nuclei, 6th ed. (ESO Sci. Rep. 13, 1).
- (30) Webster, R.L., Hewett, P.C., Harding, M.E., and Wegner, G.A. 1988, Nature, 336, 358.
- (31) Williams, R., et al. 1996, AJ, 112, 1335.
- (32) Worthey, G.S. 1994, ApJS, 95, 107.
- (33) Zamorani, G., Marano, B., Zitelli, V., Mignoli, M., Cimatti, A., and Boyle, B. 1991, in The Space Distribution of Quasars, ed. D. Crampton (Astronomical Society of the Pacific), p. 46.
- (34) Zheng, W., Kriss, G. A., Telfer, R. C., Grimes, J.P., and Davidsen, A.F. 1997, AJ, 475, 469.
- (35) Zuo, L. and Lu, L. 1993, ApJ, 418, 601.