B 1933+503, a dusty radio quasar at :
implications for blank field sub-mm surveys?
Abstract
We present a detailed mm-wave and optical study of the gravitational lens system B 1933+503, discovered by Sykes et al. (1998) in the radio. This object is probably the most complex lens system known, with 10 lensed components within a radius of one arcsecond. It is potentially important as a probe of the Hubble constant, although no optical counterpart has thus far been observed down to . We have obtained new sub-millimetre detections at 450m, 850m and 1350m. We have also constrained the possible dust emission from the proposed foreground lensing galaxy using a -band adaptive optics image and CO(5–4) measurements. A lensing model is constructed, taking the foreground elliptical galaxy at as the lensing mass. From this we derive a scenario from which to model the sub-millimetre emission. Several arguments then point to the source in the B 1933+503 system lying above a redshift of 2. We speculate that unlensed relatives of this source may constitute a sizable fraction of the 850m source counts.
keywords:
galaxies: active – galaxies: starburst – galaxies: individual: B 1933+503 – gravitational lensing – cosmology: observations – infrared: galaxies1 Introduction
The sub-millimeter waveband has recently become an invaluable tool for investigation of the properties of high redshift galaxies. An early result using the Sub-millimetre Common User Bolometer Array (SCUBA) by Smail, Ivison and Blain (1997), showed that a much larger population of dusty, high redshift galaxies existed than previously thought. Since then, much work has gone into identifying just what types of galaxies make up this sub-mm bright population, and what mechanisms may be responsible for the rest-frame far-IR emission [Barger et al. 1998, Eales et al. 1998, Hughes et al. 1998, Ivison et al. 1998, Smail et al. 1998]. An important application of SCUBA results is in constraining the global star formation rate, and a related unresolved issue is determining the fraction of the sub-mm emission due to AGN activity, as opposed to a star-bursting process.
The recently discovered radio object, B 1933+503, is among the most complex gravitational lens systems yet observed, with 10 lensed components within one square arcsecond [Sykes et al. 1998]. The existence of such a large number of images makes this a potentially important candidate for determining the Hubble constant, through the measurement of relative time delays between image pairs. However Hubble Space Telescope and band images of B 1933+503 (also described in Sykes et al. 1998) reveal the lensing galaxy, but no apparent optical counterpart for the source down to about . Hence the source redshift has not yet been obtained. There are two scenarios which could account for the lack of optical emission: 1) the source object is intrinsically underluminous in the optical; or 2) the source or foreground lens is heavily dust enshrouded and thereby obscured at optical wavelengths.
In order to characterise this object in the framework of dusty high redshift sources, and perhaps to shed some light on the source redshift, we obtained sub-millimetre continuum photometry at 450m, 850m and 1350m using the SCUBA instrument on the James Clerk Maxwell Telescope. We have also indirectly constrained the dust obscuration in the lensing galaxy using an upper limit to CO line emission, and a high resolution, adaptive optics band image. Using the combined multi-wavelength data-set, we attempt to further constrain the properties of this system, and towards this end have also developed a new lensing model.
| Property | Telescope | B 1933503 | Comment |
|---|---|---|---|
| (J2000) | 30899 | from VLA map component 4 [Sykes et al. 1998] | |
| (J2000) | 2322 | ||
| Redshift estimate from lens model | see Section 3.2 | ||
| Flux density at: | |||
| GHz | VLA (D) | mJy | All radio components [Sykes et al. 1998] |
| GHz | VLA (D) | mJy | All radio components [Sykes et al. 1998] |
| GHz | VLA (D) | mJy | All radio components [Sykes et al. 1998] |
| GHz | VLA (D) | mJy | All radio components [Sykes et al. 1998] |
| m | JCMT | mJy | SCUBA photometry |
| m | JCMT | mJy | SCUBA photometry |
| m | JCMT | mJy | SCUBA photometry |
| m | IRAS | mJy | XSCANPI limit |
| m | IRAS | mJy | XSCANPI limit |
| m | IRAS | mJy | XSCANPI limit |
| m | IRAS | mJy | XSCANPI limit |
| CFHT/AOB | Point source limit | ||
| HST | Point source limit [Sykes et al. 1998] | ||
| HST | Point source limit | ||
| CFHT/AOB | Aperture magnitude | ||
| HST | Aperture magnitude [Sykes et al. 1998] | ||
| HST | Aperture magnitude limit [Sykes et al. 1998] | ||
| CO(5–4) | JCMT | Assuming linewidth | |
| Redshift | Keck | C. Fassnacht (private communication) |
The paper is organized as follows. We first describe the new and previously existing observations of B 1933+503. We then describe a new lensing model using the foreground elliptical galaxy at as the lensing mass. Various emission mechanisms are explored for the sub-mm flux, taking into account the flat-spectrum radio components, dust, and the possible contamination of the signal by foreground emission in the elliptical. From this we derive the most likely scenario for this object, and consider why it is not more readily observable in the optical and near-infrared bands.
2 Observations
B 1933+503 (hereafter ‘B 1933’) was discovered as part of the Cosmic Lens All-Sky Survey [Jackson et al. 1995], and has already been investigated in some detail at radio and optical wavelengths (see Sykes et al. 1998). We summarize the existing data, as well as our new observations, for both B 1933 and the proposed lensing galaxy in Table 1. We include the radio data, as well as upper limits from IRAS, derived using the XSCANPI application provided by IPAC. These IRAS limits are the 90 per cent confidence limits for the flux per beam at the position of B 1933.
2.1 Submillimeter observations
Our observations were conducted with the SCUBA instrument [Holland et al. 1998] on the James Clerk Maxwell Telescope. On 1997 December 3, we operated the 91 element Short-wave array at 450m and the 37 element Long-wave array at 850m simultaneously in photometric mode, and also the single photometry pixel at 1350m, giving half-power beam widths of 7.5, 14.7, and 21 arcsec respectively. At 450/850m five ‘scans’ of 900 seconds, consisting of 50 integrations each were taken, for a total integration time of 1.25 hours. The central pixel of SCUBA was fixed on the source, B 1933. The 1350m observation consisted of an additional integration time of one hour. In all cases, a 9-point jiggle pattern was employed to reduce the impact of pointing errors by averaging the source signal over a slightly larger area than the beam, resulting in greater photometric accuracy. Whilst jiggling, the secondary was chopped at 7.8125 Hz by 90 arcsec in azimuth, thus the other pixels rotate relative to the sky through the period of the integration, smearing out the effect of possible chopping on to other faint sources. Pointing was checked hourly on the blazar 2036–419 and a sky-dip was performed between each 15 minute scan to measure the atmospheric opacity. The rms pointing errors were below 2 arcseconds, while the average atmospheric zenith opacities at 450m 850m and 1350m were fairly stable with being 0.51, 0.12 and 0.04 respectively. However, there were some short time-scale variations, presumably due to water vapour pockets blowing over at high altitude, which caused some parts of the data-set to be noisier (see Borys, Chapman & Scott 1998 for more details).


The data were reduced using both the Starlink package SURF (Scuba User Reduction Facility, Jenness & Lightfoot 1998), and independently using our own routines [Borys et al. 1998]. Spikes were first carefully rejected from the double difference data. The data were then corrected for atmospheric opacity and sky subtracted using the median of all the array pixels except for obviously bad pixels and the central pixels (the 1350m pixel currently has no provision for subtracting sky variations using the other wavelength pixels). The data were then calibrated against Saturn and the compact HII region K3–50, which were also observed during the same observing shift. The two 850m and 1350m calibrations agreed with each other and also with the standard gains to within 10 per cent. However, at 450m, K3–50 is extended and variable, and is not a good calibration source, while the Saturn 450m calibration agreed with standard gains to within 25 per cent.
We also used the JCMT RxB3 GHz band heterodyne receiver on 1998 January 3, with the widest bandwidth possible (MHz) to observe the 12CO(5–4) GHz line, redshifted to GHz. The intention was to check for a possible high gas mass from the lensing galaxy. No detection was apparent in the data, which were binned to MHz channels, with a resulting rms noise of around mK. We estimate an upper limit of for a Gaussian line with FWHM centred on the measured redshift (see section 3.1).
2.2 CFHT Adaptive Optics, -band image
We observed B 1933 with the Canada-France-Hawaii Telescope in March 1998 with the Adaptive Optics Bonnette (AOB, Rigaut et al. 1998) in place feeding the KIR near-IR camera. The detector has pixels at a scale of arcsec per pixel to Nyquist sample the -band under optimal observing conditions, for a field size of arcsec. The average natural seeing throughout the observations was worse than median for the site at arcsec, and the performance of the system was therefore not optimal, with fairly low Strehl ratios. The estimated resolution in the image near the guide star is arcsec corresponding to a physical scale of pc at (assuming and with ). The adaptive optics corrected Point Spread Function (PSF) degrades in a predictable way with distance from the guiding source, as a function of guide star brightness, atmospheric quality, and wavelength of observation. Therefore the PSF for the position on the detector of B 1933 was constructed from the guide star using a model describing the PSF variation over the observed field [Hutchings et al. 1998]. B 1933 lies arcsec from the guide star and the PSF has a FWHM of 0.31 arcsec.
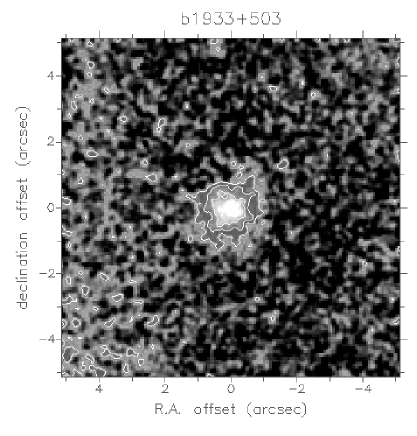
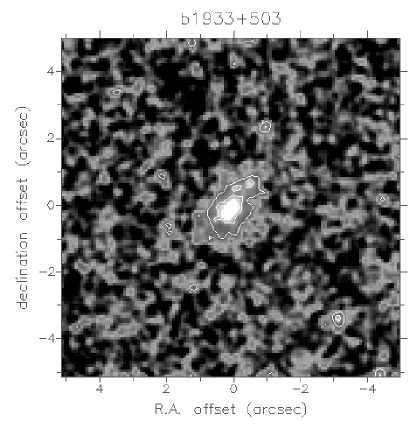
Flux and PSF calibrations were performed using the UKIRT standard stars fs13 and fs25 [Casali & Hawarden 1992]. Flat-field images were taken on the dome with the lamps turned on and off to account for the thermal glow of the telescope. The image was processed using an algorithm described in Chapman et al. (1998, in preparation), where the effects of a noisy, variable sky at 2.2m are reduced using a high signal to noise thermal image consisting of all the -band sky data taken over a 5 night observing run. The signal to noise () of the resulting image is too low to merit deconvolution techniques. The image is displayed, smoothed with a 0.31 arcsec boxcar filter, in Fig. 1, and the HST archive WFPC2 -band image in Fig. 2. There is no obvious detection of the 4 lensed point sources of the radio core in either image, as discussed in the next section. Furthermore, even the foreground galaxy is not detected at -band with HST.
3 Modelling
3.1 The elliptical
Before considering the radio source itself, we examine the possibilities for the sub-millimeter emission to arise in the foreground galaxy. The [] colour of the galaxy is , and [, which is fairly normal for late-type galaxies at this magnitude and redshift range (e.g. Cowie et al. 1994). The colors are certainly consistent with some dust reddening though, with amplitude depending on how red the index is. We fit profiles to both the HST -band and CFHT -band images of this galaxy, as shown in Fig. 3. An profile is a good fit to the core in both cases, with no indication of a central cusp, i.e. no detection of the radio source. The HST -band image shows unresolved knots to the northwest, extending along what appears to be a spiral arm or tidal tail. The profile is distorted at this radius and is not well fit by a disc or bulge model. There is some evidence for elongation along of the -band image, especially in the first 500 second integration when the seeing was the best. This is consistent with the HST image, although the isophotes are closer to circular.
If we suppose that all the sub-mm emission comes from this galaxy instead of the radio source, we can calculate the dust mass required to produce this flux level (following e.g. Hughes, Dunlop & Rawlings 1997). The implied dust mass is , with an associated star formation rate of certainly . This is a copious amount of dust, exceeding that inferred for some ultra-luminous infrared galaxies (e.g. Eales and Edmunds 1996). For a fairly normal looking galaxy, such a large star formation rate would be difficult to explain. In addition, we shall see in section 3.3 that the model fits to the spectral energy distribution (SED) are difficult to reconcile if the sub-mm emission is at .
We can also use the non-detection of CO at the redshift of the elliptical galaxy to estimate the maximum dust mass which could be present. Following Braine & Dupraz (1994), we can take the RMS level achieved at a particular binning scale, and estimate the line intensity limit for lines of a given width. For FWHM lines we find that , or for the JCMT at this frequency. The implied molecular hydrogen gas mass , taking CO(5–4)/CO(3–3) and using a standard to conversion (e.g. Barvainis et al. 1997). An accurate calculation of the mass of molecular gas would require detailed modelling and multiple line constraints. However, if we take this value, together with a typical value for the gas to dust mass ratio, say , then the dust mass is . Even taking the modelling uncertainties into account, this is still an order of magnitude less than the 850m continuum measurement would imply. Uncertainties in the redshift and linewidth probably alos reduce this limit somewhat, but these effects still make it hard for the sub-mm flux to be coming from the elliptical galaxy. The redshift would have to be in error by around 0.005, which is much larger than the estimated error, before our detection threshold would be much affected. Moreover, the dust mass depends on linewidth only as , which is a relatively weak dependence. Moreover, even assuming a dust to gas ratio as small as , the implied dust is still smaller than that implied by the 850m flux.
Although the distorted, knotty morphology at -band is suggestive of ongoing star formation, we can conclude from the above arguments that at most per cent of the sub-mm emission could be arising in the foreground elliptical. This does not imply that the foreground lens cannot be a source of optical obscuration. Indeed a class of ‘dusty lenses’ has been discussed in the literature [Larkin et al. 1994, Lawrence et al. 1995, Malhotra et al. 1996] where the background source is extremely reddened by small amounts of dust in the foreground lens. However, in at least one of these cases (MG1131+0456) the dusty lens hypothesis has been questioned after HST-NICMOS imaging of the source was obtained at -band [Kochanek 1998]. Without such a detection of our source, we are not able to rule out the possibility of some reddening by the foreground lens. Therefore the obscuration of the optical source is currently an unknown combination of self-absorption and absorption through the lens.
3.2 Gravitational lensing
Nair (1998) modelled the lensing of B 1933 using a potential derived from the shape of the HST -band image of the foreground galaxy, and the positions of the detected radio sources. To accurately interpret the spectral energy distribution of B 1933, we first expanded on the Nair model using our new data, and then re-modelled the system to assess the most probable redshift for the source and the sub-mm to far-IR lensing amplification. We will give a more detailed analysis of the lens remodeling and the implications for time delays elsewhere (Lewis et al. in preparation).
3.2.1 Physical parameters of the lens/source
To estimate the source redshift, the crucial parameter to evaluate is the model mass-to-light ratio, , which contains the quantity , which is the ratio of angular size distances from the observer to the source and from the lens to the source. Here and are the mass and luminosity of the galaxy within some aperature. A constraint on , where is the expected mass-to-light ratio of a normal elliptical galaxy, can be used to constrain the redshift.
We write , where is the value appropriate for present day ellipticals and is the evolutionary correction accounting for the fact that galaxies were brighter in the past. We adopt a blue-light from van der Marel (1991) and note that the error is believed to be underestimated by about a factor of 3 due to the use of a fundamental plane relationship to determine distances. The evolutionary correction adopted is ( magnitudes) from the models described in Pozzetti et al. (1996).
The mass of the lensing galaxy is calculated out to a major-axis distance of 1 arcsec from the Nair model, and the luminosity is obtained from the reported photometry [Sykes et al. 1998] within a aperature (which is slightly flatter than the model axial ratio of ). The apparent blue magnitude of the lensing galaxy is calculated from the expression in Lilly et al. (1996) which relates the observed -magnitude to the blue magnitude using a K-correction derived from the CFRS data. The uncertainty in this estimate is dominated by the photometric errors ( per cent).
Two cosmological models, both with , were considered: (i) a standard inflationary model with and (ii) an open model with . The results are independent of the Hubble constant and turn out not to be very sensitive to the cosmological model parameters. However, the derived source redshift is sensitive to the parameters involved in the calculation of and . Using the adopted mean values, we find and 1.640 in cases (i) and (ii) respectively. These are close to the critical values corresponding to an infinite source redshift and, formally, we find in either case. ¿From a consideration of the uncertainties associated with the various parameters that enter into the calculation, we suggest that a realistic error is per cent. Taking the upper limit on , we obtain lower bounds of and 2.18 for the two cosmological models. A model SED is plotted in Fig. 5b for this redshift lower limit (for the model).
There is a separate statistical argument about the source redshift, based simply on the lensing optical depth. Normally this is phrased in terms of the probability of finding the lens at some redshift, given a source redshift, but we can easily turn it around. Kochanek (1993) has discussed the gravitational lens statistics for isothermal spheres, showing, for example, that for a source at redshift , the most probable location of the lens lies at half the proper motion distance to the source. For , and with a uniform prior distribution on the redshift, we find a 95 per cent confidence lower limit of , and a most likely redshift of 2.9 (for an model). While not particularly constraining, this lends some additional support to the above argument for the source being at .
3.2.2 Re-modelling of the lens system
We employed a simple elliptical potential structure [Kochanek et al. 1989], and while the resulting mass profile is different from that used by Nair (1998), and we only used the observed positions as a constraint, the model recovers the image positions to similar accuracy. The total amplification of the core radio component in this model is 13.9, in reasonable agreement with the 14.63 found by Nair (1998).
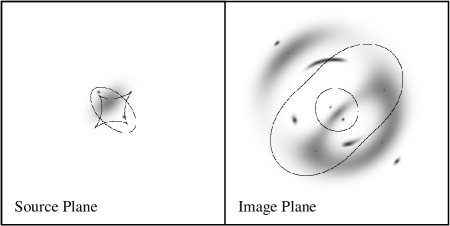
The degree to which the flux from a source is enhanced by the action of gravitational lensing is dependent on the scale-size of the source, leading to possibly pronounced differential magnification effects (e.g. Schneider & Weiss 1992). We model the sub-mm emission as coming from a dusty disc of parsecs in extent, lying perpendicular to the axis defined by the radio core and jet/lobes, and assuming to convert lengths to angles. This corresponds to an extended obscuring torus possibly related to the small-scale (few pc) dusty torus of the standard unified AGN model (see for example the HST image of NGC4261 from Jaffe et al. 1998). Other sizes and geometries could of course be considered; we only present this as one possibility.
Fig. 4 presents the results of our modelling, showing the source plane (left-hand panel) and the resulting image plane (right-hand panel). The darker shading represents both the steep and shallow spectrum radio emission (the central compact source is a little hard to see in the source plane). The field is 1.4 arcsec in extent and the image configuration can be compared directly to fig. 1 in Sykes et al. (1998). Lighter grey here represents the sub-mm emission from a dusty disc model as described above. The resulting far-infrared and sub-mm amplification () is 11.9.
3.3 A dusty radio quasar
All the available data for B 1933 from radio through optical are plotted as a spectral energy distribution in Fig. 5. The point source limiting magnitudes from the background noise in the , and images are converted to flux units using the zero points described in Fukugita et al. (1995). Stickel et al. (1996) show that in many such galaxies, the near-IR can be substantially brighter than the optical. Our -band image with a resolution of 0.31 arcsec FWHM allows us to put a limit of on point source detections within the field. This is comparable to the limit of the HST image of [Sykes et al. 1998] given a steep spectrum like the Stickel et al. (1996) quasar model. The 5 point source sensitivity in the -band image is
The sub-mm data points are used to constrain models consisting of a thick dusty torus, possibly associated with an ongoing burst of star formation, surrounding the central AGN [Granato et al. 1996]. These models were shown to provide good fits to several high redshift ultraluminous systems, thereby throwing into contention the assumption that star formation is the dominant engine in objects such as IRAS F10214+4724 (see Granato et al. 1996, 1997). The standard grey-body emission from a dusty cloud is expected to dominate the sub-mm emission: . We fix the dust emissivity and temperature at typical values for this type of object, , K. A single parameter then describes the orientation of the dust torus with respect to the line of sight, and a nearly edge-on view (corresponding to ) is required to obscure the quasar continuum source enough to approach the upper limits of the and bands (see Fig. 5a, which is for the best estimate of the redshift, ). None of the plotted curves actually falls under the near-IR limits. However, there is enough extra freedom in modelling the dust torus that one cannot conclude from this that extra obscuration is required. On the other hand small amounts of dust in the foreground lens can certainly be invoked to explain the lack of optical/near-IR counterparts [Larkin et al. 1994, Lawrence et al. 1995, Malhotra et al. 1996]. It is generally easier to fit the near-IR limits if the source is at higher redshift, as shown in Fig. 5b. However it must be stressed that HST near-IR observations are showing this hypothesis to be false in some objects [Kochanek 1998].
These model SEDs are difficult to fit to the sub-mm/FIR data if the redshift lies much below our estimated redshift limit (for ) of . In Fig. 6 we plot the sub-mm flux ratio as a function of redshift for curves spanning a range of models of dusty star-forming/AGN galaxies (similar to fig. 3 of Hughes et al. 1998), incorporating extreme parameters for optically thin cool dust emission (; ). We thereby place fairly robust upper and lower limits on the permissible redshift of . However the actual geometry and emission characteristics of the source are unknown, and there are conceivable scenarios where these limits might not hold (e.g. if there were a much larger non-thermal contribution at 850m than assumed here). So again this argument is suggestive only, although it is now the third such argument pointing to .
The most statistically likely redshift is . However, our lens model, with reasonable parameters for the foreground lens, is best fit with even higher values, and with a lower limit to the redshift of . It is also clear from this dust torus model that redshifts in excess of can remain consistent with the sub-mm and far-IR data points, especially if the dust temperature is increased (see Fig. 5b). There is a reasonable lower limit on the redshift from our sub-mm data, and certainly by , the redshift of the foreground lens, they are not even consistent with the IRAS upper limits. From the weight of these individual redshift arguments it seems fairly robust to assume for the source.
Although the 1350m point seems to imply that some radio power law component is still contributing to the emission, the results for our dust emission model fit are not substantially affected. If the non-thermal source contributes at 850m at all, a direct extrapolation from the radio shows it is minimal, and at most would affect the dust emissivity model by a factor of less than 0.2.
We can estimate the dust mass using the optically thin approximation as , with K, and the sub-mm lens amplification (and here using in an universe). If we assume that some fraction of the sub-mm emission is due to dust heated by young stars, rather than the central AGN continuum source, we can estimate a star formation rate of . Calzetti, Kinney & Storchi-Bergmann (1994) have shown that the amount of obscuration is highly dependent on the distribution of the dust. The fact that the optical/near-IR counterparts to the bright radio nucleus are not observed can easily be explained by a combination of dust obscuration in B 1933 itself, and dust in the foreground lens.
4 Discussion
Given that the radio properties of B 1933 suggest that it is a radio-loud elliptical, it is reasonable to assume that the sub-mm emission results from a roughly edge-on dusty disc surrounding the core of the galaxy and heated by the AGN. However, if the AGN phase of massive galaxies has any connection with enhanced star formation rate, then it is certainly possible that some fraction of the sub-mm emission results from dust heated by young massive stars. The radio luminosity is, however, not a good measure of the AGN sub-mm flux, and so we cannot ascertain what fraction of the dust is heated by star formation rather than AGN activity without a spectrum of the source.
An HST-NICMOS program (H.-W. Rix, private communication) will image B 1933 at -band in the near future, and may reveal the source, including some morphological information. This should add a strong constraint to the lensing predictions. Our work predicts that the -band magnitude must be greater than 23, so that it may be within the detection threshold of the HST observation for a reasonable exposure time.
Although the beamsizes of the sub-mm measurements are fairly large, substantially larger than all the lensed components, the average SCUBA source density has been shown to be degree-2 (e.g. Smail et al. 1997, Hughes et al. 1998, Eales et al. 1998) at the depth of mJy RMS that we reach at 850m (the most sensitive of our observational windows), and it is unlikely that another dusty source contributes to the sub-mm flux. We expect only one 24 mJy source per 0.1 degree2 and therefore the chance for a spurious detection of an unrelated source is negligible.
Blain has (1996) modelled the effects of lensing on the distribution of sub-mm sources. A large fraction of the galaxies detected at 850m flux densities in the range 0.1–10 mJy could be gravitationally lensed, implying that lensing in the sub-mm may be a very important consideration for high redshift source counts. Systems such as B 1933 at 2 mJy intrinsic flux density, as well as the Cloverleaf quasar and IRAS F10214+4724 [Barvainis et al. 1995] are known lensed sub-mm sources, which are relatively extreme objects in the amount that they are amplified. We have then caught a rather rare view of a somewhat average dusty radio galaxy at an early epoch, thanks to an excellent chance alignment with a foreground galaxy. This high redshift object appears to be very much a scaled down version of its more extreme cousins (such as SMM 02399-0136 [Ivison et al. 1998], 8C1435+635 [Ivison et al. 1998], or APM 08279+5255 [Lewis et al. 1998], which are otherwise the only objects bright enough to study in detail.
It is interesting to note that if this object were unlensed, or only lensed by the potential of a rich cluster such as the sources discovered in cluster surveys (Smail et al. 1997, 1998; Chapman et al. in preparation), then the sub-mm emission at 850 and 450m would still be detectable by SCUBA in a deep blank field integration, but the 1350m emission would be undetectable with SCUBA, and the radio components would be hard to detect in a VLA integration, such as that used for the discovery of B1933 with a 1 RMS of 0.4 mJy [Sykes et al. 1998]. The optical identification would then be very difficult, given that the true source might have . There would be no way to assess the AGN contribution to the source, and the object would likely be identified as a star forming galaxy with a fairly large SFR of . We hypothesize that a substantial fraction of the faint dusty galaxies discovered in sub-mm surveys could harbour AGN as their main power source, affecting the inferred comoving SFR at high . Although optical surveys have shown that high redshift quasar systems are relatively rare, this could of course be affected by dust obscuration, as in the case of B 1933. Indeed, serendipitous discovery of heavily dust-enshrouded young QSOs at (e.g. H 167, Q 0059-2735, Egami et al. 1996) implies a possibly sizable population of optically obscured AGN at high-.
Another class of dusty objects, the EROs - extremely red objects with (e.g. Hu & Ridgway 1994), have also recently been detected in the sub-mm [Cimatti et al. 1998]. It is still unclear whether there is any AGN contribution in these objects; B 1933 might be another example of this class of object.
The contribution of AGN to counts of SCUBA-bright galaxies is difficult to estimate. This is particularly true since the volume surveyed is essentially unknown (because the redshift range is currently unknown). In addition there is the possible extra effect of lensing amplification. However, the case of B 1933 certainly leads us to be cautious in interpretting all SCUBA detections as highly star-forming galaxies.
5 Conclusions
We have presented new sub-mm and near-IR observations of the complex gravitational lens system, B 1933+503. Our estimate of the total dust mass is likely to be correct to within the errors in our lensing magnification estimate, since the slope of the SED shows that optically thin dust is the most viable explanation for the emission in this wavelength region. The fact that the optical/near-IR counterparts to the bright radio nucleus are not observed can easily be explained via dust obscuration in B 1933 itself, or by invoking a ‘dusty lens’ (as in Lawrence et al. 1995). The large sub-mm flux shows that this object is certainly not underluminous, as originally proposed.
The results show the power of sub-millimeter observations for detection and characterization of obscured galaxies in the distant universe. Investigation of this highly amplified AGN leads us to wonder what fraction of sources detected in ‘blank’ SCUBA fields could be AGN, or lensed, or even both.
ACKNOWLEDGMENTS
This work was supported by the Natural Sciences and Engineering Research Council of Canada. The James Clerk Maxwell Telescope is operated by The Joint Astronomy Centre on behalf of the Particle Physics and Astronomy Research Council of the United Kingdom, the Netherlands Organisation for Scientific Research, and the National Research Council of Canada. The Canada-France-Hawaii Telescope is operated by the National Research Council of Canada, The Centre National de la Recherche Scientifique de France and the University of Hawaii. GFL is a Fellow of the Pacific Institute of Mathematical Science. We would like to thank Chris Fassnacht for a discussion of the redshift uncertainty from the foreground galaxy spectrum, and Charles Lawrence for discussion of dusty lenses.
References
- [Barger et al. 1998] Barger A. J., Cowie, L.L., Sanders D. B., Taniguchi Y., 1998, Nature, 394, 248
- [Barvainis et al. 1995] Barvainis R., Antonucci R., Hurt T., Coleman P., Reuter H.-P., 1995, ApJ, 451, L9
- [Barvainis et al. 1995] Barvainis R., Maloney P., Antonucci R., Alloin D., 1997, ApJ, 484, 695
- [Blain 1996] Blain A.W., 1996, MNRAS, 283, 1340
- [Borys et al. 1998] Borys C., Chapman S.C., Scott D., 1998, submitted to MNRAS, astro-ph/9808031
- [Braine & Dupraz 1994] Braine J., Dupraz C., 1994 A&A, 283, 407
- [Calzetti et al. 1994] Calzetti D., Kinney, A., Storchi-Bergmann, T., 1994, ApJ, 429, 582
- [Casali & Hawarden 1992] Casali M., Hawarden T., 1992 JCMT-UKIRT Newsletter, 3, 33
- [Cimatti et al. 1998] Cimatti A., Andreani P., Röttgering H.J.A., Tilanus R., 1998, Nat, 392, 895
- [Cowie et al. 1994] Cowie L.L., Gardner J.P., Hu E.M., Songaila A., Hodapp K.-W., Wainscoat R.J., 1994, ApJ, 434, 114
- [Dunlop et al. 1994] Dunlop J.S., Hughes D.H., Rawlings S., Eales S.A., Ward M.J., 1994, Nat, 370, 347
- [Eales & Edmunds 1996] Eales S., Edmunds, 1996, MNRAS, 280, 1167
- [Eales et al. 1998] Eales S., Lilly S., Gear W., Dunne L., Bond J.R., Hammer, F., Le Fevre O., Crampton D., MNRAS, submitted
- [Egami et al. 1997] Egami E., Iwamuro F., Maihara T., Oya S., Cowie L.L., 1996, AJ, 112, 73
- [Fukugita et al. 1995] Fugugita M. et al., Shimasaku K., Ichikawa T., 1995, PASP, 107, 945
- [Granato et al. 1996] Granato G.L., Danese, L., Franceschini, A., 1996, ApJL, 460, 11
- [Granato et al. 1997] Granato G.L., Danese, L., Franceschini, A., 1997, ApJ, 486, 147
- [Holland et al. 1998] Holland W.S., et al., 1998, MNRAS, in press
- [Hu & Ridgway 1994] Hu E.M., Ridgway S.E., 1994, AJ, 107, 1303
- [Hughes et al. 1997] Hughes D.H., Dunlop J.S., Rawlings S., 1997, MNRAS, 289, 766
- [Hughes et al. 1998] Hughes D.H., et al., 1998, Nature, 394, 241
- [Hutchings et al. 1998] Hutchings J., Crampton D., Morris S., Steinbring E. 1998, PASP, 110, 374
- [Jaffe et al. 1998] Jaffe W., et al., 1996, ApJ, 460, 214
- [Ivison et al. 1998] Ivison et al., 1998, ApJ, 494, 211
- [Ivison et al. 1998] Ivison et al., 1998, MNRAS, 298, 583
- [Jackson et al. 1995] Jackson N., 1995, MNRAS, 274, L25
- [Jenness & Lightfoot 1998] Jenness T. & Lightfoot, J. F., 1998, in Albrecht, R., Hook, R.N., Bushouse, H.A., eds, ASP Conf. Ser. Vol. 145, Astronomical Data Analysis Systems and Software. Astron. Soc. Pac., San Francisco, p.
- [Kochanek 1993] Kochanek C.S., 1993, MNRAS, 261, 453
- [Kochanek et al. 1989] Kochanek C.S., Blandford R.D., Lawrence C.R., Narayan R., 1989, MNRAS, 238, 43
- [Kochanek 1998] Kochanek C.S., Falco E.E., Impey C.D., Lehar J., McLeod B.A., Rix H.-W., Keeton C.R., Peng C.Y., et al., 1998, submitted to ApJ, astro-ph/9809371
- [Larkin et al. 1994] Larkin J.E. et al., 1994, ApJL, 420, 9
- [Lawrence et al. 1995] Lawrence C. R., Elston R., Januzzi B.T., Turner E.L., 1995, AJ, 110, 2570
- [Lewis et al. 1998] Lewis G.F., Chapman S.C., Ibata R.A., Irwin M.J., Trotten E.J., 1998, ApJL, in press, astro-ph/9807293
- [Lilly et al. 1996] Lilly S., Le Fevre O., Hammer F., Crampton D. 1996 ApJL, 460, 1
- [Malhotra et al. 1996] Malhotra S., Rhoads J.E., Turner E.L., 1996, MNRAS, 288, 138
- [Nair 1998] Nair S., 1998, MNRAS, in press
- [Pozzetti et al. 1996] Pozzetti L., Bruzual A.G., Zamorani, G., 1996, MNRAS, 281, 953
- [Rigaut et al. 1998] Rigaut F. et al., 1998, PASP, 110, 152
- [Sanders et al. 1989] Sanders D., Phinney E. et al., 1989, ApJ, 347, 29
- [Schneider 1992] Schneider P., Weiss A., 1992, A&A, 260, 1
- [Smail et al. 1997] Smail I., Ivison R.J., Blain A. W., 1997, ApJ, 490, L5 (SIB)
- [Smail et al. 1998] Smail I., Ivison R.J., Blain A. W., 1998, ApJL, in press
- [Stickel et al. 1996] Stickel M., Rieke G., Kuhr H., Rieke M., 1996, ApJ, 468, 556
- [Sykes et al. 1998] Sykes C.M. et al., 1998, MNRAS, in press, astro-ph/9710358
- [van der Marel et al. 1996] van der Marel, R.P. 1991, MNRAS, 253, 710