SHADES OF BLACK: SEARCHING FOR BROWN DWARFS & GIANT PLANETS
Abstract
We have searched, so far in vain, for brown dwarfs or giant planets in the vicinity of several nearby stars using cameras built at Université de Montréal attached to the CFHT Adaptive Optics system. Here, we show how pairs of images taken simultaneously through separate filters on, and off, the 1.6 m methane absorption band, can be used to completely defeat speckles, the dominant noise source, while revealing cool brown dwarfs and giant planets in high contrast. We achieve the photon shot-noise limit for data taken without a focal plane mask but, so far, have had less success with data where the image is occulted by a mask.
1 THE CHALLENGE
Figure 1 illustrates the limiting sensitivity needed to detect planetary companions seen only by reflection like the Earth (E) or Jupiter (J) close to nearby stars. m is the magnitude difference from the target star, and the brightness of the planet is assumed to diminish inversely as the square of angular distance. The abscissa, , is the angular separation, , multiplied by the distance to the system in parsecs, . The dashed line to the left of the Jupiter symbol indicates the locus with changing orbital phase.

The brightness of a cool () brown dwarf companion like Gliese 229B, is assumed to be largely independent of separation, and m depends only on the luminosity of the target star. The band shown covers roughly the luminosity range for solar-type primaries. Obviously, cool brown dwarfs should be much easier to detect than planets, but they appear to be rare indeed with the only convincing direct image that of Gl229B (Nakajima et al. (1995)) and possibly an astrometric companion (30, P=530 d) to Gliese 433 detected by Hipparcos and in speckle images (Planets Catalog ). The real challenge is to find wide counterparts to the thirteen short-period Jupiter-mass systems (Planets Catalog ) already detected from accurate measurements of their radial acceleration.
2 THE SPECKLE PROBLEM
Figure 2 is a contour plot showing the squared, absolute difference between two, 0.5 sec exposures at H, taken only seconds apart, of the bright star 55 Cancri. The data were obtained with the AO system on CFHT and the MONICA camera (see below) with the image centre occulted by a focal-plane mask of 0.35 asec radius.. These squared residuals show the unmatched speckle structure between the two images in very high contrast. We name the speckles visible in Figure 2, ‘super-speckles’, because they persist much longer than the few millisecond dwell-time typical of atmospheric turbulence. The core PSF of individual speckles appears to be identical to that of the target image. In Figure 3 we have applied DAOPHOT to the data in Figure 2, treating it as a globular cluster, and the magnitudes of the ‘squared’ speckles are displayed as a function of angular distance from the image centre. The angular distribution of speckle approximates the PSF.
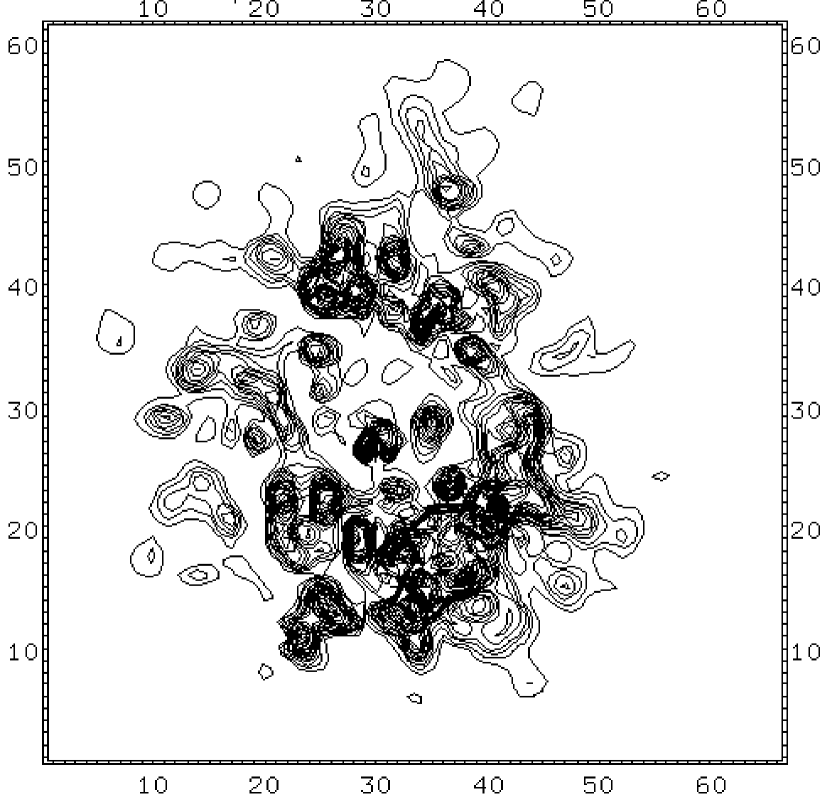

Racine presents a full analysis of speckle shot-noise in another paper at this meeting, pointing out that, because the speckles are identical to the signal expected from a faint companion, they represent the true noise limit to detection, making it orders of magnitude brighter than photon shot-noise for bright stars. In this paper, we describe a simultaneous dual-imaging technique which appears to successfully defeat speckle noise.
3 DUAL-IMAGING
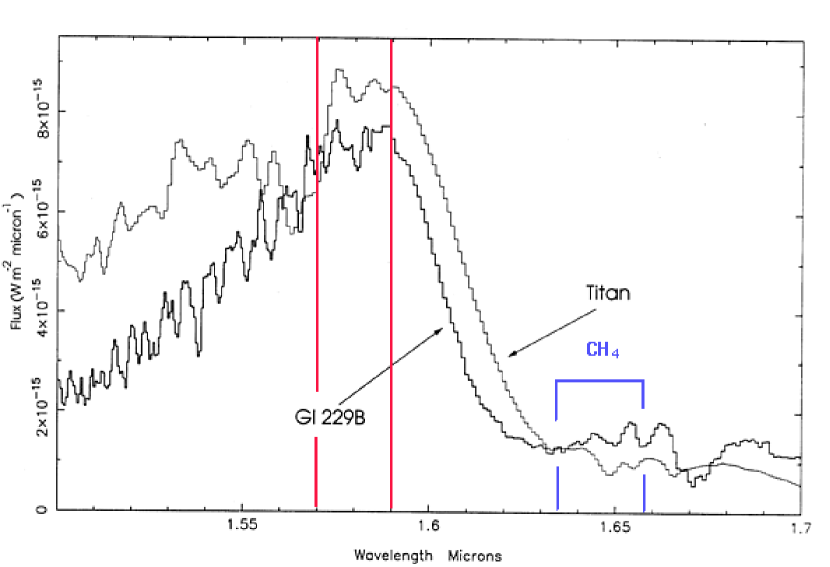

Figure 4 shows the methane decrement near 1.6 m in spectra of Titan and Gl 229B (Geballe et al. (1996)). Hotter brown dwarfs and stars display no such feature and we have selected the two filter bands shown to isolate the continuum and the decrement. One filter is placed in each of the beams emerging from the Wollaston prism in the optical arrangement shown schematically in Figure 5.
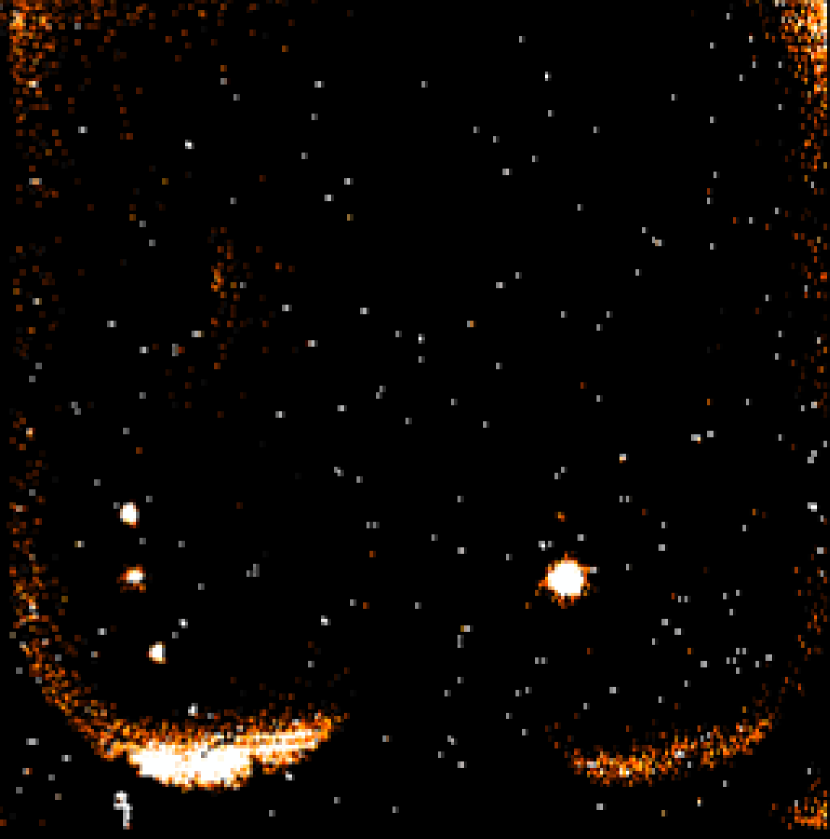
Figure 6 shows the ‘detection’ of a brown dwarf using this dual imaging scheme, where the image was composed by the addition of a G1 229B image to a field in Orion. The continuum is on the right, the methane decrement on the left. The continuum image of Gl 229B stands out in sharp contrast on the right. Giant planets in the Solar system show a similar decrement to that shown on Figure 4 and we assume that extra-solar system gas-giants will show a similar contrast to that in Figure 6.
4 THE DATA
We have had three observing runs with AOB on CFHT, the first two being with the MONICA camera. A focal plane occulting mask was added for the initial MONICA run, while the dual imaging system discussed in the previous section was implemented for the second run together with an out of focus hard mask. The mask was put out of focus to provide a ‘soft’ roll-off at the edge of the mask to avoid ringing and improve image registration. The KIR camera without an occulting mask was used for the third run. Here, we discuss only the second set of data which used the dual imaging module.
The CFHT AOB system is based on curvature sensing and has a 19-zone bimorph mirror (Rigaut et al. (1998)). MONICA (Nadeau et al. (1994)) is a camera built by the Université de Montréal group. It has a 256256 Rockwell NICMOS3 array where the pixel size corresponds to 0.034 asec pxl-1. The data were obtained on the nights of 1997 December 4 & 5 when seeing was 1 asec and the sky partially clear. The conditions for good AO imaging were marginal at best.
In order to eliminate the common speckling pattern between the pairs of images, we reduce the data according to the following scheme:
- bad pixel (1500) correction/interpolation
- correlated noise (60 Hz) suppression
- flat-field division (= bright dome flat dark dome flat)
- sky subtraction for the un-masked data only
the continuum and methane filtered images are then analysed separately:
| methane | methane continuum | continuum |
| align images | align images | |
| add long exposure | add | |
| scaling for diffraction and turbulence | ||
| long exposure | ||
| align long exposures | ||
| scale intensities | ||
| remove background tilt | ||
| subtract residual image |
The scaling for diffraction and turbulence is the most critical step. The Fourier transform of the infinite integration time, non-speckled, AO image of a point source at wavelength can be expressed as (Veran et al. (1997)):
| (1) |
Where is the modulation transfer function (MTF) of an ideal telescope and can be computed analytically, is the MTF of the static aberrations within the telescope and is the structure function of , the turbulent wave-front after AO correction, expressed as wavelength independent optical path differences. If we assume that the finite integration time, speckled, AO image has the same dependence in wavelength and if we consider that over the small wavelength range of interest, the telescope static aberrations are constant, a continuum band () image can be “translated” into a methane band () by the following non-linear operation in the Fourier domain:
| (2) |
where the notation represents the modulus of any complex number . To be successful though, this operation requires the image to be perfectly centered, which is a problem with the masked data. Also, special care must be taken to allow the high spatial frequency component (past the telescope cut-off frequency) of the noise to be preserved and in order to avoid ringing effects.
5 ESTIMATING SHADES OF BLACK
We estimate limiting magnitudes as follows:
-
- correlate image with a truncated PSF probe which = 1 when correlated with the target star image,
-
- generate a circular average from the correlation image.
The results of this analysis are summarised in Figure 7 for a total exposure of 1000 s on 55 Cancri (G8 V, mH=4.4), with no focal plane mask. The upper, solid curve corresponds to the m achieved with speckle suppression by the full subtraction and scaling scheme outlined in section 4, the lower solid line corresponds to the limit in the continuum filter alone without any speckle correction. The improvement of one to two magnitudes in sensitivity represents the gain through speckle suppression for this star and this exposure time. The results tally well with those predicted by Racine who finds close agreement between his model and our results.

The great challenge is to push for the deepest shades of black in the glare close to the target star when the centre of the image is occulted by a mask excluding 90% of the star light. The principal advantage in our case is the lack of detector saturation as we did not have a true coronagraphic configuration with a pupil-plane mask. To date, we have been less successful in speckle cancellation with the masked images, probably because of several problems peculiar to this data set. There was a small differential parallax between the mask and the two images caused by the mask being out of focus. We corrected for the parallax by imposing an enlarged numerical mask before alignment. The alignment is less accurate than for the unmasked images where the image centre is well defined. Our analysis will continue.
The current AO system plus infrared cameras is also plagued by several prominent ghost images, some close to the main image, not all of which are common or of the same relative intensity in both images. Again, we excluded some ghosts with numerical masks. The Rockwell NICMOS3 array in the MONICA camera has severe persistence which makes flat-fielding a challenge in the brightest regions of the image, and can easily lead to faint companion ‘discoveries’ when the target star image dwells in an off-mask position for any time during set-up. We consider that all of these are soluble problems with careful optical design and a new generation of detectors.
References
- Nakajima et al. (1995) Nakajima, T., Oppenheimer, B.R., Kulkarni, S.R., Golimowski, D.A., Matthews, K., & Durrance, S.T., Nature378, 463 (1995).
- (2) Extra-solar Planets Catalog: http://www.obspm.fr/planets
- Geballe et al. (1996) Geballe, T.R, Kulkarni, S.R., Woodward, C.E., & Sloan, G.C., ApJ467, L101 (1996)
- Nadeau et al. (1994) Nadeau, D., Murphy, D.C., Doyon, R. and Rowlands, N., PASP, 106, 909 (1994)
- Rigaut et al. (1998) Rigaut, F., Salmon, D. Arsenault, R., Thomas, J., Lai, O., Rouan, D., Véran, J.-P., Gigan, P., Crampton, D., Fletcher, J.M., Stilburn, J., Boyer, C., & Jagourel, P., PASP, 110, 152 (1998)
- Veran et al. (1997) J.-P. Véran and F. Rigaut and H. Maître and D. Rouan, J. Opt. Soc. Am. A, 14, 11 (1997)