A barred spiral at the centre of the giant elliptical radio galaxy Centaurus A††thanks: Based on observations with ISO, an ESA project with instruments funded by ESA Member States (especially the PI countries: France, Germany, the Netherlands and the United Kingdom) and with participation of ISAS and NASA.
Abstract
We report observations at mid-infrared and sub-millimeter wavelengths of Centaurus A (CenA, NGC 5128), the giant elliptical galaxy that harbors the closest radio loud Active Galactic Nucleus (AGN) to Earth. The dust emission from the deep interior of CenA reveals a bisymmetric structure with a diameter of 5′ (5 kpc), centred at the AGN. This structure is remarkably similar to that of a barred spiral galaxy, with the bar lying in a plane that is tilted 18∘ from the line of sight. The true nature of the distribution of dust in the inner regions of CenA is noticeably displaced from the more chaotic and widespread optical obscuration. The barred spiral is a quasi-stable structure formed at the center of the giant elliptical from the tidal debris of a gas-rich object(s) accreted in the past 109 years. The total size and mass of interstellar gas in the barred spiral at the center of CenA is comparable to the small Local Group spiral galaxy Messier 33. The observation of this remarkable structure opens the more general question on whether the dusty hosts of giant radio galaxies like CenA, are “symbiotic” galaxies composed of a barred spiral inside an elliptical, where the bar serves to funnel gas toward the AGN.
Key Words.:
Galaxies: active – Galaxies: formation – Galaxies: individual: NGC 5128 (Centaurus A) – Galaxies: interactions – Galaxies: jets – Galaxies: spiral – Infrared: galaxies – Radio continuum: galaxies1 Introduction
Radio galaxies are thought to be giant ellipticals powered by accretion of interstellar matter onto a supermassive black hole. Interactions with gas rich galaxies may feed them with cold interstellar matter, but a major problem is how the fueling gas finds its way from typical galactic radii of several kiloparsecs down to a few parsecs from the centre, and at the rates required to power the AGN. Bar structures have been proposed in theoretical models (Shlosman et al. (1989)) as the dynamical instabilities that deliver fuel to the AGN. However, the observation of bars of cold gas and dust in the deep interior of luminous giant ellipsoidal systems of stars that hosts a powerful radio source has been difficult.
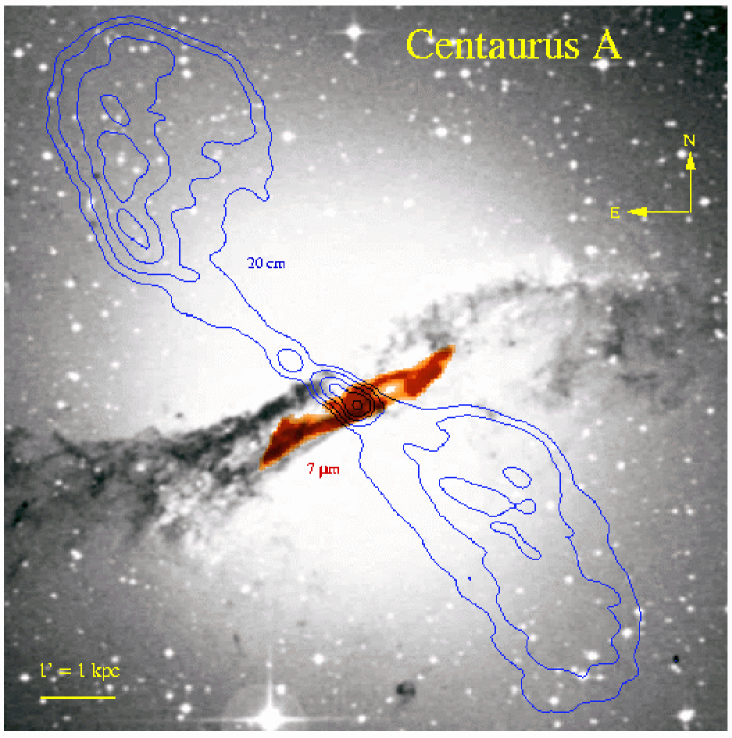
CenA may serve as a template to investigate these questions. The prominent dark bands seen across it suggest that it is the product of the merger between a small gas-rich galaxy with a larger elliptical (Baade Minkowski (1954)). The radio emission comes primary from two large lobes separated by 5∘ on the sky ( 300 kpc at a distance of 3.5 Mpc). The lobes are powered by relativistic jets that emanate from a central region 0.01 pc in size, widely believed to contain a massive black hole (Kellermann et al. (1997)). The center is hidden behind large columns of gas and dust with visual extinctions that reach values as large as AV = 70 mag. The absorption is less critical in the near infrared bands (1-2m), but at these wavelengths the contribution to the total flux from old stars belonging to the ellipsoidal galaxy is a major, if not dominant contributor to the total flux. It is in the mid-infrared and longer wavelengths that the emission from dust in the deep interior of a giant ellipsoidal system can be better traced.
2 ISO and SCUBA observations
Mid-infrared observations were made with the Infrared Space Observatory (Kessler et al. (1996)) Camera ISOCAM (Césarsky et al. (1996)) using the broad-band filters LW2 (5.0-8.5 m, 0 = 6.75 m) and LW3 (12-18 m, 0 = 15 m), and a Circular Variable Filter (CVF) covering the range 5-16 m. The LW2 and LW3 observations were made with a 3″/pixel lens resulting in full widths at half-maximum (FWHM) of 4″and 6″respectively. The CVF observations were done with a 1.5″/pixel lens resulting in full widths at half-maximum (FWHM) in the range of 3-6″ for wavelengths of 5-18 m. The standard data reduction procedures described in the ISOCAM111The ISOCAM data presented in this paper were analyzed using “CIA”, a joint development by the ESA Astrophysics Division and the ISOCAM Consortium led by the ISOCAM PI, C. Cesarsky, Direction de Sciences de la Matière, C.E.A., France. manual were followed (Delaney (1997)). Dark subtraction was performed using a model of the secular evolution of ISOCAM’s dark current (Biviano et al. (1997)). Cosmic rays were removed using a multi-resolution median filtering method (Starck et al. (1996)) while the memory effects of the detector were corrected using the so-called IAS transient correction algorithm which is based on an inversion method (Abergel et al. (1996)). The final raster was constructed after using the instrumental flat fields and correcting for the lens field distortion. These methods and their consequences are discussed in detail in Starck et al. (1998).
Submillimeter observations at 450 m and 850 m were obtained using the Submillimeter Common-User Bolometer Array (SCUBA, Cunningham et al. (1994)) at the James Clerk Maxwell Telescope (JCMT) on Mauna Kea. Observations at both wavelengths were obtained simultaneously using the 91 element shortwavelength array at 450 m (HPBW = 9.5″) and the 37 element longwavelength array at 850 m (HPBW = 14.7″).
3 The dust emission
Figure 1 shows the mid-infrared, radio, and optical images of CenA. The 7 m emission from dust reveals a bisymmetric structure of 5′ ( 5 kpc for a distance of 3.5 Mpc) in total length. In contrast to the optical dark lanes which show a wide and somewhat chaotic distribution, the structure of the mid-infrared emission is remarkably thin, smooth and bisymmetric.
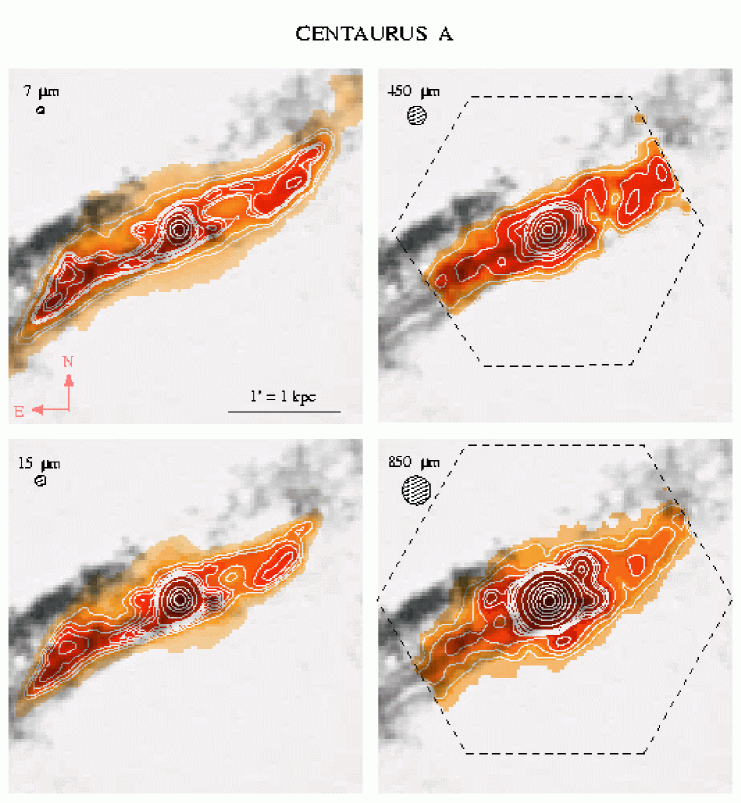
Figure 3 shows maps of CenA in the mid-infrared and submillimeter wavelengths. The emission at 7 m and 15 m observed with ISO comes from small dust grains (radii 0.05 m and less) that can undergo large temperature (Td 100 K) excursions (Désert et al. (1990)). On the contrary, the 450 m and 850 m emission is mostly due to the large and cold (Td 10-20 K) dust grains which dominate the extinction of visible light. The warm dust is clearly displaced from the most prominent optical dark lanes; in the outer regions the 7 m and 15 m disks exhibit anticlockwise twists with increasing radius, whereas the dark lanes in the optical image twist clockwise. The emitting dust is less extended and clearly displaced from the most prominent optical dark lanes.
Figure 3 shows that these two dust components have the same general distribution, and therefore the displacement of the emitting dust from the optical dark lanes in Figures 1 and 3 is not due to major differences between the spatial distributions of the cold and very warm dust components. In a three dimensional tilted and warped disk, projection effects play an important role. The optical appearance of the dark lanes in a luminous ellipsoidal system may be strongly affected by relatively small amounts of cold dust in the outer parts of the bending disk located in the foreground side of the luminous ellipsoidal distribution of stars.
Table 1 gives the infrared/submillimeter fluxes for the inner nuclear region (radius 7.5″) and the bar (annulus of 7.5″–60″). The infrared and submillimeter fluxes from the nuclear region are typically less than 10% of the total flux from the annulus of 7.5″-60″ radius mapped with SCUBA. Assuming where Hz)n with n=1.5-2 and D the distance, the combination of the ISOCAM, SCUBA and IRAS 60 m and 100 m fluxes defines a spectral energy distribution for the annulus that can be fitted by two dust components: Td = 35 K and Md = 7 104 M⊙ and Td = 12 K and Md = 4 107 M⊙. Such large masses of cold dust are observed in spiral galaxies (Alton et al. (1998); Krügel et al. (1998)), once the spectrum at 100 m is taken into account.
The far-infrared luminosity of CenA is 8 109 L⊙, and when combined with a total H2 mass of 3.4 108 M⊙ results in a LFIR/M(H of 24 L⊙/M⊙ (Eckart et al. 1990b ), which is typical of starburst galaxies (Sanders Mirabel (1996)).
The ISOCAM broad band spectrum of the nucleus, shown in Figure 2, is typical of the mid-infrared spectra of AGNs, whereas the spectra of the bright spots in the arcs and arms are typical of photo-dissociation regions in spiral galaxies. The main distinct features in the mid-infrared spectrum of the nucleus relative to the bright spots in the disk are: 1) a noticeable continuum flux below 6 m that seems to be present in every AGN, 2) a strong and steeply rising continuum as a function of wavelength associated with a faint PAH emission perhaps due to contamination by the bar, 3) deep absorption from silicates around 10 m, 4) [Ne III] and [Ne V] emission lines detected in the nuclear region only. The [Ne V] high-excitation line which is predominantly powered by hard AGN radiation fields (Genzel et al. (1998)) is only present in the nuclear region of CenA.
| Filter | ||||
|---|---|---|---|---|
| (m) | (Jy) | (Jy) | (Jy) | |
| ISOCAM LW2 | 7 | 0.6 | 8.8 | 9.4 |
| IRAS 12a | 12 | — | — | 11.2 |
| ISOCAM LW3 | 15 | 1.2 | 10.8 | 12.0 |
| IRAS 25 | 25 | — | — | 20.1 |
| IRAS 60 | 60 | — | — | 145 |
| IRAS 100 | 100 | — | — | 217 |
| SCUBA 450 | 450 | 13 | 177 | 190 |
| SCUBA 850 | 850 | 19 | 76 | 95 |
| LW2/LW3 | 0.50 | 0.82 | 0.78 | |
| 450/850 | 0.68 | 2.32 | 2.00 |
Note: ″ (nucleus); ″- 60″ (disk);
″ (total)
a IRAS fluxes at 12m, 25m, 60m, and 100m were
computed
from processed maps using the maximum entropy deconvolution routine
HIRES (Surace et al. (1993)), which provides a beamsize of 1.5′. It was
impossible to give a reliable estimate for the IRAS flux within the
central 15″ region.

4 Discussion
4.1 The barred spiral
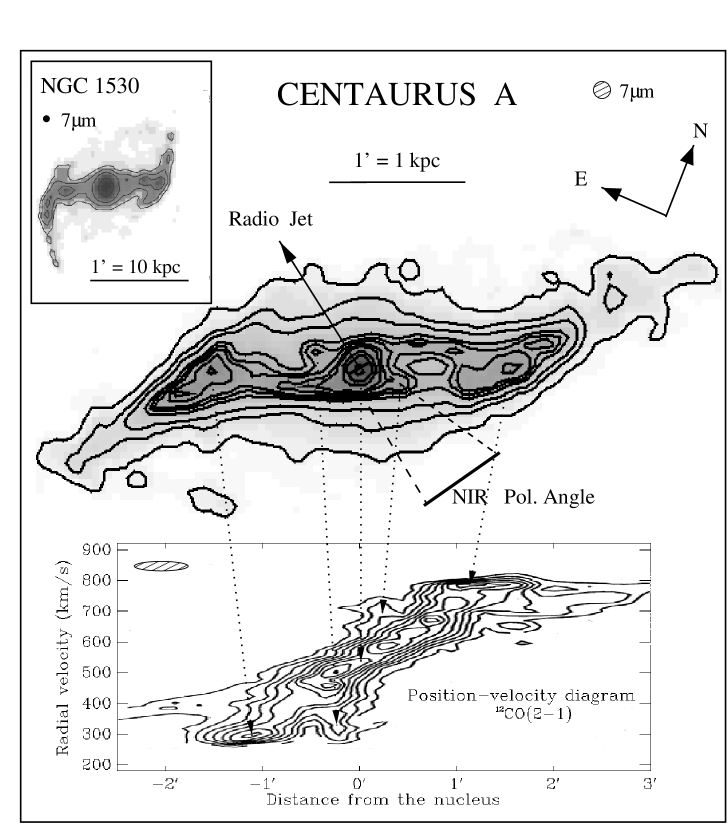
In the following (see Figure 4) it is shown that the interpretation of the bisymmetric structure, observed at the centre of CenA as a barred spiral is fully consistent with: 1) the morphology of the dust lanes, observed in galaxies classified as barred spirals (such as NGC 1530), 2) the kinematics observed in CO data (Eckart et al. 1990b , Quillen et al. (1992)) and 3) theoretical models (Athanassoula (1992)) that predict shocks at the leading edge of bars, producing an arc-like appearance of the warm dust.
The overall structure exhibited by the 7 m emission from CenA is that of a barred spiral with a primary bar extending 1′ in radius from the nucleus, connected in its outer ends to trailing spiral arms that have the typical structures seen in barred spirals with primary bars that end near, but somewhat inside, their corotation resonance. The strongest 7 m emission from the primary bar is along its leading edge in what takes the form of two slightly curved arcs, where shocks and density enhancements should take place according to theoretical models (Athanassoula (1992)). The southeast arc moves toward the observer and is in the foreground side, whereas the northwest arc moves away and is in the background. The inner ends of these two arcs are connected to what may be a secondary nuclear bar whose position angle is defined by the NIR K(2.2 m) band polarization (Packham et al. (1996)). On the plane of the sky the radio jets appear perpendicular to the innermost polarization angle. The rotation in NGC 1530 is clockwise whereas that in CenA is anticlockwise, and the appearance of the trailing arms in CenA can be understood if at the ends of the primary bar (r 70 ″) there is an increase in the inclination due to a strong warp in the disk. This is suggested by the apparent drop in the radial velocities beyond r 70 ″(see Fig. 4). Because of this strong warp the winding structure of the spiral arms in CenA has a leading appearance. The kinematics of the gas in the lower panel is consistent with a barred spiral, where the bar rotates as a rigid body within 70′′, whereas at radii larger than 70′′ the gas exhibits the differential rotation (flat rotation curve) typical of galactic disks. An apparent E–W high velocity feature inside a radius of 20′′ with a high velocity extent of 280 to 750 km s-1in the 12CO(2-1) emission is not accounted for in the above description.
ISOCAM can not resolve features smaller than 5″ but the vectors of polarization at K(2.2 m) which are produced by absorption of the radiation from stars embedded in the dust lane (Packham et al. (1996)) can be used to trace with higher angular resolution the preferential distribution of dust in the innermost central region. The position angle of the polarization shown in Figure 4 suggests the presence of a secondary bar, or “nuclear” bar, of gas of few hundred parsecs in size. This presumed secondary bar inside the primary bar could be the dynamical instability that brings gas towards the supermassive black hole (Shlosman et al. (1989)). In fact, molecular gas absorption has been detected in front of the compact nuclear source at millimeter wavelengths (Eckart et al. 1990a , Israel et al. (1991), Quillen et al. (1992), Wiklind Combes (1997)), and it has been proposed (Israel et al. (1991)) that the absorption at redshifted velocities represents gas falling into the centre.
The jets and the near infrared polarization angle of the innermost region appear to be perpendicular on the plane of the sky (Figure 4). However, the NE jet lies in the foreground and when deprojected from the plane of the sky, the jets may not necessarily be perpendicular to the nuclear bar. Hubble Space Telescope (HST) observations of Pa ( m) have shown a structure with an elongation of 2″ that has been interpreted as an inclined nuclear disk of ionized gas (Schreier et al. (1998)), but it is not perpendicular to the radio jets.
The ISOCAM observations of CenA show more details in the inner morphology of the interstellar matter than previous single-dish millimeter observations of the molecular gas (Eckart et al. 1990b , Israel et al. (1991), Quillen et al. (1992), Rydbeck et al. (1993)). However, the more general characteristics of the circumnuclear molecular structure that were proposed from CO(2-1) observations with a beamwidth (FWHM) of 22″ using deconvolution techniques (Rydbeck et al. (1993)), and from a variety of molecular lines (Israel et al. (1991)), have general resemblances with the structures now seen with higher angular resolution in the mid-infrared. We point out that the interpretation of a barred spiral in the inner region of CenA is not in conflict, and is even fully consistent with the presence of a warped disk at larger radii. The barred spiral is a dynamic instability, i.e. a density wave in the warped disk of gas and dust.
4.2 The formation and survival of the barred spiral
It is believed that the same accretion event(s) that began tearing apart a gas-rich object(s) also created the faint stellar (Malin et al. (1983)) and gaseous (Schiminovich et al. (1994)) shells observed around CenA. It is known that the accretion of a small disk galaxy by a massive elliptical would lead to the complete tidal disruption of the former as it spirals inward in the potential of the elliptical galaxy (Hernquist Quinn (1989)). In this process the gas decouples from the stars and sinks more readily to the centre (Barnes & Hernquist (1992)), forming a new disk out of the gaseous component alone. In CenA the overall angular momentum of the newly formed disk is not aligned with the major axis of the elliptical. Therefore, the gaseous disk is subject to torques forcing it to warp (Barnes & Hernquist (1992)). Although gas is still settling towards the central regions, the morphological and dynamical symmetry of the spiral indicate that it is a stable structure and not a transient feature. Rotating at 250 km s-1 it must have undergone several full rotations depending on how long after the initial encounter it took the gas to settle into the central disk we now see.
Using near infrared photometry (Quillen et al. (1993)), as well as the kinematics of the gas, a disk-to-total mass ratio within the turnover radius of the rotation curve (within a sphere of 70 ″) of the order of is obtained. N-body simulations would rule out that a low-mass stellar bar has formed spontaneously in the disk, and survived at steady-state. However these simulations consider stellar disks, while here we are dealing with a gaseous one. Assuming a much smaller velocity dispersion for the molecular gas of 5-10 km s-1 (compared with 50 km s-1 for a stellar disk and 145 km s-1 for the spheroidal component in CenA, Wilkinson et al. (1986), Eckart et al. 1990a ), we derive a much lower Toomre’s Q parameter (of the order of 1) for the gaseous disk in CenA. Therefore, a gaseous disk is much more self-gravitating than a stellar one of similar mass. Consequently, the bar in CenA can be in a quasi-steady state and might have been formed spontaneously, or be driven.
4.3 The symbiotic galaxy CenA: A template for giant radio galaxies
Probably CenA is not an exception and could serve as a well-positioned template to examine in detail the clues to the origin and evolution of activity in early-type radio galaxies with similar radio morphology, namely, with giant double radio lobes. This class of radio galaxies can only be produced if there is continuous injection of relativistic jet energy for 108 years, which requires enormous reservoirs of interstellar gas and dust. In fact, prominent dust bands are frequently observed in the hosts of giant radio galaxies. Fornax A, the second nearest radio galaxy of this class, exhibits the dusty signs for the merger of gas-rich galaxies on an early type galaxy. Cygnus A, the prototype radio galaxy with double morphology, is crossed by prominent optically dark bands that contain 108 M⊙ of dust (Robson et al. (1998)). On the other hand, it has been shown that in dusty radio galaxies with double radio structure, the dust is usually found perpendicular to the radio axis, which suggests a connection between the mechanism leading to these double radio morphologies and the rotation axis of the dust (Kotanyi Ekers (1979),van Dokkum & Franx (1995)).
The specific mechanism in rapidly rotating disks of gas and dust that brings fuel to the central engine in radio loud AGNs has been difficult to probe observationally for several reasons. First, galaxies similar to CenA are at greater distances (for instance, Fornax A is 5-10 times and Cygnus A is 70 times more distant than CenA), and at those distances it is difficult to see the detailed morphology of dust and gas on scales 100 pc. Second, at optical and near-infrared wavelengths the light from the old stellar population with a giant ellipsoidal distribution overwhelms any emission from dust and newly formed stars in the deep interior. It is in the mid-infrared that the emission from very warm dust can be better traced, and to this end we had to wait for the unprecedented capabilities of ISOCAM. Third, the observation of the cold gas distribution by means of millimeter observations of weak molecular line emission on top of the strong continuum of powerful radio galaxies is a difficult task.
The barred spiral at the centre of CenA has dimensions comparable to that of the small Local Group galaxy Messier 33, and is much larger than the small dusty and/or ionized spiral features of 100-200 pc radius seen with the HST in elliptical galaxies (Ford Tsvetanov (1998)). It lies on a plane that is almost parallel to the minor axis of the giant elliptical. Whereas the spiral rotates with maximum radial velocities of 250 km s-1, the ellipsoidal stellar component seems to rotate slowly (maximum line-of-sight velocity is 40 km s-1) approximately perpendicular to the dust lane (Wilkinson et al. (1986)). The genesis, morphology, and dynamics of the spiral formed at the centre of CenA are determined by the gravitational potential of the elliptical, much as a usual spiral with its dark matter halo. On the other hand, the AGN that powers the radio jets is fed by gas funneled to the center via the bar structure of the spiral. The spatial co-existence and intimate association between these two distinct and dissimilar systems suggest a “symbiotic” association.
5 Conclusions
From the observations reported here we can conclude that:
1) A quasi-stable barred spiral with the size of a small galaxy was formed at the centre of the giant elliptical CenA, out of the tidal debris of gas-rich accreted object(s).
2) The spiral has an infrared luminosity per unit mass of interstellar molecular gas typical of starburst galaxies.
3) The bar may be the dynamical instability that serves to steadily feed the AGN with the amount of fuel that is required to power the giant radio lobes.
4) The spiral and the elliptical are distinct systems in symbiotic association.
5) The observations reported here open the question on whether giant radio galaxies are in general, like CenA symbiotic galaxies.
Acknowledgements.
We thank E. Athanassoula, A. Bosma, J. Lequeux, M. Prieto, D. Golombek, F. Macchetto & F. Combes for their valuable comments and aid on different aspects of this work. ISO is an ESA project with participation of ISAS and NASA. The JCMT is operated by the observatories on behalf of the UK Particle Physics and Astronomy Research Council, the Netherlands Organization for Scientific Research, and the Canadian National Research Council.References
- Abergel et al. (1996) Abergel A., Bernard J.P., Boulanger F., et al., 1996, A&A 315, L329
- Alton et al. (1998) Alton P.B., Trewhella M., Davies J.I. et al., 1998, A&A 335, 807
- Athanassoula (1992) Athanassoula E., 1992, MNRAS 259, 345
- Baade Minkowski (1954) Baade W., Minkowski R., 1954, Ap.J. 119, 214
- Barnes & Hernquist (1992) Barnes J.E., Hernquist L., 1992, ARA&A, 30, 705
- Biviano et al. (1997) Biviano A., Sauvage M., Roman P., E.S.A/C.E.A Technical report, December 1997
- Césarsky et al. (1996) Césarsky C.J., Abergel A., Agnese P. et al., 1996, A&A 315, L32
- Condon et al, (1996) Condon J.J., Helou G., Sanders D.B., Soifer B.T., 1996, A&ASS 103, 81
- Cunningham et al. (1994) Cunningham C.R., Gear W.K., Duncan W.D., Hastings P.R., Holland W.S., 1994, in Advanced Technology MMV, Radio and Terahertz Telescopes ed Phillips, T. Proc. SPIE, 2198, 638
- Delaney (1997) Delaney M., 1997, “ISOCAM Interactive Analysis User’s Manual”, SAI-96-5226/Dc.
- Désert et al. (1990) Désert F.-X., Boulanger F., Puget J.L., 1990, A&A 237, 215
- Dufour et al. (1979) Dufour R.J., Harvel C.A., Martins D.M. et al., 1979, AJ 84, 284
- (13) Eckart A., Cameron M., Genzel R. et al., 1990a, ApJ 365, 522
- (14) Eckart A., Cameron M., Rothermel H. et al., 1990b, A&A 363, 451
- Ford Tsvetanov (1998) Ford H., Tsvetanov Z. 1998, astro-ph/9801180
- Genzel et al. (1998) Genzel R., Lutz D., Sturm E., et al., 1998, ApJ 498, 579
- Graham (1979) Graham J.A., 1979, AJ 232, 60
- Hernquist Quinn (1989) Hernquist L., Quinn P.J., 1989, ApJ 342, 1
- Israel et al. (1991) Israel F.P., van Dishoeck E.F., Baas F., de Graauw T., Phillips T.G., 1991, A&A 245, L13
- Kellermann et al. (1997) Kellermann K.I., Zensus J.A., Cohen M.H. 1997 ApJ, 475, L93
- Kessler et al. (1996) Kessler M.F., Steinz J.A., Anderegg M.E. et al., 1996, A&A 315, L27
- Kotanyi Ekers (1979) Kotanyi C.G., Ekers R.D., 1979, A&A 73, L1
- Krügel et al. (1998) Krügel E., Siebenmorgen R., Zota V., Chini R., 1998, A&A 331, L9
- Lutz et al. (1998) Lutz D., Spoon H.W.W., Rigopoulou D., Moorwood A.F.M., Genzel R., 1998, A&A 505, L103
- Malin et al. (1983) Malin D.F., Quinn P.J., Graham J.A., 1983, ApJ 272, L5
- Packham et al. (1996) Packham C., Hough J.H., Young S. et al., 1996, MNRAS 278, 406
- Quillen et al. (1992) Quillen A.C., de Zeeuw P.T., Phinney E.S., Phillips T.G., 1992, ApJ 391, 121
- Quillen et al. (1993) Quillen A.C., Graham J.R., Frogel J.A., 1993, ApJ 412, 550
- Reynaud Downes (1997) Reynaud D., Downes D., 1997, A&A 319, 737
- Robson et al. (1998) Robson E.I., Leeuw L.L., Stevens J.A., Holland W.S., 1998, MNRAS (in press)
- Rydbeck et al. (1993) Rydbeck G., Wiklind T., Cameron M. et al., 1993, A&A 270, L13
- Sanders Mirabel (1996) Sanders D.B., Mirabel I.F., 1996, ARA&A 34, 749
- Schiminovich et al. (1994) Schiminovich D., van Gorkom J.H., ven der Hulst J.M., Kasow, S., 1994, ApJ 423, L101
- Schreier et al. (1998) Schreier E.J., Marconi A., Axon D.J. et al., 1998, ApJ 499, L143
- Shlosman et al. (1989) Shlosman I., Frank J., Begelman M.C., 1989, Nature 338, 45
- Starck et al. (1996) Starck J.-L., Claret A., Siebenmorgan R., C.E.A. Technical Report, March 1996
- Starck et al. (1998) Starck J.-L., Abergel A., Aussel H., et al., 1998, A&AS 133, (in press)
- Surace et al. (1993) Surace J.A., Mazzarella J.M., Soifer B.T., Wehrle A.E., 1993, AJ 105, 864
- van Dokkum & Franx (1995) van Dokkum P.G., Franx M., 1995, AJ 110, 2027
- Wiklind Combes (1997) Wiklind T., Combes F., 1997, A&A 324, 51
- Wilkinson et al. (1986) Wilkinson A., Sharples R.M., Fosbury R.A., Wallace P.T., 1986, MNRAS 218, 297