Millimetre and submillimetre continuum observations of the core and hotspots of Cygnus-A
Abstract
We present millimetre photometry and submillimetre imaging of the central core and two hotspots in the radio lobes of the galaxy Cygnus-A. For both hotspots and the central core the synchrotron spectrum continues smoothly from the radio to a frequency of 677 GHz. The spectral index of the hotspots is constant over our frequency range, with a spectral index of (S), which is steeper than at lower frequencies and represents the emission from an aged population of electrons. The core is significantly flatter, with , suggestive of an injected spectrum with no ageing, but some evidence for steepening exists at our highest observing frequency. Although data suggest the presence of dust in Cygnus-A, our 450 data show no evidence of cold dust, therefore the dust component must have a temperature lying between 85 K and 37 K, corresponding to dust masses of and M⊙ respectively.
keywords:
radiation mechanisms: thermal – radiation mechanisms: non-thermal – galaxies: individual: Cygnus A – radio continuum: galaxies.1 Introduction
Cygnus-A is locally the most powerful Fanaroff-Riley (FRII) radio galaxy and therefore it is also the best studied in terms of spatial resolution. It has even had an entire workshop devoted to it and global properties of the object are well reviewed in these references (Carilli & Barthel 1996, Carilli & Harris 1996, and Carilli et al. 1998). Cygnus-A has featured prominently in the quest for the unification of powerful radio galaxies and quasars, being cast as the classical case of a quasar in the plane of the sky (Antonnuci & Miller 1985, Barthel 1989). In terms of the synchrotron emission, at low radio frequencies the two giant lobes dominate the emission (Hargrave & Ryle 1974), but at higher frequencies, the hotspots, or working surfaces in the lobes, become more prominent along with the galaxy core. The southern and northern hotspots are respectively and from the core. Using a Hubble constant of 75 km s-1 Mpc-1 and a redshift of (Stockton et al. 1994), Cygnus-A lies at a distance of 227 Mpc.
Deep VLA images reveal the thin jet which transports energy from the AGN core to the radio lobes (Perley, Dreher, Cowan 1984). VLBI observations by Linfield (1984) and other authors, and most recently by Krichbaum et al. (1998), have extended this picture at sub-milliarcsecond resolution. The fact that the electron synchrotron lifetime in the hotspots is less than the light travel time from the central core (Hargrave & Ryle 1974) means that electron re- acceleration must take place in the lobes, and the hotspots are believed to be the working surfaces at which this re- acceleration takes place. Indeed, the prominence of hotspots at the outer edges of the lobes is one of the identifying features of FRII radio sources (Fanaroff & Riley 1974). The precise mechanism for the electron acceleration is uncertain and determination of the synchrotron spectral index is important as it can rule out some potential mechanisms.
For a steady injection model (Bell 1978) a steepening of 0.5 in the index is expected at a certain frequency as the electrons lose energy more rapidly than is being supplied by the acceleration process. At some higher frequency, the electron spectrum will cut-off as the high energy electrons rapidly lose energy and become depleted; this produces the final turnover and steep downturn of the synchrotron emission. The emission from the hot-spots (denoted by A and D in the convention derived from VLA maps, where A is the north-west and D is the south-east hot-spot) has been well observed at a number of radio frequencies (Muxlow et al. 1988, Wright and Birkinshaw 1984, Carilli et al 1991, Salter et al. 1989, Eales, Alexander & Duncan 1989). Both are found to have an excellent power-law spectral index with a coefficient of about between 0.1 GHz to around a few GHz, steepening to an index of at higher frequencies. The break to the higher index occurs at around 10 GHz for both hotspots. The spectral break of 0.5 is indicative of the steady injection model with constant radiative losses.
The spectral shape of the core of Cygnus-A is much less well determined than the hotspots. The general shape is of a power-law, which is self-absorbed below a few GHz, and above which it has an index of around -0.1 but with significant uncertainty (Salter et al. 1989, Eales et al. 1989).
In this paper we present high frequency (150 GHz - 857 GHz) photometry of the hotspots A and D (we see no evidence for a separate component B at our spatial resolution) and the galaxy core. Single-pixel photometry data are given for frequencies of 150 GHz, and 222 GHz, and we present the first submillimetre imaging photometry at frequencies of 353 GHz, 400 GHz, 667 GHz and 857 GHz (corresponding to wavelengths of 2000, 1350, 850, 750, 450, and 350 , respectively).
2 Observations
The imaging and photometry observations were made with SCUBA, the Submillimetre Common-User Bolometer Array (Holland et al. 1998, Robson et al. in preparation) at the Nasmyth focus of the James Clerk Maxwell Telescope on 1997 May 02, Sep 18, Oct 02 and 1998 Feb 14 and 16. SCUBA has a 91 element short-wave (SW) array that is optimized to operate at 450 or 350 and a 37 element long-wave (LW) array that is optimized to operate at 850 or 750 . Both arrays have a 2.3 arcmin instantaneous field-of-view, and the optics are designed such that with a suitable jiggle pattern of the secondary mirror of the telescope, fully sampled maps can be obtained simultaneously at 450 and 850 or 350 and 750 . Using specific single bolometers (eg. the central ones) of the LW and SW arrays and a simpler jiggle pattern, faster photometric mode observations can instead be obtained simultaneously at 450 and 850 or 350 and 750 . Observation were made in this mode only on 1998 Feb 14 in order to go deeper and reduce our errors, especially at 450 . SCUBA also has single element bolometers optimized to operate at 1100 , 1350 and 2000 . All 131 bolometers are cooled to less than 0.1 K making SCUBA limited by the sky background radiation.
For the imaging observations of Cygnus A, the telescope was pointed at the core of the optical galaxy using radio positions from Hargrave & Ryle (1974). The radio hotspots are about 65 arcseconds from the core, thereby nicely fitting within the instantaneous SCUBA field-of-view. The imaging observations employed a 64-point jiggle pattern with a 3 arcsecond offset between each position, thereby giving fully sampled images with both arrays over a period of 128 s (1 integration). Each integration was divided into 4 so that the telescope could be nodded between the signal and reference beam every 16 s. The secondary was chopped in azimuth at 7.8 Hz and with a throw of 120 arcseconds.
For photometry mode observation the telescope was pointed at the radio core position, and at each hotspot using the positions from Salter et al. (1989). Typically the telescope was slewed to the core position and a pointing observation taken to ensure excellent positioning; photometry observations were then made on the core and the hotspots. The photometry observations employed a 9-point jiggle pattern in a 3 by 3 grid of 2 arcsecond spacing taking 9 s on the signal and 9 s on the reference beam. In this case the secondary had a chop throw of 90 arcseconds in azimuth.
For all observations the focus stability was checked every three hours, or more often when there were significant ambient temperature changes. Skydips with SCUBA were performed regularly to measure the atmospheric opacity at the two array wavelengths, while the 225 GHz opacity was monitored continuously from the Caltech Submillimeter Observatory sky monitor (commonly known as CSO taumeter, see Masson 1993) to dictate the frequency of undertaking SCUBA skydips. Flux calibration was taken from planets and the JCMT secondary calibrator list.
The imaging data analysis was undertaken using the dedicated SCUBA data reduction software SURF (Jenness et al. 1998). The data reduction consisted of first flatfielding the array images, and then correcting for atmospheric extinction. Next, sky-noise removal was performed using array bolometers in which there was no source emission. This was usually the bolometers in the first ring for the LW array and the second ring for the SW array. Noisy bolometers and integrations (or subdivisions thereof) were blanked and the images were despiked. The resulting data were calibrated using instrumental gains that were determined from beam maps of Mars or Uranus nightly and in the same observation mode as the target observation. During the 1998 Feb runs, the planets were not available and the JCMT secondary calibrators CRL 618, CRL 2688 and IRC+10216 were used (Sandell 1994; Sandell et al. in preparation).
For the 1350 and 2000 photometry observations no sky-noise removal was done, as the observation used only a single bolometer, and spike removal was performed by clipping the data at a specified sigma. Flux calibration was made by photometry observations of Mars and Uranus.
The results from the imaging and photometry observations are shown in Table 1. The uncertainties are a quadratic sum of the uncertainty arising from the measured signal-to-noise-ratio and a systematic calibration uncertainty, which varies from 10% at 850 and lower, to 27% at 450 .
| Flux density (Jy) | ||||||||||
|---|---|---|---|---|---|---|---|---|---|---|
| UT Date | 2.0 mm | 1.35 mm | 0.85 mm | 0.75 mm | 0.45 mm | |||||
| Core | ||||||||||
| 19980214 | 0.49 | 0.05 | 0.23 | 0.04 | ||||||
| 19980216 | 0.72 | 0.11 | 0.78 | 0.15 | ||||||
| 19971002 | 0.51 | 0.05 | ||||||||
| 19970918 | 1.11 | 0.1 | 0.65 | 0.10 | 0.46 | 0.06 | ||||
| 19970502 | 0.53 | 0.05 | 0.34 | 0.06 | ||||||
| NW Hotspot | ||||||||||
| 19980216 | 2.49 | 0.37 | 1.20 | 0.23 | ||||||
| 19971002 | 0.67 | 0.06 | ||||||||
| 19970918 | 2.07 | 0.20 | 0.95 | 0.14 | 0.57 | 0.08 | ||||
| 19970502 | 0.68 | 0.06 | 0.23 | 0.06 | ||||||
| SE Hotspot | ||||||||||
| 19980216 | 3.54 | 0.53 | 1.76 | 0.33 | ||||||
| 19971002 | 0.81 | 0.08 | ||||||||
| 19970918 | 2.65 | 0.2 | 1.56 | 0.23 | 1.01 | 0.14 | ||||
| 19970502 | 0.95 | 0.05 | 0.43 | 0.07 | ||||||
In addition to SCUBA observations, data were reprocessed using HIRES and SCANPI routines at NASA’s Infrared Processing and Analysis Center (IPAC). The re-reduced 12, 25 and data agree well with previous determinations (Fullmer & Londsdale 1989, Knapp et al. 1990, Golombek, Miley, Neugebauer 1988). There is some disagreement about the 100 value; Golombek et al. (1988) indicated that the upper limit flux density was 1.8 Jy, however Fullmer & Lonsdale (1989) gave significantly different upper limit of 8.3 Jy. The reason for disagreement is because the published upper limits have been determined in different ways. Cygnus-A has a low galactic latitude (), and the flux is contaminated by cirrus (Low et al. 1984). From the HIRES images it is clear that the cirrus contamination is dominant and the true Cygnus A flux at 100 cannot be retrieved from data even with unusually high iterations of HIRES processing. Moreover, photometry on the HIRES images produced a upper limit of 5.1 Jy.
3 Results and Discussion
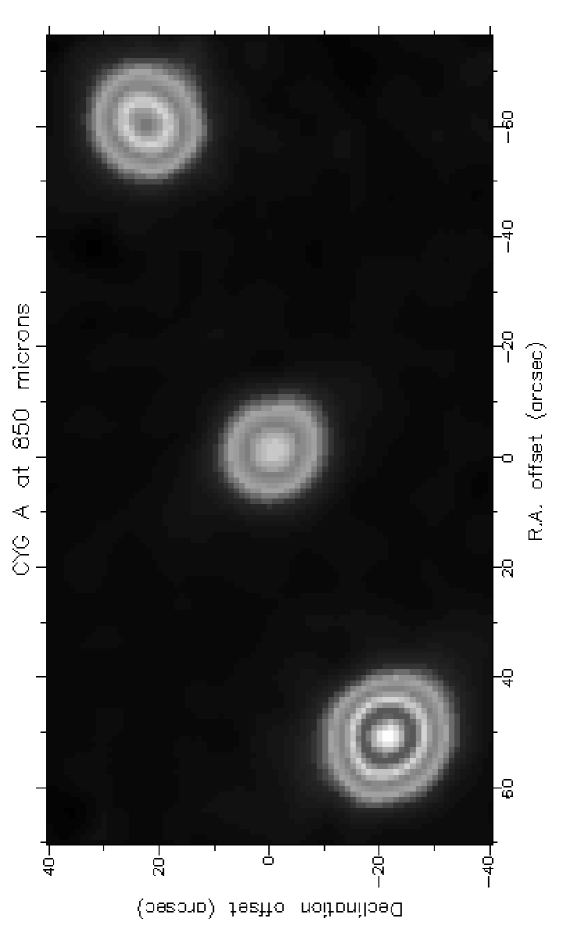
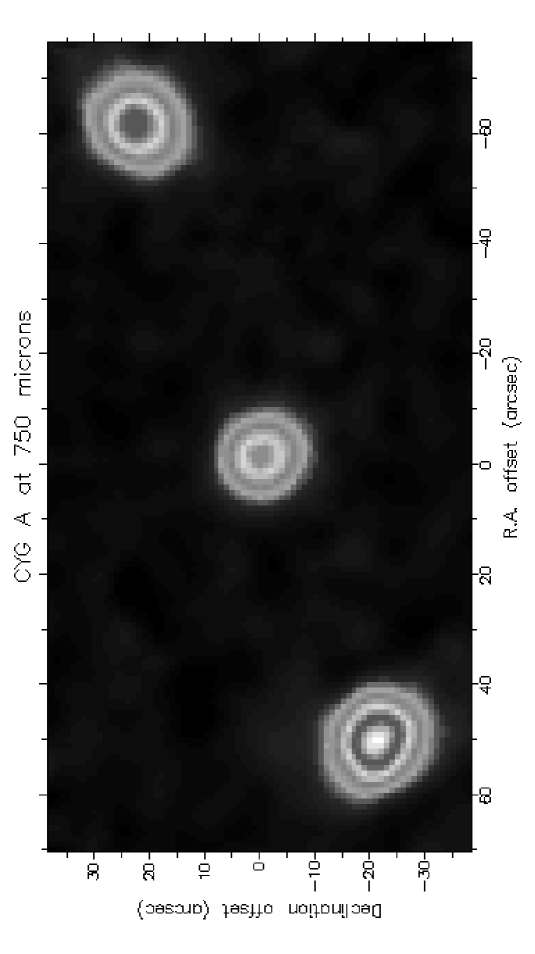
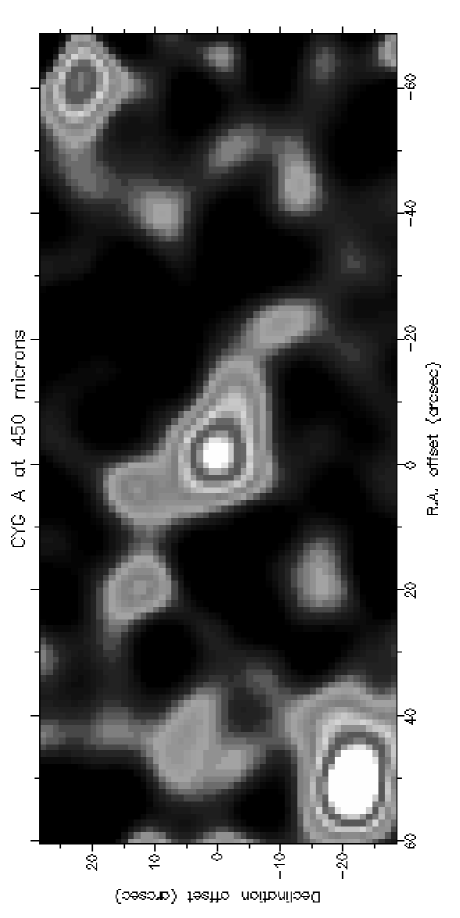
The 850, 750 and 450 SCUBA images (Fig. 1) clearly show the two hotspots and the central core of the galaxy. The rms uncertainties on the maps are 40 mJy, 50 mJy and 85 mJy respectively. No detections were made at 350 and a 430 mJy rms was determined from the map (not shown).
3.1 The hotspots

The spectral energy distribution of the two hotspots is shown in Fig. 2. The SCUBA data points are indicated by asterisks (hotspot A) and stars (hotspot D); the other data points (open and solid circles for hotspots A and D, respectively) are taken from Carilli et al. (1991). The points at 375 GHz (800 ) are from Eales et al. (1989) and are also from the JCMT using the previous single-pixel continuum instrument, UKT14.
The well observed radio synchrotron spectrum is seen to continue smoothly into the submillimetre region with no apparent spectral break. The spectral indexes, , determined from 146 GHz to 667 GHz are: for hotspot A (NW), and for hot-spot D (SE). In all cases . There is no significant evidence for further spectral steepening due to a high energy cut-off in the electron distribution. The excellent determination of an index of close to fits extremely well with the continuous injection of relativistic electrons in the hotspots. The spectral index of the injected electrons of gives support to the origin of the high energy electrons in a shock (Bell 1978).
If we take an equipartition value for the magnetic field in the hotspots of 30nT (Wright & Birkinshaw 1984), the electrons radiating at 800 GHz have an energy of around eV and a synchrotron radiative lifetime of years. For a single central source of the electron acceleration in each hotspot and an electron diffusion rate of the speed of light, the electrons responsible for the 800 GHz synchrotron radiation can, at most, travel a radial distance of 2 kpc. Interferometer measurements at 89 GHz (Wright & Birkinshaw 1984) reveal that the hotspots are spatially resolved and are between 2 and 3 kpc in size. Therefore if the hotspots are the same size at 800 GHz, there is barely adequate time for the highest energy electrons to fill the volume even with a diffusion speed of order c. If the speed is substantially less than c, then multiple acceleration sources (shocks) are required in order to explain the observations. To test this hypothesis further requires better determination of the magnetic field and interferometer measurements at 800 GHz. These will be possible with the introduction of the Submillimeter Wavelength Array (Moran 1996) on Mauna Kea around 2000.
3.2 The core component
A power-law spectral index of has been determined between 146 and 677 GHz for the core. This is much steeper than determined by Wright & Birkinshaw (1984) and Salter et al. (1989) respectively between 10 and 89 GHz and 89 and 230 GHz. Indeed, given the quality of the data it is not clear whether a power law (rather than a smoothly curving function) is, in fact, the best fit to the data. On the other hand, in the unification scenario we suspect the radio-core of Cygnus-A to be a severely misaligned jet and therefore the spectrum to be typical of an unboosted blazar jet spectrum. These have been observed in the millimetre to submillimetre (Gear et al. 1994), so we assume that a power-law is the simplest interpretation. In this case there is tentative evidence for some steepening above 600 GHz, but the data are inadequate to determine whether this is the 0.5 break of a continuous injection model, or, whether it is the onset of depletion of high energy electrons. Further observations are underway to answer this question.
The measurements clearly suggest thermal emission from dust in the central galaxy, although the temperature and hence mass of the emitting dust are very uncertain from the values alone. The new submillimetre data points constrain the non-thermal contribution to the (and the much awaited ) fluxes. In particular the 667 GHz measurement, constrains the temperature of emitting dust to within a factor of two. Preliminary data (Polletta, private communication) at suggests that the dust temperature may be K (which is well within our constraints – see below). However, this data point still has a large calibration uncertainty at the current time and is not included in the present discussion.
3.3 Cold dust in Cygnus-A?

Assuming a reasonable value for the dust emissivity index, , of 1.3, the maximum temperature that appears to fit the data is 85K, while the lower temperature is constrained by the SCUBA measurement at 450 microns to 37K. Fig. 3 shows both these temperatures. Changing between 2.0 and 1.0 makes very little difference to the derived temperatures. The mass of emitting dust can then be derived from a simple model adapted from Hildebrand (1983), where
| (1) |
and is the measured flux, the distance to the source, the Planck function and the grain mass absorption coefficient where and are respectively given by the grain radius and density. In the far-infrared and submillimetre, is not well defined since it depends primarily on the uncertainty of the grain emission efficiency, (Draine 1990). We assume values of and , which yield dust masses of for K and for K.
Hughes et al. (1994) estimated the dust mass within the inner 1kpc of the nucleus of the starburst galaxy M82 to be between and for TK & TK respectively. The minimum estimated 85 K dust mass in Cygnus-A is remarkably close to this, and, though only a tantalising hint, suggests Cygnus-A core properties are similar to those of classical nuclear starburst galaxies. However, our upper limit to the dust mass for Cygnus-A is considerably higher than the dust mass in M82, even when considering the mass contribution seen in the low brightness flux outside the inner 1kpc of the nucleus, which is measured to be no more than 10% of the nuclear mass (Leeuw et al. in preparation, Hughes et al. 1994).
From our deep images of the extended dust emission in M82 (Leeuw et al. in preparation), we can safely say that if we move M82 to the distance of Cygnus-A, the emission is unresolved in the SCUBA beams. Our recently obtained deep SCUBA images of the star forming galaxy Arp220 (at 76Mpc) are also unresolved.
Our upper limit for the dust mass in Cygnus-A is comparable to the dust masses for Arp220 and another star forming galaxy NGC6240, which are 4.5 and respectively (Klaas et al. 1997). The comparison is interesting because, from unusually high hot molecular gas emission (), Ward et al. (1991) likened the core of Cygnus-A to Arp220 and NGC6240. At the same time, Ward et al. (1991) noted that the implied mass of the hot molecular gas led to mass ratio upper limit of hot-cold that was not unusual in AGN. We note that while the lower and upper dust mass limits for Cygnus-A are, respectively, comparable to the nuclear starburst galaxies M82 and the extranuclear starburst galaxies Arp220 and NGC6240, the upper dust mass limit is also similar to the masses for the Radio Quiet Quasars IZw1, Mrk1014 and Mrk376, which are 7.6, and respectively (Hughes et al. 1993). SCUBA observations at will provide better constraint on this upper limit and perhaps clarify the role of dust in models of the Cygnus-A core.
4 Summary
We have made detailed photometric and imaging observations of the two hotspots and the radio core of Cygnus-A. The spectral index of the hotspots extends smoothly to about 677 GHz with no evidence of spectral steepening. If the diffusion speed for the electrons responsible for this emission is about c, then a single particle acceleration mechanism can be responsible for the hotspot synchrotron emission. On the other hand, if the diffusion speed is significantly less than c, then multiple acceleration locations are probably required unless the magnetic field strength is significantly less than the equipartition value. Future observations using submillimetre interferometers should narrow-down the parameter space in terms of the size of the emitting region.
The radio core has a much flatter spectral index, more indicative of a relativistic jet, and as such could be the standing shock at the entrance of the parsec-scale jet. There is some evidence for spectral steepening, perhaps suggesting that at these energies, the lifetime of the radiating particles is sufficiently short that there is inadequate replenishment available. There is no evidence for thermal emission from dust at the highest frequency of 667 GHz and this, along with re-reduced data restrict the temperature of the emitting dust to between 37K and 85K, with corresponding dust masses of and . The lower dust mass limit is comparable to the nuclear starburst galaxy M82 and the upper limit to the extranuclear starburst galaxies Arp220 and NGC6240 as well as the Radio Quiet Quasars IZw1, Mrk1014 and Mrk376.
Acknowledgments
LLL thanks the University of Central Lancashire for a full-time research studentship. The JCMT is operated by the Joint Astronomy Centre, on behalf of the UK Particle Physics and Astronomy Research Council, the Netherlands Organization for Scientific Research and the Canadian National Research Council. This research has made use of HIRES and SCANPI routines at NASA/IPAC which is operated by the Jet Propulsion Laboratory, Caltech, under contract to the National Aeronautics and Space Administration.
References
- [1] Antonucci R.R.J., Miller J.S., 1985, ApJ, 297, 621
- [2] Barthel P.D., 1989, ApJ, 336, 606
- [3] Bell A. R., 1978, MNRAS, 182, 443
- [4] Carilli C.L., Perley R.A., Dreher J.W., Leahy J.P., 1991, ApJ, 383, 554
- [5] Carilli C.L., Barthel P.D., 1996, A&AR,7,1
- [6] Carilli C.L., Harris D.E. (editors), 1996, Cygnus A: Study of a Radio Galaxy, Cambridge Univ. Press, Cambridge
- [7] Carilli C.L., Perley R., Harris D.E., Barthel P.D., 1998, Physics of Plasmas, 5, 1981
- [8] Draine B.T., 1990, in Thronson H.A., Shull J.M., eds. Proc Vol 161, The Interstellar Medium in Galaxies, Kluwer, Dordrecht, 483
- [9] Eales S., Alexander P., Duncan W.D., 1989, MNRAS, 240, 817
- [10] Fanaroff B.L., Riley J.M., 1974, MNRAS, 167, 31
- [11] Fullmer L., Lonsdale C., 1989, Cataloged Galaxies and Quasars Observed in the IRAS Survey, Jet Propulsion Laboratory, Pasadena
- [12] Gear W.K. et al. 1994, MNRAS, 267, 167
- [13] Golombek D., Miley G.K., Neugebauer, G., 1988, AJ, 95, 26
- [14] Hargrave P.J., Ryle M., 1974, MNRAS, 166, 305
- [15] Hildebrand R.H., 1983, QJRAS, 24, 267
- [16] Holland W. S., Cunningham C. R., Gear W. K., Jenness T., Laidlaw K., Lightfoot J. F., Robson E. I., 1998, in Phillips T.G., eds, Proc SPIE vol. 3357, in press
- [17] Hughes D.H., Robson E.I., Dunlop J.S., Gear W.K., 1993, MNRAS, 263, 607
- [18] Hughes D.H., Gear W.K., Robson E.I., 1994, MNRAS, 270, 641
- [19] Jenness T., Lightfoot J.F., Holland W.S., 1998, in Phillips T.G., eds, Proc SPIE vol. 3357, in press
- [20] Klaas U., Haas M., Heinrichsen I., Schulz B., 1997, A&A, 325, L21
- [21] Krichbaum T.P., Alef W., Witzel A., Zensus J.A., Booth R.S., Greve A., Rogers A.E.E, 1998, A&A, 329, 873
- [22] Knapp G.R., Bies W.E., Gorkom J.H., 1990, AJ, 99, 476
- [23] Linfield R.P., 1984, ApJ, 295, 463
- [24] Low F.J. et al. 1984, ApJ, 278, L19
- [25] Masson C., 1993, in Ishiguro M., Welch W.J., eds. ASP Conf. Ser. Vol. 59, Astronomy with Millimeter and Submillimeter Wave Interferometry, Astron. Soc. Pac., San Francisco, 87
- [26] Moran J.M., 1996, A&AS, 188, 4605
- [27] Muxlow T.W.B., Pelletier G., Roland J., 1988, A&A, 206, 237
- [28] Perley R.A., Dreher J.W., Cowan J.J, 1984, ApJ, 285, L35
- [29] Salter C.J. et al. 1989, A&A, 220, 42
- [30] Sandell G., 1994, MNRAS, 271, 75
- [31] Stockton A., Ridgeway S.E., Lilly S.J., 1994, AJ, 108, 414
- [32] Ward M.J., Blanco P.R., Wilson A.S., Minoru N., 1991, ApJ, 382, 115
- [33] Wright M., Birkinshaw M., 1984, ApJ, 281, 135