GAMMA RAY BURSTS HAVE MILLISECOND VARIABILITY
Abstract
We have performed searches for isolated flares and for steady flickering in Gamma Ray Burst light curves on the microsecond to millisecond time scales. Two bursts out of our sample of 20 revealed four isolated flares with time scales from to . A wavelet analysis for our sample showed low level flickering for all bursts on time scales from to 33 ms, with the majority of bursts containing rise times faster than four milliseconds and 30% having rise times faster than one millisecond. These results show that millisecond variability is common in classical bursts and not some exceptional activity by a possibly separate class of bursts. These fast rise times can be used to place severe limits on burst models: (1) The characteristic thickness of the energy generation region must be less than 1200 km along the line of sight. (2) The angular size of the gamma ray emission region as subtended from the central source must be less than 42 arc-seconds. (3) The expanding ejecta must have a range of Lorentz factors along a radius line with a dispersion of less than roughly 2%. (4) Within the external shock scenario, the characteristic dimension of the impacted cloud must be smaller than 16 Astronomical Units on average. (5) Within the collimated jet scenario, the collimation angle must be smaller than 42 arc-seconds.
1 Introduction
What is the shortest time scale of intensity variations in Gamma Ray Bursts (GRBs)? This is an important question because this time scale can be used to place an upper limit on the size of the gamma ray emitting region. Historically, the rise time in the 5 March 1979 event was used to place a limit of (Cline et al. 1980), although we now know that this event was from a ‘galactic’ Soft Gamma Repeater and hence irrelevant for cosmological GRBs. Nevertheless, the basic argument remains in force for classical GRBs, with durations in the Konus catalog (Mazets et al. 1981), and it provided one of the strong reasons to consider neutron stars in burst models.
Since the launch of the Compton Gamma Ray Observatory, the Burst and Transient Source Experiment (BATSE) provides sufficient photons and time resolution to push a variability search to short time scales. Bhat et al. (1992) demonstrated that GRB910711 has a total duration of , although the claimed 0.2 ms spike detected in one BATSE detector is dubious since it is only 3- in significance with many trials and since the spike is not present in other BATSE detectors that should have seen it. Nevertheless, this event and others in the BATSE catalog with durations as short as 0.034 s (Fishman et al. 1994) show that some bursts have flares with durations as short as . Mitrofanov (1989) suggested that bursts were composed of microsecond flares such that dead time and pulse pile-up effects would greatly change burst demographics, but correlations between arrival times for photons in separate detectors shows that this possibility is not realized (Schaefer et al. 1992). Similarly, with H. A. Leder, we have shown that photon energies are uncorrelated on microsecond time scales, so that burst flux can have only a small fraction of short duration blackbody emission. Deng & Schaefer (1997) did not find any coherent periodicities from and 33 ms in 20 of the brightest bursts. Schaefer & Walker (1998) have discussed a spike in GRB920229 that has an e-folding rise time of , a decay time of , a significant spectral change over a time of , and a sharp spectral continuum feature over a fractional energy range of 18%.
The above results show that rare bursts can have light curve structure on time scales of or even 0.22 ms. But how exceptional are these fast varying bursts? Are the rapid bursts a separate class whose limits cannot be applied to ordinary bursts? And what is the fastest time scale for ordinary bursts? In this paper, we report on two separate searches for rapid variability in GRBs. In the first search, we tested 20 bright bursts for the presence of isolated flares on time scales from . In the second search, we use Haar wavelet transforms to evaluate the flickering activity in burst light curves on time scales from to 0.13 seconds.
2 Isolated Flares
One of the possible modes by which bursts can display rapid variability is to have isolated flares. These might occur on any time scale and might be most prominent in either hard or soft photons. Giles (1997) offers a reliable and efficient algorithm for searching a light curve for significant peaks. In essence, his algorithm calculates a running mean and then seeks a significant deviation above this mean. This algorithm searches through light curves which are successively binned by factors of two, so that we have tested light curves with bin sizes of , , , , , and . Our threshold is set such that a flare would have to be more significant than after accounting for all the trials in a single burst. We have modified this algorithm to reduce the size of the window used in the running average so as to minimize the effect of curvature in the overall shape of the light curve.
This isolated flare search was performed on BATSE TTE data, which is perfect for rapid variability searches. The TTE data records the arrival time (within a time bin) and energy (within four discriminator channels) of each photon. The energy boundaries of channels 1 through 4 are roughly 25-50, 50-100, 100-300, and keV. The on-board memory records only up to 32768 photons around the time of the BATSE trigger. Typically, this quota of photons is used up in one or two seconds, which can only cover the leading portion of a long duration burst. For short bursts, the entire episode might be in the TTE data, along with substantial times of only background light after the burst. The time-tagged events are continuously written into a rotating memory so that TTE data is usually available for a fraction of a second before the BATSE triggers. For times before the trigger, photons from all eight BATSE modules are recorded, although we have only used photons from triggered detectors. The pulse pile-up time is and the dead time is .
Our isolated flare search was performed on 20 of the brightest BATSE bursts (see Table 1). These were chosen for the number of burst photons recorded in the short time interval during which TTE data is available. Our set of bursts is a mixture of short intense bursts with fast variability completely covered by the TTE data and the brightest bursts of ordinary duration with high numbers of burst photons during the TTE data. The columns of Table 1 gives the GRB name, the BATSE burst trigger number, the peak flux from 50-300 keV over a 64 ms time bin, the T90 burst duration, the duration of the TTE data, and the average count rate in time bins. We performed the tests on three separate light curve sets; with channels 1+2+3+4, channels 1+2, and channels 3+4. Our search found only four significant flares in two bursts out of our sample of 20 bright GRB light curves.
Our first burst with flares is the extremely bright GRB930131. This burst has an initial spike (with duration ) composed of two main peaks (each with duration ) for which the first main peak has two flares (of total durations and ) visible only at the highest energies. In channels 3+4, the light curve triggered on the time scale for each of the two flares on the first main peak. The fast variations in this flare are primarily in channel 4, while channels 1 and 2 have no corresponding variations (see Figure 1c of Kouveliotou et al. 1994). The spectrum of these flares are exceptionally hard.
Our second burst with flares is GRB920229. This short burst has a 0.19 s duration, consisting of a smooth time-symmetric pulse followed by a spike with duration of roughly 0.003 s. Within the spike, on the time scale, our flare search triggered on a flare near the end (at our usual threshold) as well as a flare near the beginning (although only at the confidence level after allowing for all the trials associated with our search for this one burst). The e-folding rise time of this spike is , the e-folding fall time is , while the spectrum significantly softens over a time interval during the spike’s fall. The background subtracted count rate for the entire burst for channels 1, 2, 3, and 4 are 730, 1630, 2490, and 120 photons, which demonstrates a sharp spectral break around the energy boundary between channels 3 and 4. Detailed spectroscopy shows the spectrum has a peak at 200 keV with no significant flux above 239 keV, for a sharpness of . These observations are presented in detail in Schaefer & Walker (1998).
This systematic study of 20 bright bursts shows that isolated flares of large amplitude are not common on the two millisecond time scale or faster.
3 Flickering
Another possible mode by which bursts can display rapid variability is to have many small amplitude flares flickering quietly. This would just be an extension of the flickering seen on longer time scales as part of the multiple pulses forming the overall shape of many light curves. What is the shortest time scale on which bursts flicker? Short duration flickers must fall below the thresholds already established by our isolated flare search, and this implies that the flickers are either isolated and of low relative amplitude or crowded together so that many flickers are bright at any one time.
If the low amplitude flares recur repeatedly, then there should be statistical evidence for the burst showing fluctuations above that expected from Poisson noise alone. One means to test for frequent low level fluctuations is a wavelet analysis. Wavelets are a set of mathematical functions that form an orthonormal basis which can readily describe short duration events (Scargle 1997, Daubechies 1992). Wavelets have already been used for analysis of GRBs on long time scales by Norris et al. (1994) and Kolaczyk (1997).
In particular, we have used the simple Haar wavelet, which is an antisymettric function consisting of one bin negative and the next bin positive with all other bins being zero. For a given bin size, the wavelet activity is defined as the average of the squares of the product between the Haar wavelet and the light curve for all relative offsets. To be quantitative, the Haar wavelet activity is equal to , where is the counts in the ‘ith’ time bin of the light curve and the angular brackets indicates an average over all values of i. As such, the activity is a measure of the rise and fall times present in the light curve. For normal Poisson variations alone, the expected activity level is . In practice, the observed value is slightly different due to dead time effects and the overall modulation of the light curve on long time scales. The RMS scatter of the Poisson activity is where N is the number of time bins in the light curve. Our normalized activity is the ratio between the observed activity and that expected for Poisson variations alone.
The normalized activity is calculated for light curves with bin sizes varying by factors of two from to 0.131 s. In general, this number is around unity for short bin sizes and it starts to rise significantly for some time scale which we identify as the shortest time scale of variability. From studies of simulated data, we find that the overall envelope of variability on long time scales does not produce activity on short time scales. The existence of this shortest time scale of variability does not imply either that all variations are on that time scale nor that the fast variations have high amplitude. Rather, there appears to be a continuum of variations ranging from large amplitude pulses of long duration to smaller pulses of short duration.
From studies of background data and of simulated data, we find that the normalized activity varies with a one- scatter from 0.7% to 3.0% for values from 0.5 to 2.0. This allows us to place a confident limit on the shortest time scale of variability as the bin size in which the normalized activity is three- above the Poisson level (). Such time scales for each burst are tabulated in Table 2.
For GRB930131 and GRB920229, we recover the fast variations in the flares as . We find no significant correlation between and either or . These facts indicate that the normalized activity is indeed a measure of the shortest time scale of variability in a manner that is independent of brightness and duration.
What is the fractional amplitude of these flickers? Let be the observed normalized activity, be the variance in the light curve due to flickering, and be the variance in the light curve due to normal Poisson fluctuations; then . The variance of the flickering is the square of the RMS amplitude for flickering in counts, . The variance from Poisson fluctuations equals the average number of counts in the each bin of the light curve, , which can be found by scaling from the values in Table 2. Table 2 also lists the observed values of for the 33 ms light curve. The fractional amplitude of the flickers is then . For the threshold time scales , and counts, so the flickers are in amplitude.
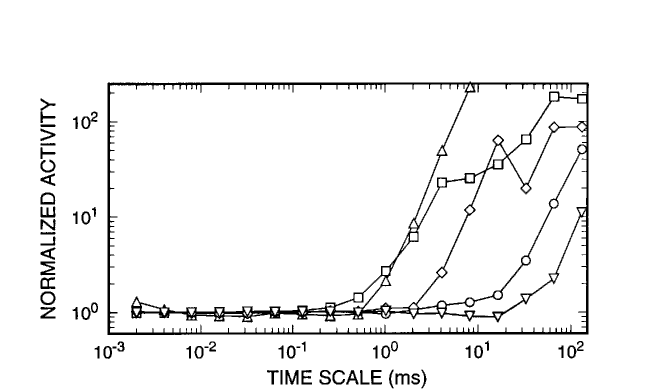
Figure 1 displays the normalized activities as a function of the bin size for five bursts. In these bursts and in all our 20 bright bursts, the normalized activity is around unity for time scales less than , and then rises sharply above .
In some cases, the activity does not rise monotonically with time scale, for example the peak at 0.016 s for GRB930905 in Figure 1. The time scale of these local maxima in normalized activity is , as tabulated in Table 2. From our sample, we find significant peaks for seven bursts, with ranging from 8.2 ms up to our highest observable value of 66 ms. While it is possible that these peaks arise from flickers that have a characteristic rise time, we believe that the peaks are caused by single flares of large amplitude which contribute much activity on the time scale of their rise time. Indeed, with one exception (GRB930506, for which the peak has a small ), the values can be linked to a single specific rise with the same time scale.
While our isolated flare search measured durations, our wavelet activity search measured rise and fall times. For several reasons we believe that our values are essentially rise times. First, the values for six bursts have been identified with particular rises. Second, the values for GRB920229 and GRB930131 correspond to specific rises in the light curve which are times faster than any significant fall. Third, in general, bursts always display a substantially faster rise than fall (Barat et al. 1984, Nemiroff et al. 1994).
Out of our 20 bright bursts, the range of is from to 33 ms, with a median value of four milliseconds and 30% with activity at one millisecond or faster. So we conclude that most burst light curves contain rises with a time scales of order a millisecond.
4 Implications
We have shown that the majority of GRBs have flickering with rise times faster than four milliseconds, while individual flares can vary with rise times as fast as . Thus, millisecond variability is common in bursts, and not just a rare phenomenon restricted to some special and possibly distinct class.
The rise and fall times measured by the wavelet activity can be used to place limits on GRB models. Based on the recent discoveries of low energy counterparts (Costa et al. 1997, van Paradijs et al. 1997, Frail et al. 1997, Metzger et al. 1997) and detailed successful models (Mészáros & Rees 1997), bursts are now generally thought to be relativistically expanding fireballs at cosmological distances. The Lorentz factor of the expansion is generally thought to be from 100 to 1000 so as to explain the GeV photons seen in some bursts (Harding & Baring 1994). Within this basic scheme, pulse durations and fall times can limit fireball properties (Fenimore, Madras, & Nayakshin 1996;FMN) as can the rise times. The model constraints will depend on the particular scenario invoked, but some general arguments can use the rise times to constrain fireball properties independent of the specific scenario.
The first constraint is that the size of the central engine is limited to . Within fireball models, the initial uncollimated flow will result in a density gradient at the front edge of the expanding shell with a width equal to the light travel time across the emission region. For external shock scenarios, the fuzziness of the shell will result in emission starting to rise when the leading edge first hits the stationary cloud while the peak comes later when the bulk of the shell hits the cloud. For internal shock scenarios, the constraints will only be stricter since the outer shell is also moving. So the energy generation volume must have a typical thickness of smaller than 1200 km for the majority of bursts. A narrowly collimated jet scenario might be able to substantially violate this limit.
The second constraint is on the physical dimension in the direction perpendicular to the expansion of the shell. The arrival time for photons from a single shell will be the travel time of the shell to the radius of impact plus the travel time of the gamma ray to Earth. As the shell expands at very close to light speed, the delay is purely geometrical, with photons from off-axis regions being delayed compared to photons from on-axis regions. The observed delay depends only on the radius of the shell at the time of impact with the cloud (R) and the angular radius of the gamma ray emission region as subtended from the burst site (). At a typical off axis angle such as , the rise time will be close to . The shell has been expanding for at least the time from the start of the burst until the time of the rise (), so (FMN). Then, . For the bursts in our sample, , , and , we find that radians or arc-seconds. Due to self shadowing, Earth can only see a ‘cap’ of the shell which subtends an angle , so the individual emission region associated with the rises substends only small region of the cap ( arcseconds). This is in contrast to the total fraction of the shell which becomes active, (Fenimore et al. 1998). This demonstrates that either the shell or the impacted cloud is very fragmented.
The third constraint is on the velocity dispersion within a single individual emitting region. Based on the precedent of supernova shells, we expect there should be a substantial range of velocities within a shell, with the fast moving material sorting itself to the front and the slow moving ejecta in the rear. For the external shock scenario, the flare will start to brighten when the leading edge hits the cloud and will peak when the bulk of the shell hits the cloud, resulting in a measurable rise time. Let be the Lorentz factor for the densest layer of the shell, with the difference in Lorentz factor between densest layer and the leading edge of the shell. To account for the observed rise time, the fractional dispersion in Lorentz factors () within an emitting region must be less than . For the majority of bursts, the dispersion is for the emitting regions. In contrast, the range of ’s associated with the different emitting regions can have a large dispersion, more than a factor of 2 (see Fenimore et al. 1998).
The fourth constraint is on the size scale of the impacted cloud along the line of sight within the external shock scenario. For a thin shell, the gamma radiation will start when the shell sweeps across the inner boundary of the cloud while the peak flux will be produced when the shell sweeps across the center (or densest region) of the cloud. The characteristic dimension for the structure of the cloud must be smaller than since the shock is going at near light speed (FMN). For the average rise time of 4 ms and , the typical cloud size must be smaller than 16 AU.
The main conclusion from our research is that the majority of GRBs contain rises faster than four milliseconds in their light curves, and this places severe limits on burst scenarios. In particular, the size of the central engine region must be typically smaller than 1200 km. The individual gamma ray emitting region must be quite small (subtending only about 42 arc seconds). There can only be a small dispersion of factors within the individual emitting regions.
References
- (1) Barat, C. et al. 1984, ApJ, 285, 791
- (2) Bhat, P. N. et al. 1992, Nature, 359, 217
- (3) Cline, T. L. et al. 1980, ApJ, 237, L1
- (4) Costa, E. et al. 1997, Nature, 387, 783
- (5) Daubechies, I. 1992, Ten Lectures on Wavelets (Philadelphia: Capital City Press)
- (6) Deng, M. & Schaefer, B. E. 1997, ApJ, 491, 720
- (7) Fenimore, E. E., Madras, C. D., & Nayakshin, S. 1996, 473, 998 (FMN)
- (8) Fenimore, E. E., Cooper, C., Ramirez, E., Summer, M. C., Yoshida, A., & Namiki, M., 1998, ApJ, in press (astro-ph/9802200)
- (9) Fishman, G. J. et al. 1994, ApJSupp, 92, 229
- (10) Frail, D. A. et al. 1997, Nature, 389, 261
- (11) Giles, A. B. 1997, ApJ, 474, 464
- (12) Harding, A. K. & Baring, M. G. 1994, in Gamma-ray Bursts, ed. G. Fishman et al. (New York; AIP 307), 520
- (13) Kolaczyk, E. D. 1997, ApJ, 483, 34
- (14) Kouveliotou, C. et al. 1994, ApJ, 422, L59
- (15) Mazets E. et al. 1981, Ap&SS, 80, 3
- (16) Metzger, M. R. et al. 1997, Nature, 387, 476
- (17) Mészáros, P. & Rees, M. J. 1997, ApJ, 476, 232
- (18) Mitrofanov, I. G. 1989, Ap&SS, 155, 141
- (19) Nemiroff, R. J. et al. 1994, ApJ, 423, 432
- (20) Norris, J. P. et al. 1994, ApJ, 424, 540
- (21) Scargle, J. 1997, in Applications of Time Series Analysis in Astronomy and Metrology, Chapman & Hall, p. 226
- (22) Schaefer, B. E. et al. 1992, ApJ, 404, 673
- (23) Schaefer, B. E. & Walker, K. C. 1998, ApJ, submitted
- (24) van Paradijs, J. et al. 1997, Nature, 386, 686
| GRB | Trigger | () | (s) | TTE duration (s) | |
|---|---|---|---|---|---|
| 910503 | 143 | 52 | 50.8 | 0.89 | 0.98 |
| 910609 | 298 | 56 | 0.45 | 1.10 | 0.69 |
| 910627 | 451 | 17 | 15.2 | 1.50 | 0.55 |
| 910718 | 551 | 5.6 | 0.25 | 0.94 | 0.71 |
| 911109 | 1025 | 18 | 2.62 | 1.34 | 0.59 |
| 911202 | 1141 | 9.3 | 20.1 | 1.50 | 0.54 |
| 920229 | 1453 | 12 | 0.19 | 1.42 | 0.61 |
| 920622B | 1664 | 10.5 | 3.52 | 1.78 | 0.46 |
| 920718 | 1709 | 14 | 3.46 | 0.85 | 0.99 |
| 920720 | 1711 | 22 | 5.95 | 0.73 | 1.11 |
| 921022 | 1997 | 40 | 60.2 | 0.78 | 0.91 |
| 930131 | 2151 | 168 | 19.2 | 0.078 | 10.97 |
| 930506 | 2329 | 43 | 22.1 | 1.49 | 0.55 |
| 930706 | 2431 | 44 | 2.78 | 0.54 | 1.61 |
| 930905 | 2514 | 28 | 0.20 | 0.66 | 1.35 |
| 930922 | 2537 | 27 | 4.80 | 0.56 | 1.43 |
| 931031 | 2611 | 35 | 12.2 | 0.65 | 1.27 |
| 950211 | 3412 | 55 | 0.068 | 1.17 | 0.80 |
| 950325B | 3480 | 22 | 9.1 | 0.43 | 2.07 |
| 950503 | 3537 | … | 0.40 | 2.22 |
| GRB | (ms) | (33ms) | |
|---|---|---|---|
| 910503 | 2.0 | … | 3.5 |
| 910609 | 1.0 | … | 250 |
| 910627 | 33 | … | 1.4 |
| 910718 | 1.0 | … | 65 |
| 911109 | 16 | … | 2.6 |
| 911202 | 33 | … | 1.14 |
| 920229 | 0.26 | … | 65 |
| 920622B | 4.1 | … | 3.7 |
| 920718 | 33 | … | 1.8 |
| 920720 | 4.1 | … | 4.2 |
| 921022 | 0.51 | 33 | 477 |
| 930131 | 1.0 | … | … |
| 930506 | 8.2 | 8.2 | 1.17 |
| 930706 | 4.1 | 66 | 8.9 |
| 930905 | 1.0 | 16 | 20 |
| 930922 | 4.1 | … | 34 |
| 931031 | 16 | 66 | 10.3 |
| 950211 | 4.1 | 66 | 330 |
| 950325B | 8.2 | … | 9.4 |
| 950503 | 2.0 | 33 | 110 |