A GAMMA RAY BURST WITH A 220 MICROSECOND RISE TIME AND A SHARP SPECTRAL CUTOFF
Abstract
The Gamma Ray Burst GRB920229 has four extreme and unprecedented properties; a rise in brightness with an e-folding time scale of , a fall in brightness with an e-folding time scale of , a large change in spectral shape over a time of , and a sharp spectral cutoff to high energies with . The rapid changes occur during a spike in the light curve which was seen 0.164 s after the start of the burst. The spectrum has a peak at 200 keV with no significant flux above 239 keV, although the cutoff energy shifts to less than 100 keV during the decay of the spike. These numbers can be used to place severe limits on fireball models of bursts. The thickness of the energy production region must be smaller than , ejected shells must have a dispersion of the Lorentz factor of less than roughly along a particular radius, and the angular size of the radiation emission region is of order 1 arc-minute as viewed from the burst center. The physical mechanism that caused the sharp spectral cutoff has not been determined.
1 Introduction
The fast varying brightness has historically provided the key justification for the compact size of the Gamma Ray Burst (GRB) emitting region. The idea is that objects will not significantly change in brightness on time scales faster than the light crossing time of the emitter. Significant variations on time scales as short as were apparent in early data, with the implication that the emitter is smaller than , with the further natural suggestion that neutron stars are involved somehow.
With recent observational discoveries (Costa et al. 1997, van Paradijs et al. 1997, Frail et al. 1997, Metzger et al. 1997) and theoretical models (Mészáros & Rees 1997), the general picture for GRBs now involves a relativistically expanding fireball at cosmological distances. The relation between the observed time scale of brightness changes and the physical size of the emission region is now more complicated, and depends in detail on the scenario for emission (Fenimore, Madras, & Nayakshin 1996; FMN).
The typical upper limit on the size of the emitting region is , where is the Lorentz factor for the fireball expansion and is the time scale of variations(FMN). Based on the escape of MeV and GeV photons from the majority of bursts detectable by EGRET, the value of is generally taken to be from roughly 100 to 1000 (Harding & Baring 1994). Not all bursts have high energy photons (GRB920229 in particular) and so are not required to have the high values; but it is economical of hypothesis to apply these limits to all bursts without creating special classes.
So what is the fastest time scale for GRB brightness changes? The fast rise for SGR790305 (Cline et al. 1980) was a strong influence on the field in the 1980’s, but it is now realized to apply to the separate class of Soft Gamma Repeaters. Deng & Schaefer (1997) have unsuccessfully searched for coherent pulsations with periods between and , while Schaefer et al. (1992) has proven that microsecond flares do not dominate the emission as proposed by Mitrofanov (1989). With H. A. Leder, we have shown that the BATSE data for 20 bright bursts has no correlation between energies for photon pairs separated by times from to 10 ms. Bhat et al. (1992) reported on a burst with a total duration of 8 ms, although the claimed 0.2 ms duration flare visible in only one BATSE module has problems since it is only a detection and it is not visible in three other detectors which should have shown the flare. Nevertheless, this event and others in the BATSE catalog (Fishman et al. 1994) with durations as short as 34 ms, show that the time scales for significant variations must be as short as a few milliseconds.
We have been systematically searching through the BATSE data to find the fastest time scale of variation. The fastest time scale we found is for GRB920229, which has a rise time of and a fall time of (Section 2). During the fast fall, the burst spectrum changed significantly on a time scale of (Section 3). In addition, this same burst has a unique spectrum, with a sharp spectral cutoff (Section 4). We show that these properties can strongly limit the fireball properties (Section 5).
2 Fast Brightness Variations
Our search for rapid variability was made with the algorithm of Giles (1997), which is designed for the detection of infrequent rapid flares in a light curve. We used data from the BATSE Large Area Detectors (LADs), each module of which has a frontal area of . Our variability search has focused on 20 of the brightest BATSE bursts, since only these will have the number of photons required to detect submillisecond variations.
We have been using the TTE data type from the BATSE LADs, which has each photon individually tagged as to time and energy. The time is given to a resolution of , which is good for rapid variability studies. The energy is given to within one of four discriminator channels with energy ranges of roughly 25-50, 50-100, 100-300, and keV (channels 1 through 4 respectively). The pulse pile-up time is and the dead time is . The on-board memory will store up to 32768 individual photons, which usually allows for only the first few seconds of the time history to be so recorded, often including substantial portions of the pretrigger light curve.
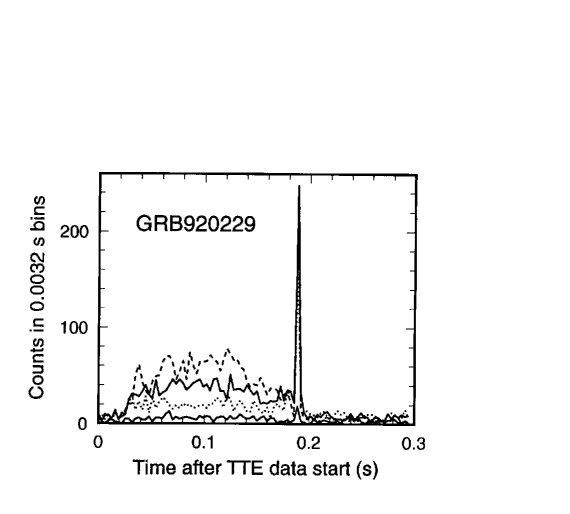
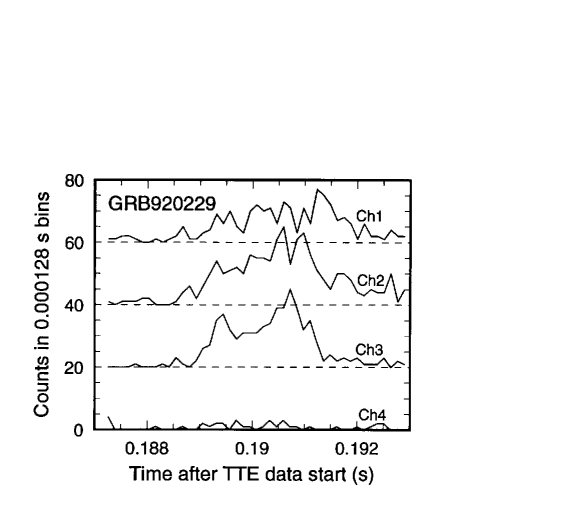
The fastest variability was discovered for GRB920229 (BATSE trigger #1453). The overall light curve (Figure 1) is unusual, consisting of a smooth symmetric peak followed by a much narrower spike. The burst has a short total duration of 0.19 seconds. The spike has a total duration of roughly 0.0044 s and occurs 0.164 seconds after the start of the burst. Figure 2 shows the time history of this spike in the four energy channels.
The rise time of the spike is fast. The count rate goes from near zero counts to a maximum in . The e-folding time scale () depends on the channel, the time range for the fit, and the size of the time bin. The fitted values (over the fastest changing time interval in the binned light curve) are for channel 1, for channel 2, for channel 3, and for the sum of channels 1, 2, and 3. By slight changes in the time range for the fit, a time scale as short as can be found, while the inclusion of time intervals substantially before the rise or after the peak will yield longer time scales. For the binned light curve for the fastest changing time interval, the fitted values are for channel 1, for channel 2, for channel 3, and for the sum of channels 1, 2, and 3. We will adopt a rise time equal to as conservatively representing the range of fitted values.
The spike also has a fast e-folding fall time (). The fastest time scale is in channel 3. The fitted e-folding time scale of the fall is over 11 time bins in the light curve starting at the highest point in the spike. In the light curve, is over the time interval after the highest point in the spike. If the later half of this fall is fitted separately (hence missing the small interval of brightening in the middle), we find and for the and time bins. The sharp drop in channel 2 starts approximately after the sharp drop in channel 3. Channel 2 has a slower fall rate than in channel 3, its overall e-folding time scale is while its fastest falling time interval has . The sharp drop in channel 1 starts approximately after the sharp drop in channel 3. The value of varies around depending on the precise choice of fitted time interval, although the steepest time interval has . From this analysis, we can be confident that the decay time scale is at least as short as , while some time intervals may have significantly shorter.
3 Fast Spectral Variations
The delay between the start time for the spike’s sharp drop as well as the differences in decay time scales between the channels implies that the spectral shape is rapidly softening. For most of the time during the spike, channel 3 has the most counts while channel 4 has essentially zero counts, thus indicating some spectral cutoff or break at energies just below 300 keV. For the tail of the rapid decay, channel 2 has the most counts while channels 3 and 4 have few counts, thus indicating some spectral cutoff or break at energies just below 100 keV. The break energy has shifted significantly on a fast time scale.
A plausible explanation for this shift relates to the scattering of burst photons off the Earth’s atmosphere. Bhat et al. (1992) showed that such reflections are softer and delayed by . For the fall of the sharp spike in GRB920229, a soft and delayed echo might be able to produce the fast spectral change. However, we do not think that this effect is the cause. First, LAD detectors 1 and 5 have large angles away from the center of the Earth ( and ), so only distant parts of the Earth’s limb will be obliquely visible to the detectors. Second, LAD detector 0 (which points away from the burst yet only away from the center of the Earth) sees 40 counts above background in all four channels over the entire burst while 41 counts are expected by simple scaling from LAD detectors 1 and 5, thus showing that the reflected flux is small. Third, LAD detector 2 (which is hidden from the burst yet is pointing from the Earth’s center) sees only 12 counts above background in all four channels during the entire time of the burst, showing that the Earth scattering is small.
To be quantitative about the spectral changes, we have defined a hardness ratio as the counts in channel 3 divided by the counts in channels 1 and 2. The flux during the spike has a hardness ratio of typically 0.5, as compared to hardness ratios of before and after the spike when the flux is weak. The hardness ratio varies from to between time bins separated by during the decay of the spike. This is the fastest known time scale for spectral changes ().
4 Spectrum
The channel 4 light curve (for both the spike and the entire burst) shows near zero flux. This is surprising since the burst is brightest in channel 3. (The background subtracted photon count over the entire burst for channels 1, 2, 3, and 4 are 730, 1630, 2490, and 120 photons.) By itself, this shows that the spectrum for GRB920229 must have a sharp spectral cutoff just below the energy boundary between channels 3 and 4. This conclusion does not depend on details of the background subtraction and spectral deconvolution. The only observational questions are the energy and sharpness of the spectral break.
To measure the properties of this spectral break, we have extracted the spectrum from the BATSE data. In particular, we have used the count spectra from LAD detectors 1 and 5, which are facing at angles of and from the burst direction. (The spectroscopy detectors have too small an area to catch a usable number of photons, while the other triggered LAD modules have a large angle towards the burst direction.) We use the HERB data type, which has 128 channel energy resolution and dead time at 100 keV. We used the spectra which record the first 1.92 seconds after the BATSE trigger, so that the HERB spectra from the two detectors would cover identical time ranges. The BATSE trigger time is 0.053 s after the start of the burst (as recorded in the pretrigger TTE data), so roughly 30% of the burst flux is not included. The hardness ratios do not change significantly throughout the burst (until the end of the spike, see Section 3), so the exclusion of some fraction of the burst flux is unlikely to affect the measured spectral shape.
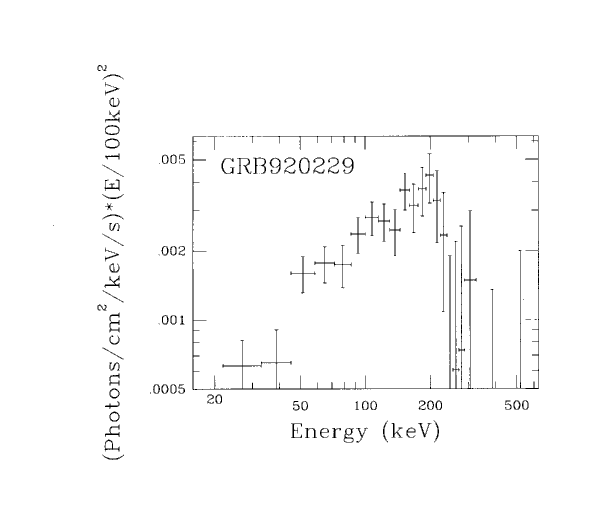
Our analysis procedures are given in detail in the BATSE spectroscopy catalog (Schaefer et al. 1994). We have calculated the background at the time of the burst on a channel-by-channel basis, by averaging the HERB spectra taken from 3.2 to 80.7 seconds after the trigger. Corrections due to Earth scattering of the burst photons are small since the two LAD detectors are pointing and from the center of our planet. The spectra from both detectors are fully consistent with each other. These individual spectra have been combined together and then individual energy channels have been binned together by the procedures in Bromm & Schaefer (1998). The usual photon spectrum (with units ) has been multiplied by , to get a quantity proportional to . This spectrum runs from 22 keV to over 1 MeV. The final spectrum is presented in Figure 3 and Table 1.
We have performed a variety of model fits to the count spectra. A sharply broken power law provides a good fit, with the power law indices of for energies below 200 keV and for energies above 200 keV. The fit to the ’GRB function’ (Band et al. 1993) converges with the break at high energy, so that the fit is really that of a power law times an exponential. The best fit power law index is and the characteristic energy for the exponential is . The shocked synchrotron model (Tavani 1996) does not have a sharp cutoff, even with the value being allowed to become large, with the best fits approaching a power law (with index held at 1.33) times an exponential (with characteristic energy of ). Both the GRB function and the synchrotron model systematically underestimate the flux for all bins from 145-222 keV and systematically overestimate the flux for all bins . Both predict that the burst photons in channel 4 should be , whereas only 120 are observed. Thus, neither the GRB function nor the synchrotron model are consistent with the sharp observed break.
The peak is close to 200 keV. Above this peak, the flux drops rapidly, with the 223-239 keV bin having half the peak value and only a excess above background. The next higher bin is a factor of 8 below the peak and is only a detection of flux. All higher bins have no significant flux. So GRB920229 goes from its peak to near zero flux from roughly 200 to 239 keV. This corresponds to a value of . This is by far the sharpest known spectral break or continuum feature (cf. Schaefer et al. 1993). The only sharper claimed features in GRB spectra are the proposed cyclotron lines (Murakami et al. 1988).
5 Implications
GRB920229 has four extreme properties, far beyond any previous known example. It has the fastest rise time (), the fastest fall time (), the fastest spectral variability time scale (), and the sharpest spectral continuum feature ( = 18 %). These values provide a challenge to the standard fireball models of bursts.
The rise in brightness can be smeared in time for any of several kinematic effects. We can analyze each effect by itself, assuming that the other effects are negligible, so as to produce conservative limits. The details will depend on the scenario under consideration. Here, we will consider three general cases; the external shock model, the internal shock model, and a collimated jet model.
In the external shock model, some central energy release sends out a single shell of ejecta at relativistic velocities (with Lorentz factor, , from 100 to 1,000) which then impacts onto an ambient cloud converting the shell’s kinetic energy into radiant energy. A near zero rise time can be observed if the cloud is physically small and if the shell is physically thin.
If the cloud has a physical thickness along the line of sight, then a measurable rise time will result. This thickness can result either because the cloud has lower density towards the oncoming shell (i.e., the cloud has a fuzzy edge) or because the shape of the cloud results in some regions being hit first with the remainder being hit later (i.e., the cloud is not planar). The rise in brightness will start when the shell first hits the leading edge of the cloud with a peak corresponding to when the shell passes over the center of mass of the cloud. The observed rise time in brightness will correspond to either the scale height for the cloud density or to a characteristic distance scale for the cloud structure. The shell is moving very close to light speed, so the observed rise time provides a stringent limit on the size scale of the cloud as (FMN). For GRB920229 (with ) and , the limit is that the characteristic distance scale of the cloud along the line of sight must be less than 0.9 Astronomical Units. For , the cloud must be roughly the size of our Sun.
If the cloud has a physical thickness perpendicular to the line of sight, then a measurable rise time will result. The reason is that the farther off the line of sight a photon is produced, the longer the path length for the photon to reach Earth. The minimum rise time occurs when the cloud is centered along the line of sight, so this case will be assumed to provide the most conservative limits. Since the shell is expanding at nearly the speed of light, the observed delay depends only on the radius of the shell at the time of impact with the cloud (R) and the angular radius of the cloud subtended from the burst site (). The rise time will be close to (FMN). The shell has been expanding for at least the time from the start of the burst until the time of the spike (), so (FMN). Then, . For the GRB920229 spike, , , and , we get that must be less than radians or 1.3 arc-minutes. Due to self shadowing, Earth can only see a ’cap’ of the shell which subtends an angle , so the cloud can only occupy roughly 0.13% of the cap region at most. Fenimore et al. (1998) have examined the smoothness of burst light curves to reach a similar conclusion that the surface filling factor is typically .
If the shell has a physical thickness, then a measurable rise time will result. Such a thickness could arise either because the energy release volume is large or because the ejecta has a dispersion of velocities. For the rise time to be , the characteristic thickness of the energy release region must be less than roughly 66 km(FMN). Even a slight dispersion of velocities will result in a precursor of fast ejecta significantly preceding the main mass of the shell hitting the cloud, with a long rise time. Let be the Lorentz factor for the densest layer of the shell, with the difference in Lorentz factor between and the leading edge of the shell. To allow for the observed rise time, the fractional dispersion in Lorentz factors within the shell must be less than along the radius vector. For the spike in GRB920229, the shell must have less than 0.07%. In the absence of a significantly dense medium to contain the expansion, we know of no means to enforce such a constant velocity.
In the internal shock model, some central engine sends out multiple shells at relativistic velocities, and these shells collide with each other releasing their kinetic energy as radiation. A near zero rise time would be visible if the shells were physically thin and do not cover a large solid angle.
If the energy release region has a significant characteristic size, then a measurable rise time would result. That is, a large emission region would produce a shell with a leading edge that has a thickness comparable to the region’s size, and then produce a rise in brightness approximately equal to the light travel time across the source region. For GRB920229, the source region must then be smaller than .
If one of the colliding shells has a dispersion of velocities, then a measurable rise time would result. That is, the fast ejecta would strike the outside shell first while the densest part of the shell would hit only later. The rise time depends on the time delay between the emission of the two shells (), the ratio of Lorentz factors between the outer shell and the fast material in the inner shell (), and the ratio of Lorentz factors between the outer shell and the densest material in the inner shell (). We must have . The rise time will be . If is not close to , then the rise time will be of order . If the value of is of order , then the shells will collide within a few hundred kilometers of the central engine unless the shell velocities are closely matched. Alternatively, can be substantially larger (say, comparable to the burst duration) if . For GRB920229 with , if seconds and , then the dispersion of Lorentz factors in the shell must be less that 1%. For any alternative, the ejecta velocities will have to be finely tuned.
If the colliding shells subtend a significant solid angle (as viewed from the site of the central engine), then a measurable rise time would result. Portions of the collision that are off the line of sight will have a delay due to the longer path length that the photons must travel to reach Earth. The limits are the same as derived for the external shock model, except in this case we cannot constrain the radius of the shells at the time of the collision. Thus, no formal constraints on the solid angle of the collision region arise from this effect. That is, if two shells are ejected such that they collide at a great distance from the central engine, then the delay for the off axis photons can be made small. Any such attempt to make R very large then forces to increase so that the rise time will nonetheless be long unless the shell velocities are finely tuned. However, for R values comparable to those deduced from the time of first visible gamma radiation, limits on the subtended angle for the collision region will be of order an arc-minute.
Jet models would have the relativistic outflow confined to a small solid angle, with the radiation produced by either external or internal shock. In either case, the limits derived above are still applicable. (Models where the jets sweep across either the Earth or some cloud have already been rejected due to the strong asymmetry of rise and decay times; Nemiroff et al. 1994.) Of particular interest is the very narrow collimation of the beam ( arc-minute) in the case where the emission is produced by a collision with a cloud. Even if the radiation is produced by shocks internal to the jet, comparable collimation constraints are required for reasonable R values.
What physical mechanism produces the sharp spectral cutoff? Within the framework of the fireball model for GRBs, we are seeing flux from particles expanding towards Earth at relativistic velocities. So in the rest frame of the emitting particles, the spectral cutoff is actually at a substantially lower energy. For typical estimates that is 100-1000, the cutoff must be from 0.2 to 2.0 keV. Electron-positron opacity effects are not sharp enough and are always at higher energy; cf. Baring 1990. Photoelectric absorption would require unionized matter and would cutoff to lower energies. The shocked synchrotron model cuts off as an exponential in the absence of a hard tail, and so is already rejected by the model fits. The mechanism must allow for a shift in the observed cutoff energy, as seen during the decay of the spike. If a single physical process can be identified, then the observed cutoff characteristics could yield unique information on properties such as temperature, optical depth, or .
The sharp spectral cutoff can constrain the velocity dispersion within the expanding shells. A spread of velocities would cause the cutoff for each volume element to be boosted by a different Lorentz factor. For the observed , the value must be less than 18%.
The opening paragraph of this section summarized the extreme properties of GRB920229, and these place severe constraints on burst models. The thickness of the energy production region must be smaller than along the line of sight, ejected shells must have a dispersion of the Lorentz factor of less than roughly 1%, and the angular size of the radiation emission region is of order 1 arc-minute as viewed from the burst center. The physical mechanism for the spectral cutoff (at an energy of 200 keV with no blue shift or 0.2-2.0 keV in the rest frame of the shell) has not been determined.
We thank E. E. Fenimore for key discussions.
References
- (1) Band, D. et al. 1993, ApJ, 413, 281
- (2) Baring, M. 1990, MNRAS, 244, 49
- (3) Bhat, P. N. et al. 1992, Nature, 359, 217
- (4) Bromm, V. & Schaefer, B. E. 1998, ApJ, submitted
- (5) Cline, T. L. et al. 1980, ApJ, 237, L1
- (6) Costa, E. et al. 1997, Nature, 387, 783
- (7) Deng, M. & Schaefer, B. E. 1997, ApJ, 491, 720
- (8) Fenimore, E. E., Madras, C. D., & Nayakshin, S. 1996, 473, 998 (FMN)
- (9) Fishman, G. J. et al. 1994, ApJSupp, 92, 229
- (10) Frail, D. A. et al. 1997, Nature, 389, 261
- (11) Giles, A. B. 1997, ApJ, 474, 464
- (12) Harding, A. K. & Baring, M. G. 1994, in Gamma-ray Bursts, ed. G. Fishman et al. (New York; AIP 307), 520
- (13) Metzger, M. R. et al. 1997, Nature, 387, 476
- (14) Mészáros, P. & Rees, M. J. 1997, ApJ, 476, 232
- (15) Mitrofanov, I. G. 1989, Ap&SS, 155, 141
- (16) Murakami, T. et al. 1988, Nature, 335, 234
- (17) Nemiroff, R. J. et al. 1994, ApJ, 423, 432
- (18) Schaefer B. E. et al. 1992, ApJ, 404, 673
- (19) Schaefer B. E. et al. 1994, ApJSupp, 92, 285
- (20) Tavani, M. 1996, ApJ, 466, 768
- (21) van Paradijs, J. et al. 1997, Nature, 386, 686
| Bin energy | |
|---|---|
| 22 - 33 | |
| 33 - 45 | |
| 45 - 58 | |
| 58 - 72 | |
| 72 - 86 | |
| 86 - 100 | |
| 100 - 115 | |
| 115 - 130 | |
| 130 - 145 | |
| 145 - 160 | |
| 160 - 176 | |
| 176 - 191 | |
| 191 - 207 | |
| 207 - 223 | |
| 223 - 239 | |
| 239 - 255 | |
| 255 - 271 | |
| 271 - 287 | |
| 287 - 325 | |
| 325 - 457 | |
| 457 - 592 |