12 (11.03.4 Abell 370; 11.05.2; 12.03.3; 12.07.1)
J. Bézecourt, bezecour@astro.rug.nl
Lensed galaxies in Abell 370
Abstract
We present new observations of the cluster-lens Abell 370: a deep HST/WFPC2 F675W image and ESO 3.6m spectroscopy of faint galaxies. These observations shed new light on the statistical properties of faint lensed galaxies. In particular, we spectroscopically confirm the multiple image nature of the B2–B3 gravitational pair ([Kneib et al. 1993]), and determine a redshift of which is in very good agreement with earlier predictions. A refined mass model of the cluster core (that includes cluster galaxy halos) is presented, based on a number of newly identified multiple images. Following Bézecourt et al. (1998a), we combine the new cluster mass model with a spectrophotometric prescription for galaxy evolution to predict the arclets number counts and redshift distribution in the HST image. In particular, the ellipticity distribution of background sources is taken into account, in order to properly estimate the statistical number and redshift distribution of arclets. We show that the redshift distribution of arclets, and particularly its high redshift tail can be used as a strong constraint to disentangle different galaxy evolution scenarios. A hierarchical model which includes number density evolution is favored by our analysis. Finally, we compute the depletion curves for the faint galaxy number counts and discuss their wavelength dependence.
keywords:
Galaxies: cluster: individual: Abell 370 – Galaxies: evolution – Cosmology: observations – gravitational lensing1 Introduction
Thanks to gravitational amplification, galaxy clusters are a powerful tool to probe distant galaxies. Indeed, one of the most distant galaxy detected is a gravitational arc at =4.92 in the cluster Cl1358+62 ([Franx et al. 1997]). Other very distant lensed sources (3) have been identified behind Cl0939+4713 ([Trager et al. 1997]) and A2390 ([Pelló et al. 1998a], [Frye & Broadhurst 1998]) leading to important results on the formation history and evolution of galaxies at large redshift. Determining the redshift of arcs and arclets is of great importance as it fixes the angular scales of the optical configuration, hence giving an absolute cluster mass estimate within the arc radius (e.g. [Soucail et al. 1988], [Mellier et al. 1991]). But despite the cluster magnification, measuring arclets redshifts is a difficult observational task due to their low surface brightness ([Bézecourt & Soucail 1997], [Ebbels et al. 1998]), and the lack of strong spectral features in the optical domain for galaxies with .
Accurate modeling of cluster potentials based on the analysis of multiple images and weak shear distortions has shown that cluster mass distributions are best described by the sum of a smooth and large scale component (the cluster) and the contribution of cluster galaxy halos ([Kneib et al. 1996], [Natarajan et al. 1998], [Geiger & Schneider 1998]). For a given mass distribution, Kneib et al (1996) demonstrated that a redshift can be estimated if one can measure accurately the shape of an individual arclet. In order to validate this method and study its biases, extensive programs of gravitational arclet spectroscopy have been undertaken. In particular, Ebbels et al. (1998) have measured 19 redshifts of lensed objects behind Abell 2218. Most of them confirm the lens redshift prediction, and allow the accuracy of the mass model to be improved. Similarly, Bézecourt and Soucail (1997) have started the spectroscopy of arclets in Abell 2390, which has been used to constrain the mass distribution in this cluster with a great accuracy ([Kneib et al. 1998]).
Using these accurate cluster mass models and a spectrophotometric description of galaxy evolution (Bruzual & Charlot 1993, [Pozzetti et al. 1996]), Bézecourt et al. (1998a) have predicted the expected arclet number counts and their redshift distribution. This model presents many improvements with respect to previous work (e.g. [Nemiroff & Dekel 1989], [Wu & Hammer 1993], [Grossman & Saha 1994], [Hattori et al. 1997]) as it includes many observational limits such as magnitude ranges, surface brightness cut-off or a choice of the optical waveband, and this for any mass distribution, regardless of its complexity.
Abell 2218 is the first cluster where the number counts and redshift distribution of the background arclets have been examined in detail ([Bézecourt et al. 1998a], [Ebbels et al. 1998]). We propose in this paper to further extend this study to another well known cluster lens, namely Abell 370. Its mass distribution was first accurately derived by Kneib et al. (1993) [hereafter K93] who showed that the mass model has to be bimodal in shape in order to accommodate the gravitational pair B2–B3. This was later confirmed by the HST/WFPC1 observation described in Smail et al. (1996) and the X-ray map of the cluster, displaying a bimodal shape compatible with the lens model ([Fort & Mellier 1994]).
We present new observations of the cluster Abell 370 in Section 2: a deep HST/WFPC2 image and spectroscopic data. Section 3 discusses the new lensing mass model. In section 4, we use an improved version of the code developed by Bézecourt et al. (1998a) to determine the expected counts and redshift distribution of arclets in Abell 370. Our analysis explores two different scenarios of galaxy evolution to study their differences, and compute the depletion curves of background number counts at different wavebands. Discussion, conclusions and further prospects to constrain galaxy evolution through lenses are presented in Section 5. Throughout the paper, we use a Hubble constant of H, with = 0 or 1 and .
2 New observational data
2.1 HST observations and photometry
Abell 370 was observed with the HST/WFPC2 camera with the F675W filter [ID: 6003, P.I.:R.P. Saglia], resulting in a reasonably deep image with a total exposure time of = 5.6 ksec. These data were provided by the ESO/ST-ECF Science Archive Facility, Garching, Germany and were reduced with standard reduction procedures. We used the IRAF/STSDAS packages for the image combinations after centering and cosmic ray cleaning. The absolute photometry was obtained using magnitude zero-points given in Holtzman et al. (1995). The photometry of the field was obtained with the Sextractor package ([Bertin & Arnouts 1996]). A criterion of 12 contiguous pixels above the given detection threshold was used to identify an object. The 1 detection limit is mag arcsec-2. From the magnitude histogram obtained from the catalog, we estimate the completeness limit to be .
We also built a sample of arclets for the purpose of our study of their photometric and statistical properties. To define an arclet we imposed the following selection criteria: at least 12 contiguous pixels above 2 of the local sky level, an axis ratio greater than 2, a central surface brightness lower than mag. arcsec-2 and a magnitude range . The final sample contains 81 arclets and their magnitude histogram is discussed in Section 4.2.
2.2 Identification of multiple images and arclets
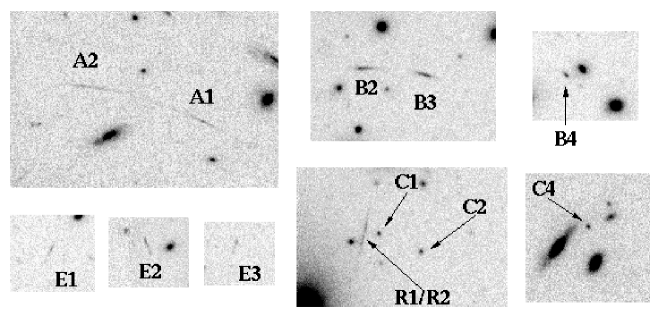
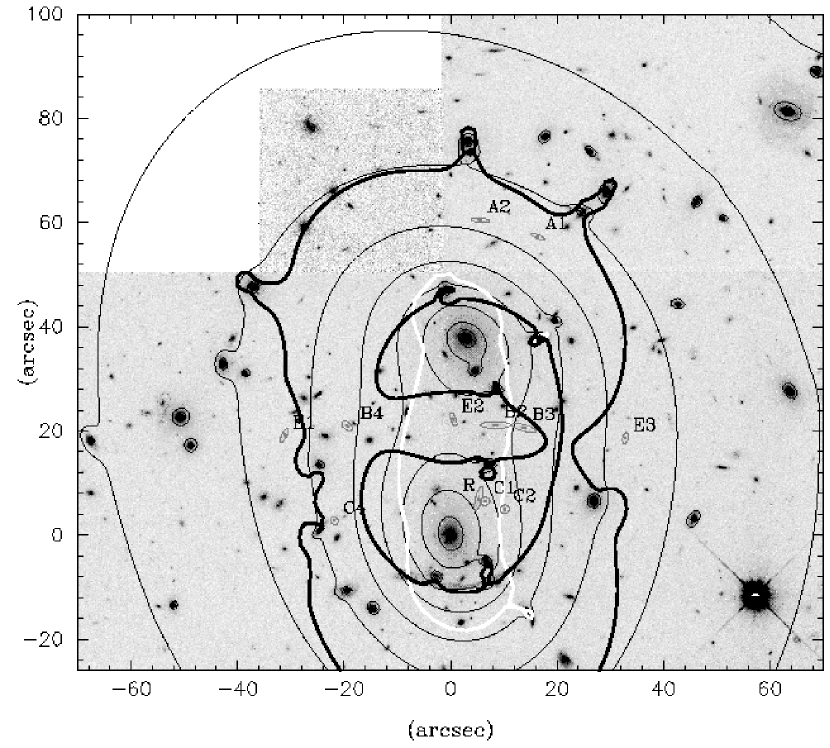
Abell 370 (=0.37) is a rich optical cluster dominated by two giant elliptical galaxies identified as #20 and #35, following the numbering of Mellier et al. (1988). A set of multiple image candidates and gravitational arcs are identified on the WFPC2/F675W image and are displayed in Figure 1. Their photometric and geometrical properties are also summarized in Table 1. We now discuss them in detail:
A0 : Near galaxy #35 is located the spectacular giant arc (=0.724) initially detected by Soucail et al. (1987). From the high resolution WFPC2 image more details on its morphology are clearly visible, suggesting that it is a gravitationally lensed image of a spiral galaxy ([Soucail et al. 1998a]).
A1 to A6 : A first set of arclets (labelled A1 to A6) was detected from ground based images by Fort et al. (1988) and further discussed by Kneib et al. (1994). Most of them are blue objects, but none have a spectroscopic redshift yet. A5 is the most extended one and presents very blue colors and a strong dimming in the reddest bands, suggesting a young star forming galaxy. Despite deep spectroscopic data for A5 ([Mellier et al. 1991]) no significant emission line has been identified suggesting that . Arclets A3 to A6 are probably single images of background lensed galaxies in view of their location in the lens plane. Arclets A1 and A2 may be multiple images of the same source.
The multiple images B, C and D : K93 demonstrated that the B2–B3 objects (Fort et al. 1988) correspond to a gravitational pair with a counter image labeled as B4. The B2–B3 pair and the arc A0 were used to constrain the K93 model which showed a bimodal mass distribution. This model proposed that objects C1–C2–C3 and D1–D2, identified on high quality ground-based images, were also multiple image systems. A redshift estimate based on the mass model was proposed for each of the pairs: , and . The reality of B4 was confirmed a posteriori by the HST/WFPC1 data (Smail et al. 1996). C3 is likely to be a wrong identification of the counter image of C1–C2, and we denote C4 the correct counter image used in the present model.
The radial arc R : In the HST/WFPC1 image, Smail et al. (1996) discovered a radial arc candidate R (R1-R2) located close to galaxy #35. They modeled it as a 5-image configuration, and predicted a redshift of using the K93 model. This radial arc is well identified in the F675W image and is clearly the merging of 2 images.
New multiple images : The detailed insight of the mass model and the exquisite HST resolution allow the identification of other multiple image candidates. We only discuss here the E1–E2–E3 multiple configuration as it presents a characteristic inversion of parity as expected from lensing theory (see also [Smail et al. 1995] and [Colley et al. 1996] for other spectacular examples). Other multiple image candidates will be discussed in a forthcoming paper.
| Object | X (′′) | Y (′′) | R675W | ||
| A1 | 16.35 | 57.30 | 0.74 | -23.8 | 24.83 |
| A2 | 5.56 | 60.43 | 0.75 | -4.6 | 24.38 |
| B2 | 8.46 | 21.14 | 0.76 | -0.2 | 23.08 |
| B3 | 13.80 | 20.58 | 0.74 | -15.7 | 23.23 |
| B4 | -19.45 | 20.98 | 0.42 | -41.6 | 23.82 |
| C1 | 6.46 | 6.50 | 0.17 | 4.6 | 24.05 |
| C2 | 10.19 | 4.96 | 0.10 | 63.2 | 24.00 |
| C3 | -21.82 | 2.78 | 0.14 | -60.9 | 23.99 |
| R1/R2 | 5.27 | 7.03 | 0.76 | 76.4 | 23.98 |
| E1 | 32.86 | 18.62 | 0.51 | 74.6 | 24.83 |
| E2 | -31.22 | 19.15 | 0.68 | 64.4 | 24.53 |
| E3 | 0.54 | 22.21 | 0.66 | -69.8 | 24.44 |
| # 20 | 3.09 | 37.85 | 0.36 | -70 | 16.9 |
| # 35 | 0.00 | 0.00 | 0.45 | -77 | 17.1 |
2.3 Spectroscopic Observations
Spectroscopic data were acquired at the 3.6m telescope of La Silla (ESO) with EFOSC on October 1996. A long slit of 1.5\arcsec width was positioned along the two objects B2 and B3 for a total integration time of 3 hours with an average seeing of 1.9\arcsec. Following the predictions of K93, the [Oii] emission line was expected to lie at Å. Thus the R300 grism was used, providing a useful spectral range 6000Å–9000Å and a dispersion of 7.5Å/pixel. The data were reduced with standard procedures for flat fielding, wavelength and flux calibration in the IRAF environment. Sky subtraction was performed on the 2D image, and the final spectra were extracted with an optimal extraction algorithm.

Both objects B2 and B3 show a prominent emission line at Å and Å respectively on the two dimensional spectra, which we identify with [Oii] 3727Å (Figure 2 and 3). Another feature appears at Å and Å respectively, identified with [Oiii] 5007Å thus confirming the redshifts. We find and , clearly demonstrating the similarity of the two objects within the error bars, and in good agreement with the prediction. This definitely confirms the nature of these objects as a multiply imaged galaxy.
Although, arclets A1 and A2 were observed during 4.5 hours, no continuum nor emission line could be detected.
2.4 A closer look at the B2–B3–B4 multiple image

This multiple image is one of the bluest arclets observed in this field. Accurate photometry is available in many filters extending from to with data coming from a U HST image with the F336W filter (ID: 5709, P.I. J.M Deharveng, [Bézecourt et al. 1998b], hereafter Paper II), , and images from CFHT ([Kneib et al. 1994]) and unpublished CFHT infrared images in and bands (Le Borgne and Picat, private communication). B2 lies too close to galaxy #20 and is contaminated by its envelope at long wavelengths, hence we only concentrate on B3.
We compute the spectral energy distribution (SED) of B3, corrected from its redshift, in order to study the stellar content of the galaxy. We compare and fit the B3 SED with synthetic ones from the Bruzual and Charlot spectrophotometric evolutionary code (GISSEL96). This code can provide SEDs for different metallicities ranging from Z⊙/50 to 5 Z⊙, different spectroscopic galaxy type determined by the star formation history (burst, elliptical, spiral and irregular), and different internal absorption by dust can be studied. The extinction law used is the one proposed by Calzetti (1997) which is similar to what is observed in our galaxy without the 2175Å bump. We explore the 3-dimensional parameter space (spectroscopic type, metallicity and absorption, E() from 0 to 0.3 mag.) to fit the B3 photometry by the model SEDs.
The main constraint comes from the high UV flux which requires a weak internal absorption (mag) and a low metallicity () (Figure 4). Despite this, the fit does not reproduce the UV part very well. A possibility is that we are seeing the superposition of a very recent burst of star formation on an older stellar population. A strong starburst alone would show a much fainter flux at red and infrared wavelengths, hence the observed IR emission must come from an already existing old population. The B multiple image is similar to arclet A5 which is also very bright in the UV but much fainter in the IR ( for B3 and for A5). More precisely, assuming a redshift of =1.3 (Mellier et al. 1991), we have similarly fitted the A5 SED. It shows evidences for a low absorption ( mag.) and a very low metallicity () (Figure 5). The fact that the best-fit metallicity () is the lower bound allowed by the code should not be a problem as a satisfying fit is also obtained for with comparable significance. The trend towards low is then stable and not too fast. The corresponding age is 0.3 Gyr, drawing the portrait of a very young object in an active phase of star formation. An additional old population is not required for A5 which is the major difference with object B.

These two objects B3 and A5 are typical examples of the population revealed by UV imaging. The UV selection exhibits young objects with low metallicity and low absorption in the redshift range [0.5,2.0].
Such detailed stellar population study, could in principle be applied on any other arclets in the field, for which redshifts have been spectroscopically confirmed or are strongly constrained by lensing and photometric redshift techniques (Pelló et al. 1998a).
3 An improved lens model
Using both the giant arc A0 and the B2–B3–B4 triple system, K93 showed that a bimodal mass distribution was an adequate fit to these multiple image constraints (see also AbdelSalam et al. 1998 for a different approach). Here, we improve this gross picture by taking into account the contribution of the cluster galaxies (mainly E/S0 galaxies in the cluster core) in a similar way as Kneib et al. (1996) and Natarajan et al. (1998). All mass components (galaxies+clusters) have been assumed to follow a truncated pseudo isothermal mass distribution (PIEMD, Kassiola and Kovner 1993, Hjorth & Kneib 1998).
Following Kneib et al. (1996), for each galaxy halo, the velocity dispersion , the truncation radius and the core radius are scaled to the galaxy luminosity computed from the observed F675W magnitude. The scaling relations used for the galaxy halos are:
| (1) |
| (2) |
| (3) |
The scaling relations adopted are motivated by the properties of the fundamental plane (FP) and are similar to the one used by Brainerd et al. (1996). In particular, the exponent 0.8 in eq. (2) leads to a total mass-to-light ratio that scales with in agreement with the observed correlation of the FP (e.g. Jorgensen, Franx & Kjaergaard 1996). Brighter galaxies have more extended and therefore more massive dark halos.
The orientation and ellipticity of the galaxy halos are taken from the observed values of the light distribution while and are optimized. is fixed at 0.15 . To model the cluster components we considered two ‘large scale’ mass distributions (represented by 2 truncated PIEMD mass distribution) centered on galaxies #20 and #35. Their orientations, ellipticities, velocity dispersions and core radius are left as free parameters.
The constraints imposed in the optimization procedure are the multiple images described in section 2.2, along with the redshifts of A0 and of the B2–B3–B4 triplet. The best fit parameters are summarized in Table 2 (=4.5). We also derive a “lensing” redshift estimate for the multiple images. The C system is at , D is at and E is at . R is moved to larger redshift with and A1/A2 could form a gravitational pair at . We computed the total projected mass in different apertures centered at the barycentre of the #20 and #35 galaxies. We find that within 75, 150 and 300 kpc the total mass is, respectively, for this modeling and the previous one (K93): 0.5 (0.45) 0.05 1014 M⊙, 1.8 (1.6) 0.1 1014 M⊙ and 4.8 (4.3) 0.15 1014 M⊙. Furthermore, 5% of the total mass is retained in cluster galaxy halos. The total mass-to-light ratio is 180 (M/LV)⊙ (out to 300kpc, 160(M/LV)⊙ for the K93 modeling), and 9 (M/LV)⊙ for a galaxy halos. These results are similar to the one found in other cluster lenses like Abell 2218, 2390 and AC114 (Kneib et al 1996, 1998; Natarajan et al 1998).
| id | |||||
|---|---|---|---|---|---|
| 35 | 0.23 | -80 | 1050 | 75 | 800 |
| 20 | 0.12 | -57 | 1100 | 91 | 800 |
| galaxies | – | – |
4 Statistical properties of faint galaxies
4.1 Modeling the number counts of lensed galaxies
The number counts of gravitational arclets in the field of a massive cluster of galaxies are a competition between the magnification of the luminosity by the cluster potential that makes more objects visible and the surface dilution that decreases the surface density of arclets by the same factor as for the magnification.
The number of arcs brighter than magnitude with an axis ratio greater than and a surface brigthness brighter than within the field of a cluster of galaxies is:
|
|
(4) |
The sum is over the different morphological types . is the lens redshift and is the redshift cutoff corresponding to the limit in central surface brightness . is the angular area in the source plane (at redshift ) that gives arcs with an axis ratio between and . is the luminosity function at redshift for each morphological type.
It was required as a preliminary step that counts in wavebands from to and redshift distributions in and in empty field are correctly reproduced. We used the model for galaxy evolution of Bruzual and Charlot (1993) with the prescriptions of Pozzetti et al. (1996) for the optimisation of the parameters representing the field galaxy distributions (see Bézecourt et al. 1998a for details).
The weak point in the Bézecourt et al. 1998a model, is the approximation of circular sources used for the calculation of arclets axis ratio. Indeed, this may underestimate the number of galaxies with axis ratio larger than a certain threshold especially at low redshifts and then bias the predicted redshift distribution. To provide a more accurate and reliable redshift distribution, we now take into account the galaxy ellipticity distribution as given by Ebbels (1998) (this distribution is based on the analysis of HST/MDS-like images, and is therefore appropriate to our study):
| (5) |
where for an elliptical object with semi major axis and semi minor axis . The complex deformation is defined by: where is the orientation of the major axis. At each point in the image plane (and at each redshift step for the sources), we estimate the fraction of the background galaxies which can give a lensed image more distorted than a fixed limit. We first consider the effect of the lens deformation through the complex relation given by Kneib et al. (1996) that relates the image deformation as a function of the source deformation and the strength of the potential :
| (6) |
where (see Kneib et al 1996 for a full description of this formalism). The term is a correction for strong lensing only. A lower threshold in the observed axis ratio ( here) corresponds to a lower threshold in the deformation () whatever the position angle of the image. Within this limit, we then scan all the allowed solutions for and the source position angle . The fraction of galaxies at the location in the image plane and at redshift which fill the condition is computed using the probability distribution of equation (4) for and an average over the position angle .
| (7) |
4.2 Comparison between the observed and predicted arclets number counts

The magnitude histogram of the arclets observed in A370 is shown in Figure 7. As already stressed in Bézecourt et al. (1998a), we find that the addition of galaxy scale components and the effect of the source ellipticity distribution significantly increase arclets counts by a factor of 1.4 () and 1.7 () with respect to a K93 model with the assumption of circular sources. Such increase in the arclets counts was already observed in Bézecourt et al. (1998a) when using a detailed mass distribution but only with circular sources. Considering an ellipticity distribution for the galaxies also increases the arclet counts and strongly modifies the redshift distribution as discussed below. With this refinement, the arclet counts prediction is now more consistent with the data over the whole magnitude range. Clearly, detailed lens models and proper assumptions on the source ellipticity distribution are mandatory to explore arclets counts.
4.3 Redshift distribution of arclets

The next step is to consider the redshift distribution of the arclets. Figure 8 shows the predicted one with the selection criteria close to the observational limits for faint object spectroscopy (, and ). The comparison with real data is not easy at present because no well defined sample of arclets, complete in magnitude, has yet been spectroscopically explored. The redshift distributions displayed in Figure 8 present a prominent peak at and a secondary one at due essentially to the contribution of bright and young Elliptical-type galaxies in their process of strong star formation. This second peak is strongly attenuated compared to what was discussed in Bézecourt et al. (1998a) where there was clearly a strong excess in the high redshift tail. Taking into account the ellipticity distribution of the sources has fixed this problem.
In order to see how stable the redshift distribution is with respect to the ellipticity distribution, another is considered following Ebbels (1998):
| (8) |
representative of objects with while equation 5 was derived with bright objects (). As this distribution corresponds to more elongated objects than in equation 5, more arclets appear at low (Figure 8, dotted line). However, the total number of arclets is increased by only 11%.
Analysis of Figure 8 suggests several comments:
-
•
Compared with the redshift distribution of field galaxies within the same observational limits, the arclet distribution is biased towards more distant objects. We can take advantage of this modification of the redshift distribution to select more distant galaxies in a redshift survey sample. This is particularly true near the central part of the lens where very high redshift galaxies () have already been found ([Ebbels et al. 1996], [Trager et al. 1997], [Franx et al. 1997], [Frye & Broadhurst 1998], [Pelló et al. 1998a]).
-
•
The two galaxy evolution models presented in this paper ( and ) have been validated in empty fields where the number counts and redshift distribution of galaxies were compatible with the observed ones. However they present significant differences at high redshift for arclets. The model with “Pure Luminosity Evolution” (PLE) predicts more high redshift arclets than the model where number density evolution is included. This different behavior of the redshift distribution at is encouraging as it could be a way to distinguish the two scenarios by analyzing the redshift distribution of arclets with . Although it is presently difficult to speculate on the true fraction of very high redshift objects in well defined samples of arclets, this population of very high redshift arclets does not seem to dominate the actual samples. Hence we favor the model corresponding to a merging scenario of galaxy formation and evolution.
-
•
Because the high redshift domain is sensitive to many uncertainties included in the evolutionary code (dust obscuration in the UV, uncertainties in the slope of the IMF for massive stars or in their UV tracks, influence of the short time scale phenomena), we must be cautious on the above conclusions. Furthermore, the galaxy evolution models assume that all the galaxies form instantaneously at a given redshift, which is a clear limitation of these models (we have for , which gives for the present day galaxies an age of 16 Gyr, and for , corresponding to an age of 12.2 Gyr). A more phenomenological model of galaxy formation that follows in detail the mass evolution of galaxy sub units ([Baugh et al. 1998]) may improve this simple description, and would likely be the best to be compared with the current data.
4.4 Depletion curves in Abell 370

For a simple description of the background population, it is easy to show that the number density of objects brighter than a given magnitude behind a lens is:
| (9) |
where is the number density in blank field, is the magnification and is the logarithmic slope of field number counts. An excess or a lack of objects is then expected for a slope steeper or shallower than 0.4 respectively. In practice, optical number counts of field galaxies show a slope smaller than 0.4 in nearly all wavebands (except in U and B at relatively bright magnitudes), so a“depletion” is expected in most cases, being more pronounced at longer wavelengths (Fort et al. 1996, Taylor et al. 1998).
With our model, it is possible to compute radial depletion curves instead of global number counts, for any filter or magnitude range. A clear illustration of the wavelength dependence of the magnification bias is given by the ratio of the number of lensed objects expected in a given area in the field of Abell 370 over the number of field galaxies in the same area (Figure 9). One can note that the predicted intensity of the depletion is higher at longer wavelengths, as expected, because of the shallower slope of the field galaxies counts. Moreover, because of the flattening of the counts at faint magnitudes, the depletion is also very sensitive to the magnitude threshold (see the I curve in Figure 9). UV counts have a slope larger than 0.4 at bright magnitudes () but it quickly decreases at fainter levels. This fast flattening is due to the Lyman break that goes through the red limit of the U filter at redshift . Hence, the lack of objects at faint magnitudes in produces the depletion curve shown in Figure 9 (see Paper II for more details of the UV modeling).
The detection of this magnification bias is highly dependant on the poissonian noise of the background sources and the contamination by cluster members and foreground objects. This is critical in cluster cores where the density of objects is very low, of the order of a few units per arcmin2. Hence, these very poor statistics cannot bring valuable information on the sources redshift distribution as most of the information is expected in the dip of the depletion curve. Only massive clusters are able to show such a depletion curve but the recovery of the sources redshift distribution seems out of reach with present datasets.
5 Conclusions
In this paper, we have presented a new analysis of the cluster lens Abell 370. Thanks to the measurement of the redshift for the B2–B3 gravitational pair () and the identification of several new multiple arclets in the WFPC2 image, a more accurate and well constrained model of the mass distribution in Abell 370 is proposed, including galaxy scale components. We studied the spectral energy distribution (SED) of arclets B3 and A5 which are found to be both young, low metallicity star forming objects without strong interstellar extinction.
The lens model has been used to study the background population of galaxies. Taking the galaxy ellipticity distribution into account induces significant changes in the predicted redshift distribution of arclets. The excess of very distant sources found in previous analyses is now strongly attenuated and arclets at low redshift are recovered. For the two prescriptions used on galaxy evolution, although they both reproduce well the number counts in empty fields and in cluster lenses, the “Pure Luminosity Evolution” model in a low density universe over predicts the number of high redshift () galaxies, compared to what is currently observed. If this effect is observationally confirmed it may constrain the number density evolution of galaxies in order to interpret the redshift distribution of arclets.
To understand further the properties of the background population through cluster lenses, deep dedicated cluster surveys are needed in order to enlarge the number of arclets and have significant statistical properties. A multi-color approach is favored as it can help in constraining the redshift distribution. This is particularly true for those unresolved sources for which no shape information is available and only the spectral energy distribution can discriminate between background objects and cluster members. In addition, detailed study of their spectral energy distribution will be useful to characterize properties like the luminosity function, dust extinction and star formation histories of distant galaxies (e.g. Pelló et al. 1998b).
Acknowledgements.
We thank R. Pelló, R.S. Ellis and Y. Mellier for many fruitful discussions and encouragements. This research has been conducted under the auspices of a European TMR network programme made possible via generous financial support from the European Commission (http://www.ast.cam.ac.uk/IoA/lensnet/). This work was also supported by the Programme National de Cosmologie and CNRS.References
- [AbdelSalam et al. 1998] AbdelSalam H.M., Saha P., Williams L.L.R, 1998, MNRAS, 294, 734
- [Baugh et al. 1998] Baugh C.M., Cole S., Frenk C.S., Lacey C.G., 1998, ApJ 498, 504
- [Bertin & Arnouts 1996] Bertin E. & Arnouts S., 1996, A&AS, 117, 393
- [Bézecourt & Soucail 1997] Bézecourt J. & Soucail G., 1997, A&A, 317, 661
- [Bézecourt et al. 1998a] Bézecourt J., Pelló R., Soucail G., 1998a, A&A, 330, 399
- [Bézecourt et al. 1998b] Bézecourt J., Soucail G., Ellis R.S., Kneib J.P., 1998b, in preparation
- [Brainerd, Blandford & Smail 1995] Brainerd, T., Blandford, R., Smail, I., 1996, ApJ, 466, 623
- [Bruzual & Charlot 1993] Bruzual G.A. & Charlot S., 1993, ApJ, 405, 538
- [Calzetti 1997] Calzetti D., 1997, Proceedings of the Conference ”The Ultraviolet Universe at Low and High Redshift”, eds. W. H. Waller, M. N. Fanelli, and A. C. Danks (New York:AIP), astro-ph/9706121
- [Colley et al. 1996] Colley W.N., Tyson J.A., Turner E.L., 1996, ApJ 461, L83
- [Ebbels et al. 1996] Ebbels T.M.D., Le Borgne J.F., Pelló R., Kneib J.–P., Smail I.R., Sanahuja B., 1996, MNRAS 281, L75
- [Ebbels 1998] Ebbels T.M.D., 1998, PhD Thesis, U. of Cambridge, UK
- [Ebbels et al. 1998] Ebbels T.M.D., Ellis, R.S., Kneib J.–P., Le Borgne J.F., Pelló R., Smail I.R., Sanahuja B., 1998, MNRAS 295, 75
- [Fort et al. 1988] Fort B., Prieur J.L., Mathez G., Mellier Y., Soucail G., 1988, A&A, 200, L17
- [Fort & Mellier 1994] Fort B. & Mellier Y., 1994, A&AR, 5, 239
- [Fort et al. 1996] Fort B., Mellier Y., Dantel–Fort M., 1996, A&A, 321, 353
- [Franx et al. 1997] Franx M., Illingworth G.D., Kelson D.D., van Dokkum P.G., Tran K-V., 1997, ApJ, 486, L75
- [Frye & Broadhurst 1998] Frye B., Broadhurst T., 1998, ApJ, 499, L115
- [Geiger & Schneider 1998] Geiger, B. & Schneider, P., 1998, MNRAS 295, 497
- [Grossman & Saha 1994] Grossman S.A. & Saha P., 1994, ApJ 431, 74
- [Hattori et al. 1997] Hattori M., Watanabe K., Yamashita K., 1997, A&A, 319, 764
- [Hjorth & Kneib 1998] Hjorth J., Kneib J.–P., 1998, ApJ submitted
- [Holtzman et al. 1995] Holtzman J.A., Burrows C.J., Casertano S., Hester J.J., Trauger J.T., Watson A.M., Worthey G., 1995, PASP 107, 1065
- [Jorgensen et al.1996] Jorgensen, I., Franx, M. & Kjaergaard, P., 1996, MNRAS, 280, 167.
- [Kassiola & Kovner 1993] Kassiola A. & Kovner I., 1993, ApJ 417, 450
- [Kneib et al. 1993] Kneib J.–P., Mellier Y., Fort B., Mathez G., 1993, A&A, 273, 367 [K93]
- [Kneib et al. 1994] Kneib J.–P., Mathez G., Fort B., Mellier Y., Soucail G., Longaretti P.–Y., 1994, A&A, 286, 701
- [Kneib et al. 1996] Kneib J.–P., Ellis R.S., Smail I., Couch W.J., Sharples R.M., 1996, ApJ, 471, 643
- [Kneib et al. 1998] Kneib J.–P., Pelló R., Fort B., Mellier Y., Soucail G., Aragón-Salamanca A., Ellis R.S., Smail I.R., Miralda-Escudé J., 1998, in preparation
- [Mellier et al. 1988] Mellier Y., Soucail G., Fort B., Mathez G., 1988, A&A, 199, 13
- [Mellier et al. 1991] Mellier Y., Fort B., Soucail G., Mathez G., Cailloux M., 1991, ApJ, 380, 334
- [Natarajan et al. 1998] Natarajan P., Kneib J.–P., Smail I., Ellis R.S., 1998, ApJ, 499, 600
- [Nemiroff & Dekel 1989] Nemiroff R.J. & Dekel A., 1989, ApJ, 344, 51
- [Pelló et al. 1998a] Pelló R., Kneib J.P., Le Borgne J.F., Bézecourt J., Ebbels T.M., Tijera I., Bruzual G.A., Miralles J.M., Smail I., Soucail G., Bridges T.J., 1999, A&A in press, astro-ph/9810390
- [Pelló et al. 1998b] Pelló R., Kneib J.P., Bruzual G.A., Miralles J.M., 1998b, in “The Birth of Galaxies”, 10th Rencontres de Blois, June 1998, Editions Frontières, astro-ph/9809151
- [Pozzetti et al. 1996] Pozzetti L., Bruzual G.A., Zamorani G., 1996, MNRAS, 281, 953
- [Smail et al. 1995] Smail I., Couch W.J., Ellis R.S., Sharples R.M., 1995, ApJ 440, 501
- [Smail et al. 1996] Smail, I., Dressler, A., Kneib, J.-P., Ellis, Richard S., Couch, Warrick J., Sharples, R.M., Oemler, A., 1996, ApJ, 469, 508.
- [Soucail et al. 1987] Soucail G., Fort B., Mellier Y., Picat J.P., 1987, A&A 187, L1
- [Soucail et al. 1988] Soucail G., Mellier Y., Fort B., Mathez G., Cailloux M., 1988, A&A, 191, L19
- [Soucail et al. 1998a] Soucail G., Kneib J.P., Picat J.P., Ellis R.S., 1998a, in “The Young Universe – Galaxy Formation and Evolution at Intermediate and High Redshift”, Monteporzio, September 1997. A.S.P. Conference Series, Eds S. D’Odorico, A. Fontana, E. Giallongo.
- [Taylor et al. 1998] Taylor A.N., Dye S., Braodhurst T.J., Benítez N., Van Kampen E., 1998, ApJ, 501, 539
- [Trager et al. 1997] Trager S.C., Faber S.M., Dressler A., Oemler A., 1997, ApJ, 485, 92
- [Wu & Hammer 1993] Wu X.P. & Hammer F., 1993, MNRAS, 262, 187