03 (11.01.2; 11.09.1; 11.19.3; 13.25.2)
Stefanie Komossa,
skomossa@xray.mpe.mpg.de
11institutetext:
Max-Planck-Institut für extraterrestrische Physik,
Postfach 1603, D-85740 Garching, Germany
22institutetext: Astronomisches Institut, Ruhr-Universität,
D-44780 Bochum, Germany
The ROSAT view of NGC 1365 and the luminous highly variable off-nuclear X-ray source NGC 1365–X1
Abstract
We present an X-ray spectral and spatial analysis of the composite starburst/Seyfert galaxy NGC 1365. Excellent fits of the ROSAT PSPC spectrum are obtained by combining a soft thermal component with a hard powerlaw. The hard component may be either seen directly or can be explained by scattering of the AGN powerlaw at circumnuclear warm high-column-density gas. A compilation of the multi-wavelength properties of NGC 1365 and comparison with hard X-ray selected AGNs shows that the hard component of NGC 1365 is too faint compared to its broad Balmer line components challenging simple unified models. According to analytical estimates, supernova driven outflow can fully account for the X-ray luminosity in the Raymond-Smith component if the observed IR emission is mainly provided by the central starburst. We do not find obvious optical counterparts for three faint PSPC sources south of the nucleus. In particular, there is no coincidence with the two supernovae reported in NGC 1365.
With the ROSAT HRI data, we have precisely located the extraordinary southwest X-ray source NGC 1365–X1 which falls on one of the subordinate spiral arms. The source is found to be highly variable (a factor 10) on the timescale of months. Intrinsic to NGC 1365, its huge luminosity makes it exceptional among stellar X-ray sources. At present, the most likely interpretation seems to be an ultra-powerful X-ray binary.
keywords:
Galaxies: active – Galaxies: starburst – Galaxies: individual: NGC 1365 – X-rays: galaxies1 Introduction
NGC 1365 is a prominent barred spiral in the southern hemisphere. Its nuclear and disk emission-line gas has been investigated in numerous optical studies (e.g., Burbidge & Burbidge 1960, Osmer et al. 1974, Veron et al. 1980, Alloin et al. 1981, Edmunds & Pagel 1982, Phillips et al. 1983, Jörsäter et al. 1984a,b, Teuben et al. 1986, Edmunds et al. 1988, Schulz et al. 1994, Roy & Walsh 1988, 1997). The presence of an AGN was first suggested by Veron et al. (1980) who found broad emission-line H indicative of a Seyfert-1.5 galaxy. The FWHM of the broad component is 1900 km/s (e.g., Schmitz 1996). Surprisingly, just in the nucleus identified by Edmunds & Pagel (1982), Seyfert-typical narrow-line emission line ratios are missing, probably due to an interference with HII regions. To the SE of the nucleus, [OIII] enhancements and occasional line splitting apparently related to the AGN are nevertheless present. They trace a wide cone reminiscent of the supposed radiation cones in Seyfert-2 objects (Jörsäter & Lindblad 1989, Storchi-Bergmann & Bonatto 1991, Kristen et al. 1997). Outflow cone models were employed to fit the kinematics in this region (Phillips et al. 1983, Edmunds et al. 1988, Hjelm & Lindblad 1996).
In the remaining circumnuclear emission-line region, HII region-like line ratios are common indicating widespread circumnuclear star formation. Two outstanding hot spots 7\arcsec SW of the center corroborate the starburst character. Sandqvist et al. (1995) mapped abundant molecular gas in the center which may provide the fuel for the birth of stars and which could have developed the molecular torus believed to be a prerequisite of Seyfert unification (Antonucci 1993).
Summarizing, optical studies suggest that the central region of NGC 1365 consists of an AGN of apparent low luminosity surrounded by a region of enhanced star formation. However, the relationship between the stellar and nonthermal activity and the geometry of the nucleus need further scrutiny.
X-rays are an important probe of the central activity. In AGNs, they are believed to arise in the innermost core. Interestingly, NGC 1365 lies deep within the narrow-line galaxies in a plot of versus (Green et al. 1992) although its Balmer lines have a conspicuous broad-line component signifying a class-1.5 Seyfert. In an early study of ROSAT PSPC X-ray spectra by Turner et al. (1993; TUM93 hereafter) a powerlaw fit was found to be unsatisfactory unless a line at 0.8 keV or a Raymond-Smith component was added. Recent detection of conspicuous FeK line emission in ASCA data by Iyomoto et al. (1997; I97 hereafter) supports the view that the hard X-rays trace genuine nonthermal activity in NGC 1365. In particular, the ASCA spectra revealed a striking similarity to those of NGC 1068, the prototype of a hidden class-1 Seyfert (Antonucci & Miller 1985).
In the present work, we perform a detailed analysis of all ROSAT X-ray observations of the core of NGC 1365 and an extraordinary off-nuclear X-ray source which we term NGC 1365–X1. This investigation includes new PSPC data and spectral models like a ‘warm reflector’, and the first high-spatial resolution X-ray study based on HRI observations retrieved from the archive.
Basic data of NGC 1365 are adopted from the compilation in Tab. 2 of Schulz et al. (1994): km/s implying a distance of 19.8 Mpc (linear scale 96 pc/\arcsec) with km/s/Mpc and the virgocentric model of Kraan-Korteweg (1986). Recent HST borne Cepheid data lead to an insignificantly smaller distance of Mpc (Madore et al. 1996, Silbermann et al. 1998). Jörsäter & van Moorsel (1995) found km/s and suggest a moderate revision of geometric data (PA of line of nodes and value of inclination).
The paper is organized as follows: In Sect. 2 the X-ray spectrum of the nuclear source is analyzed while in Sect. 3 the high-spatial-resolution HRI data revealing the core source and the variable enigmatic source NGC 1365–X1 are presented. In Sect. 4, the properties of NGC 1365–X1 are investigated in more detail. The nature of the sources is discussed in Sect. 5 which is followed by the concluding summary in Sect. 6.
2 Data analysis – PSPC
2.1 Data reduction
NGC 1365 is serendipituously located in the field of view of a ROSAT (Trümper 1983) PSPC (Pfeffermann et al. 1987) observation performed from Jan. 30 – Feb. 2, 1993. The total exposure time is 7.4 ksec. The source is located at an off-axis angle of 30\arcmin.
For further analysis, the source photons were extracted within a circular cell of radius 4\arcmin centered on the core of NGC 1365. The background was determined in a source-free region near the target source and subtracted. The data were corrected for vignetting and dead-time, using the EXSAS software package (Zimmermann et al. 1994a). The mean source countrate is cts/s.
To carry out the spectral analysis source photons in the amplitude channels 11-240 were binned according to a constant signal/noise ratio of 5.
| date | obs. label | |||
|---|---|---|---|---|
| PSPC | ||||
| Jan 30 - Feb 2, 1993 | 7.4 | 0.102 | –∗ | PSPC-1 |
| Feb 5 - Feb 10 | 7.7 | 0.096 | 0.005 | PSPC-2 |
| HRI | ||||
| Jul 20 - Aug 4, 1994 | 9.8 | 0.020 | 0.0026 | HRI-1 |
| Jul 4 - Jul 5, 1995 | 9.8 | 0.018 | 0.001 | HRI-2 |
∗ not resolved well enough in this off-axis observation; thus, no countrate for NGC 1365-X1 was determined
2.2 Spectral analysis
A single powerlaw (PL) provides a marginally successful fit to the X-ray spectrum ( = 1.2) with a photon index , a 1-keV normalization of ph/cm2/s/keV, and cold absorption of cm-2 which is larger than the Galactic value in the direction of NGC 1365, cm-2 (Dickey & Lockman 1990). The fit becomes worse if we fix the cold absorption to the Galactic value ( = 3.1). The PL fit leaves systematic residuals around 0.6–1 keV. This new observation confirms the results of TUM93, who analyzed a different PSPC observation and tentatively invoked a line of high equivalent width at 0.8 keV. (Re-analyzing this latter data set, using the same data reduction techniques as in the observation presented above and the same powerlaw model, we find both spectra to be consistent with each other.)
| model | Normpl | ||||
|---|---|---|---|---|---|
| 1021 cm-2 | (3) | keV | |||
| PL | 0.8 | 4.4 10-4 | – | 1.2 | |
| RS | 0.1351 | – | – | 1.2 | 1.5 |
| RS2 | 0.22 | – | – | 1.1 | 0.9 |
| RS+PL-1.9 | 0.1351 | 9.9 10-5 | 0.95 | 0.9 | |
| RS+PL-1.0 | 0.1351 | 1.7 10-4 | 0.72 | 0.5 | |
| RS+RS | 0.1351 | – | – | 0.7/6.3 | 0.5 |
(1) fixed;
(2) abundances of 0.2 cosmic; (3) PL normalization
at 1 keV in ph/cm2/s/keV
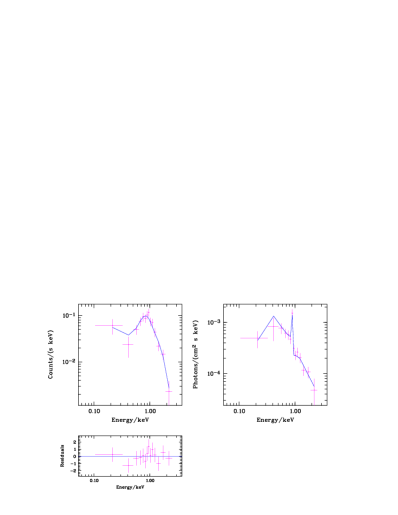
We then applied models involving emission from a Raymond-Smith (RS) plasma. If not noted otherwise, cosmic abundances (Allen 1973) were assumed throughout as further justified in Sect. 5. A one-component RS model yields an inferior fit, with = 1.5. The quality of the fit can be improved by allowing for low metal abundances. Fixing them to 0.2 cosmic leads to = 1.1 keV, = cm-2, and = 0.9.
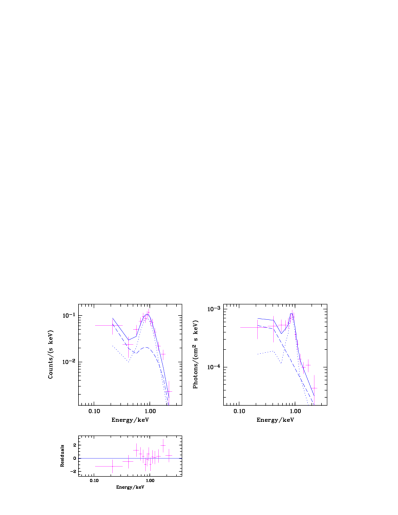
In the next step, two-component models were compared with the data. Both, a two-temperature RS model, and a RS+PL model provide excellent descriptions of the data. For the RS+RS model (and fixed to the Galactic value), we derive temperatures of 0.7 keV and 6.3 keV, with the hotter component dominating in flux ( = 0.5). For the RS+PL description ( and photon index fixed) we find a temperature of 0.95 keV ( = 0.9). Treating as additional free parameter results in a value slightly larger than the Galactic value, but consistent with the latter within the errors. The residuals for this model are shown in Fig. 1. If we invoke a flatter underlying powerlaw spectrum, the temperature of the RS component slightly decreases. E.g., for (about the value found in one of the fits in I97) and we get keV and . The temperature rises somewhat, and the relative contribution of the RS component increases, if we allow for non-cosmic abundances (e.g., = 1.0 keV and = 0.9 for metal abundances of 0.3 cosmic).
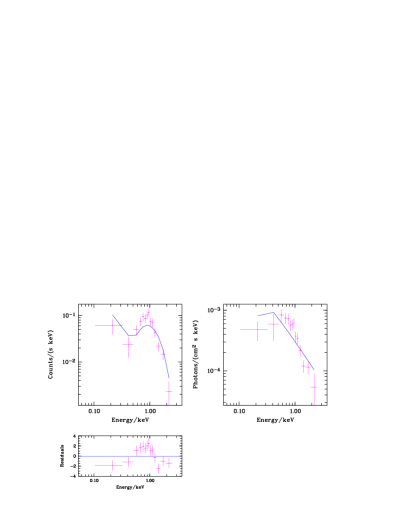
Finally, we checked whether the data can be described in terms of a lowly-ionized warm absorber, or a dusty warm absorber, or a warm reflector (the models were calculated with Ferland’s (1993) code Cloudy; for assumptions and a detailed description see Komossa & Fink 1997a,b). Warm absorbers of low ionization or dusty ones imprint spectral signatures mainly at low energies beyond the ASCA sensitivity range (e.g., a carbon absorption edge at 0.3 keV). The underlying powerlaw index was fixed to the canonical Seyfert value of ; solar abundances were adopted. Whereas a warm absorber seen purely in absorption does not give a successful spectral fit, one in reflection provides an excellent description of the data. The column density of the warm material is of order cm-2 and the ionization parameter111 the ionization parameter is defined as , where is the number rate of photons above 13.6 eV, is the distance nucleus – warm absorber and the hydrogen density ( = 0.6; the fit residuals are displayed in Fig. 1). The model is very similar to the scattering model that we applied to the X-ray spectrum of NGC 6240 in Komossa et al. (1998).
2.3 Temporal analysis
The PSPC X-ray lightcurve of NGC 1365 was derived. The X-ray emission is found to be constant. In the ROSAT all-sky survey, NGC 1365 was detected with a countrate of 0.09 cts/s, within the errors consistent with the value of the pointed observations carried out later.
2.4 Spatial analysis
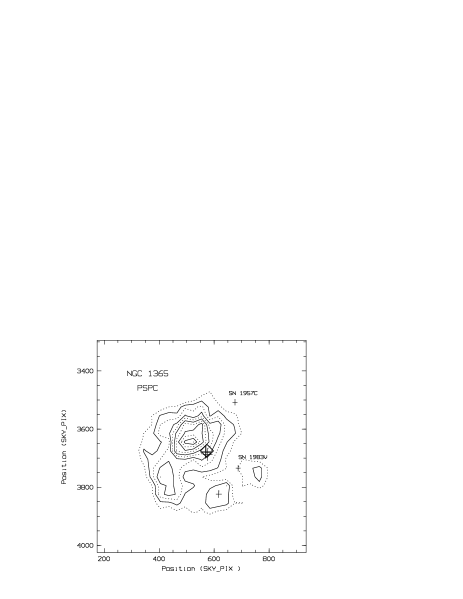
Fig. 2 shows the PSPC X-ray contours for the emission from the direction of NGC 1365. Four sources are detected, three of them very weak. None of them coincides with any of the two supernovae reported in NGC 1365, SN 1957C and SN 1983V, but we note that ‘companion 4’ of TUM93 (their Tab. 2A, 2B) is at 16\arcsec20\arcsec distance to SN 1957C (cf. Fig. 3 of Komossa & Schulz 1998). Several source positions are marked in Fig. 2, including that of the enigmatic source NGC 1365–X1.
Whereas the X-ray emission maximum of the HRI observations and a second PSPC observation (see below) coincide well with the optical position of the nucleus, the maximum in the present PSPC observation shows a slight off-set. This can be traced back to the known boresight error of the telescope (e.g. Briel et al. 1994).
3 Data analysis – HRI
3.1 Data reduction
The region around NGC 1365 was observed twice with the HRI, from July 20 – August 4, 1994 (labeled HRI-1 hereafter) and July 4 – 5, 1995 (HRI-2) with an exposure time of 9.8 ksec each. Both observations are centered on NGC 1365. Nine X-ray sources are detected with a likelihood within the field of view in the first observation, eight sources in the second. Here, we focus on emission from the core of NGC 1365 and the off-nuclear bright source RX J0333 –3609, hereafter referred to as NGC 1365–X1. Determining the background in source-free regions near the target sources, we find background-corrected mean source countrates of 0.020 cts/s and 0.018 cts/s for NGC 1365 for HRI-1 and HRI-2, respectively. NGC 1365–X1 is only detected in the first observation, with a countrate of 0.0026 cts/s. In the second observation, we estimate an upper limit on the countrate of 0.001 cts/s.
We also re-analyzed another PSPC observation of 7.7 ksec duration (previously presented in TUM93; these data are referred to as ‘PSPC-2’ hereafter) to check for the presence and brightness of NGC 1365–X1. We clearly detect this source (note that it is none of the sources reported in TUM93; their Tab. 2B) and derive a countrate of 0.005 cts/s.
3.2 Spatial analysis
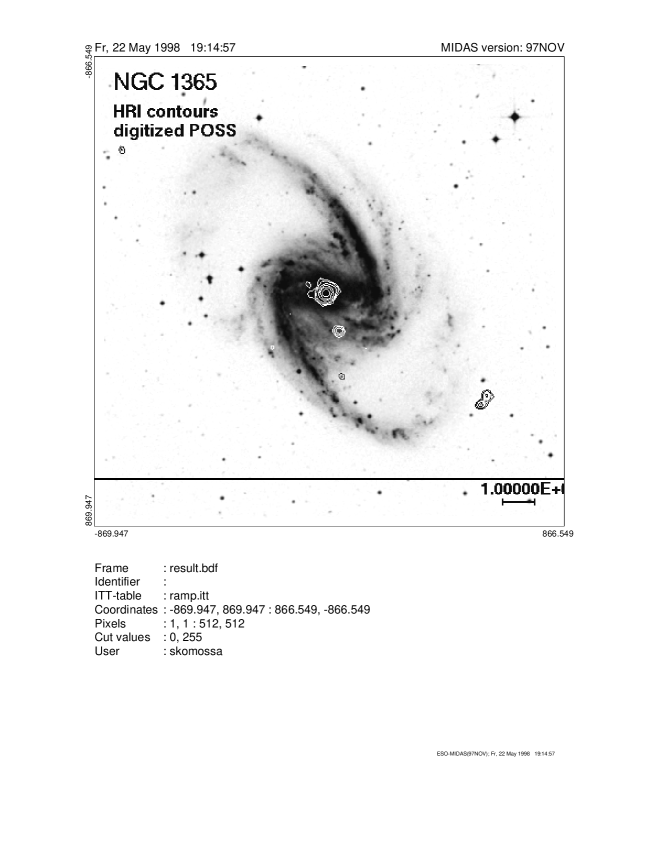
In the HRI observation the two strongest central sources are clearly separated for the first time. The stronger one coincides well with the nucleus of NGC 1365, the other source, NGC 1365 – X1, lies to the south of the bar within or projected onto one of the ‘side’ spiral arms (Fig. 4).
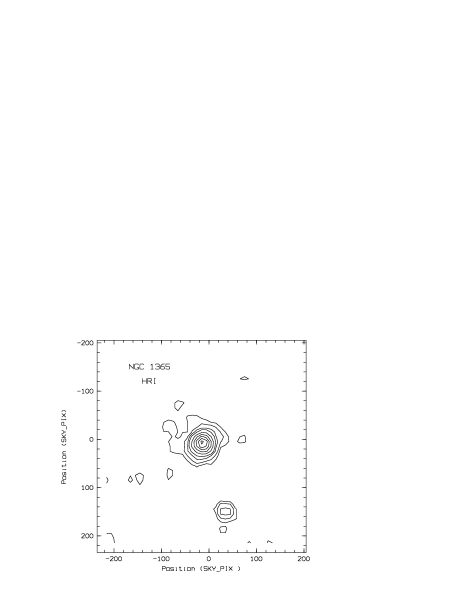
The X-ray positions of the nuclear source (J 2000) are (HRI-1) and (HRI-2), which compares to the position of the optical nucleus at taken from NED. The coordinates of the X-ray emission maximum of NGC 1365–X1 are (HRI-1).
A contour plot of the X-ray emission traced by the HRI is shown in Fig. 3 (see also Fig. 4). Due to its higher spatial resolution the HRI contours reveal well separated sources. Because of the HRI’s lower sensitivity, some of the faint extranuclear PSPC sources are undetected. ‘Companion 2’ of TUM93 is clearly resolved in two sources (Fig. 4). Although the core source seems to be extended on weak emission levels, the presumably pointlike BL Lac object in the field of view shows similar deviations from the instrumental PSF. A deeper observation with, e.g., AXAF would be needed to assess if part of the core emission is extended.
We note in passing that NGC 1365–X1 lies on a line connecting the nuclear source and the X-ray bright BL Lac object MS 03313-36; several further sources are ‘aligned’ relative to the core source (cf. Fig. 3 of Komossa & Schulz 1998; for a discussion of aligned X-ray sources in/around nearby galaxies see e.g. Arp 1997, Radecke 1997).
3.3 Temporal analysis
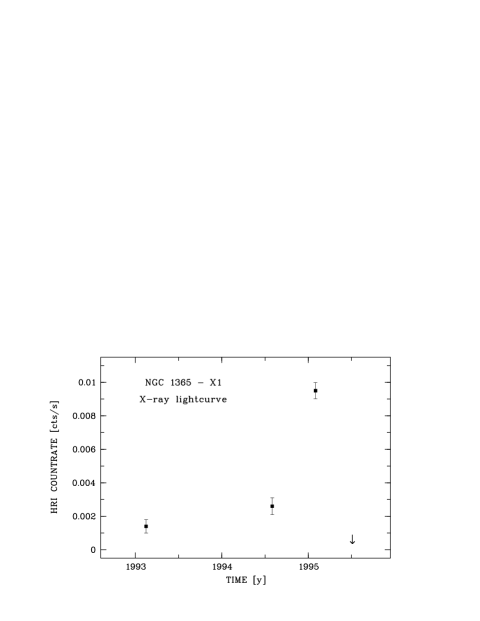
We produced long- and short-term X-ray lightcurves for both sources. Whereas the emission from the core of NGC 1365 and NGC 1365–X1 is constant within the errors on short timescales, that of NGC 1365–X1 is strongly variable on a longer timescale. A clear detection during the first HRI observation in 1994 was followed by a non-detection one year later implying a countrate drop by more than a factor 2. For a comparison of the HRI counts with the PSPC and ASCA data, we converted the counts from the latter instruments to equivalent ROSAT HRI counts, assuming a spectral shape as estimated in I97 ( and their Galactic = 0.15 1021 cm-2; see also our Sect. 4). The following countrates are obtained: = 0.0014 (PSPC-2; 2/1993), 0.0026 (HRI-1; 7/94), 0.0095 (ASCA; 1/95), 0.001 cts/s (HRI-2; 7/95).
So far, the highest known state, corresponding to an isotropic luminosity of erg/s at the distance of NGC 1365, was reached during the ASCA observation (I97). Half a year later, during the HRI-2 observation, the source had dropped by a factor 10 as compared to the ‘high state’. The X-ray lightcurve is displayed in Fig. 5.
4 NGC 1365–X1: Safety checks
Given the extraordinary properties of NGC 1365–X1, we made several checks to test the robustness of the results (concerning amplitude of variability, derived luminosity, assumed spectrum):
(i) First, we note, that measurements with the same instrument under similar conditions exhibit clear variability of the source: It is only detected in one out of the two HRI observations which have the same exposure time and pointing direction. NGC 1365–X1 is immediately visible in the first exposure, but absent in the second. A similar argument holds for the two ASCA observations of I97.
(ii) The total amplitude of variability depends on the inter-instrument countrate conversion (from ASCA -SIS to ROSAT -HRI). To test the reliability of the conversion, we also converted the ASCA countrate of the central source (which did not show variability during the ROSAT or the ASCA observations) to HRI countrate and we find good agreement. (Explicitly, starting with CR = 0.023 cts/s (ASCA SIS) and assuming constant spectral shape (we used the RS model), we derive = 0.017, in agreement with the observed value of 0.019.)
(iii) The luminosity of the source depends on the assumed spectral shape and is particularly sensitive to the value of cold absorption. I97 used the Galactic only, which corresponds to a lower limit on source luminosity. To get a crude spectral shape in the ROSAT band, we used the on-axis PSPC observation (PSPC-2) and extracted source photons in a circle around NGC 1365–X1. A potential problem is the closeness to the nuclear source, and the weakness of the target source. Clearly aware of being at the limit of the applicability of the chi-square fit procedure, we fit a powerlaw to the source spectrum. In a first step, we fixed to the Galactic value. We derived a photon index of which is in good agreement with the ASCA value of . We then repeated the spectral fit for a second background region; the results are the same within the errors. This insensitivity to the background chosen also implies that a potential contribution to the X-ray spectrum from other spiral arm sources in NGC 1365 or weak extended emission from the Fornax cluster is negligible.
We note that the observed (isotropic) high-state luminosity is a lower limit to the total luminosity (except if dominated by beaming) since the source may not have been observed exactly at maximum light, and the X-ray spectrum may extend into the EUV and/or have a soft excess added.
(iv) Finally, we recall that a foreground or background object can not be ruled out at present. We consider this unlikely, though, due to the following reasons: (a) bright off-nuclear X-ray sources are being observed in more and more nearby galaxies (the present case just seems to be an extreme one); (b) foreground object (e.g. a Galactic X-ray binary): Given the high Galactic lattitude of NGC 1365 () a chance coincidence has a low probability; (c) background quasar: located behind the dusty/gaseous spiral arm seen at the position of NGC 1365–X1, the cold absorbing column in the direction of a background object should significantly exceed the Galactic value. However, the source is separately detected in the soft (below 1 keV) and the hard band. We again used the crude PSPC spectrum described above, fixed = –1.9 and treated as free parameter for an order-of-magnitude estimate of its value. This yields cm-2 and is consistent with the Galactic value or only slightly larger. Again, we repeated the spectral fit for the second background region and get the same results within the errors.
| HRI position (J 2000) |
| spectral properties |
| for , erg/s (PSPC low-state) |
| variability |
| amplitude factor 10, within 6 months |
5 Discussion
5.1 The core source
5.1.1 Soft X-ray spectrum – spectral fits
A description of the soft X-ray spectrum in terms of a single PL (Sect. 2.1, see also Fig. 1) leaves systematic residuals suggesting the presence of a thermal component. Unless metal abundances are strongly reduced (a factor relative to cosmic) a single RS model is unfeasible as well. All evidence from HII regions in NGC 1365 (Alloin et al. 1981, Roy & Walsh 1988, Zaritsky et al. 1994, Roy& Walsh 1997) leads to an O/H and N/H of above-solar or close-to-solar values in the center and a slight decrease outwards. The shallowness of the gradient is explained by bar-induced strong mixing of the gas. Hence, strongly depleted metal abundances in the central X-ray gas are unexpected so that the successful metal-reduced single-RS fit is considered as an unlikely solution.222For a recent discussion of the issue of single-component X-ray spectral models of very subsolar abundances vs. two-component models of solar abundances see also Buote & Fabian (1998).
In addition, the requirement of at least two components is in agreement with the ASCA data analysis by I97. Beyond the ROSAT band they found a significant hard component which shows up as a very hot RS component ( keV) in our RS+RS fit or is consistent with either a canonical PL () plus a hot RS (1 keV) or a flat () PL and a ‘moderate’ RS temperature (0.7 keV) in our RS+PL fits. A warm-absorber model seen purely in absorption did not fit the spectrum, either suggesting the lack of highly ionized gas directly along the l.o.s or a very high column density.
Aside from the amount of cold absorption, the two-component fits and the AGN warm-scatterer model (Sect. 2.1) are strikingly similar to our results for the ultraluminous IR galaxy NGC 6240 (Schulz et al. 1998, Komossa et al. 1998) in which we proposed an AGN contribution in soft X rays. For NGC 1365, however, one of the arguments, the huge luminosity, cannot be used against generation of the total X-ray flux in a starburst induced scenario. Our RS+PL model fit of the core source yields erg/s ( erg/s) for free (fixed to ). This is at least twenty (more likely more than forty) times less luminous than the central source of NGC 6240.
In the following, to ease the luminosity demands, we use the solution for of which the RS contribution is erg/s or 52% of the total. The simplest idea one can have is to attribute the thermal RS component to a starburst source and the PL to the AGN which means that they contribute in equal proportions in the ROSAT band. We take these numbers as a working hypothesis clearly having in mind that a precise decomposition is not possible at the present stage of measurement resolution and theory.
5.1.2 Clues from IRAS color indices
Are we able to constrain the relative amounts of the AGN and starburst contribution via multi-wavelength properties of NGC 1365? Firstly, we formed IR gradients from the IRAS flux densities (labeled by wavelength: Jy, Jy, Jy (; retrieved from NED) at and 100m and checked the location of NGC 1365 in the diagram. Samples of Seyfert class-1, class-2 and HII-type objects in this diagram are shown in Miley et al. (1985) and Mulchaey et al. (1994). With and , NGC 1365 lies in a region mainly occupied by HII-galaxies and Seyfert-2 galaxies. The slope indices signify dominating flux at smaller wavelengths (‘warm’ dust components), warmer than typical Seyfert-1s in the mid-IR (25,60) and warmer than the average of HII region type galaxies in the far IR (100,60), making the FIR cool dust component (that dominates in normal spirals) insignificant. Altogether this suggests that the IR emission comes from the central region where the AGN and relatively young star formation components contribute a substantial portion of the observed IR emission in NGC 1365.
Its more X-ray and IR-luminous sister NGC 6240 contains a much stronger cool-dust FIR-component () but has nearly the same gradient in the mid-IR ().
Putting NGC 1365 with into the scheme of Heisler et al. (1997) shows a discrepancy. This scheme assumes that objects with (cold mid-IR, more edge-on view of torus) should not even show a ‘hidden’ BLR. But NGC 1365 clearly exhibits broad Balmer lines. Converting the ratio into a power-law index (4 corresponds to ) and checking Mulchaey’s et al. (1994) plot of versus shows that at least six broad-line objects lie in Heisler’s et al. (1997) regime, where the edge-on view on the torus should hide the BLR.
5.1.3 Starburst contribution, superwind estimate
A 100\degr wide [OIII] enhanced region with line-splitting to the SE of the nucleus (Phillips et al. 1983, Jörsäter & Lindblad 1989) was kinematically modelled as an outflow cone by Hjelm & Lindblad (1996). This could be a Seyfert outflow, driven by a wind from the active core, or a starburst outflow, driven by a series of supernova explosions. Assuming that the outflow region evolved from a wind-driven supershell of swept-up ISM we can use the MacLow & McCray (1988) analytical model (as e.g. applied by Heckman et al. (1996) to Arp 220 and Schulz et al. (1998) to NGC 6240) for relating (generated in the shell and the bubble interior to it) to the mechanical input power . If starburst driven, this can be derived from the SN rate by scaling the power of one SN per yr, erg/s. Kristen et al. (1997) estimate SN/yr for each of the two dominating brightest starburst knots 7\arcsec to the SW of the nucleus. The nucleus has the same -band brightness as one of these knots and may contain an equally strong mini burst plus the AGN.
As will be shown in Sect. 5.1.4, the optically detected AGN could only provide a few percent of the IR. Assuming that starformation takes care of the rest we take the IRAS erg/s as an estimate for the bolometric luminosity of the starburst for which models from Gehrz et al. (1983) predict a SN rate between 0.01 and 1 yr-1 (depending on the IMF and the lower and upper mass limits) and in the range erg/s of which Kristen et al. see only erg/s in the central region. Hence, 90% to 99% of the H emitters ionized by young stars are hidden. Could this hidden burst supply the X-rays in a wind driven shell? From the velocity field in Hjelm & Lindblad (1996) we read off a radius kpc with a corresponding velocity km/s. With the thermal RS X-ray luminosity of erg/s we get the following solution of the MacLow-McCray equations given in scaled form as in Schulz et al. (1998):
| (1) |
| (2) |
| (3) |
Here, corresponds to erg/s or a SN rate of 0.015 yr-1 which is consistent with the Gehrz et al. starburst models. The expansion time corresponding to yrs and the density (1.2 cm-3) are reasonable for the central region of this strong bar.
We conclude that this crude scenario can account for the observed thermal X-ray luminosity if more than 90% of the ionized gas emitting optical lines in the starburst region is obscured. Due to less clear constraints an analogous estimate for an AGN wind is not attempted.
5.1.4 AGN contribution, IR-optical-X relations
We now compare the data with the sample of hard X-ray detected AGN from Piccinotti et al. (1982). Concerning the two excellent AGN tracers broad lines and hard X-rays this sample is homogeneous and comprises QSOs, Seyfert-1 galaxies and broad-line radio galaxies so that contributions by starburst components are minimized. For the Piccinotti sample, Ward et al. (1988) showed that the luminosities (determined for km/s/Mpc) of hard X-rays, H and mid-IR-radiation333Ward et al. (1988) derived the IR “luminosity” from the flux parameter are well correlated (their Figs. 5 and 6). We represent their results by the relations
| (4) |
The scatter in the ordinate is for both relations.
For NGC 1365 these quantities are observed to be (cgs-quantities scaled to =50 for the comparison): (from I97); (broad component measured by Schulz et al. 1994); (derived from IRAS data given by NED). It turns out that these combinations of data do not fit the relations of the Piccinotti sample for which we assume that it defines ‘pure’ AGN properties. E.g., if the hard X-rays come from the AGN in NGC 1365 we would expect which is only 0.43% of the observed 44.87. The remaining IR could either be attributed to star formation or the source for the hard 2-10 keV photons is for a large part obscured which would, however, require column densities exceeding cm-2.
Utilizing the first Piccinotti-sample relation of Eq. 4, the X-rays predict , only 8.3% of the observed 40.82. The data were taken at different epochs, so variability cannot be excluded to explain part of the discrepancy. However, the data for the Piccinotti sample were collected non-simultaneously as well and their total scatter corresponds to only a factor four. Another possibiIity would be some arrangement of obscuring material in front of the X-ray source or/and the BLR possibly combined with scattering elsewhere. Compton thick and Balmer electron-scattering highly ionized thick columns might as well be envisioned in the extreme environment of the nucleus, but detailed models are beyond the scope of this work. Taking H as representative for the AGN, , i.e. ten times the observed hard X-ray luminosity, and , i.e. 2.5% of the observed mid-IR, would be predicted. This type of solution would fit to our warm scatterer model (last model in Sect. 2.2) which could explain both the hard PSPC (and ASCA) PL-like component and the high equivalent width of the FeK complex (like in NGC 6240, see Komossa et al. 1998).
A crude upper limit for the contribution from a stationary AGN would be one that dominates the mid-infrared, leading to the prediction of = 44.22 and 43.05 for the hard X-ray and H luminosities, respectively. In this case, the corresponding observed (see above) hard X-rays and H luminosities are 0.06% of the predicted ones requiring esentially complete obscuration of the emission-line and hard X-ray sources. Such an extreme situation appears to be ruled out for NGC 1365 because star formation is spatially extended over a diameter of and will provide an appreciable part of the IR.
5.1.5 Place within the unified model
NGC 1365 does not fulfill expectations of the simplest version of the unified model in which only the torus blocks the light and detection of a BLR would imply an unobscured view of the X-ray source as well. Complicated models appear to be necessary to let this AGN be an intrinsically normal broad-line object. Other, currently vague, possibilities would be that the AGN in NGC 1365 as a low-luminosity object is qualitatively different from the Piccinotti objects or that this object is an example for non-mainstream scenarios, like the starburst-AGN models developed by Terlevich et al. (1992). However, such models have not yet been worked out to satisfactorily account for the hard X-ray data.
5.2 The bright and highly variable off-nuclear source NGC 1365–X1
NGC 1365–X1 is a bright X-ray source. The excellent spatial resolution of the ROSAT HRI locates it on one of the spiral arms of NGC 1365. The source is highly variable on the timescale of months.
In Sect. 4 we already gave cautious comments on the possibility of a foreground or background source and considered it unlikely. In the following discussion, we assume the source to be intrinsic to NGC 1365. In this case, NGC 1365–X1 is one of the brightest off-nuclear point sources known, with an isotropic luminosity of erg/s (for Mpc) in the source’s observed high-state.
Off-nuclear X-ray sources, some of them variable, are frequently discovered in nearby galaxies (e.g. Fabbiano 1989, Vogler 1997; Turner et al. 1993, Ehle et al. 1995, Brandt et al. 1996, Vogler et al. 1997, Supper et al. 1997, Immler et al. 1998). Their X-ray luminosities are typically of order 1038 erg/s up to several 1039 erg/s. Among the most X-ray bright observed sources in other galaxies are supernovae (of type II; see e.g. the review by Schlegel 1995). The reported maximum X-ray luminosities range between several 1039 erg/s (e.g. SN 1993J, Zimmermann et al. 1994b; SN 1979C, Immler et al. 1998) and 3 1040 erg/s (SN 1986J, Bregman & Pildis 1992; all luminosities are as given by the authors). On long timescales, variability is detected in some SN (cf. Schlegel 1995). Within our Galaxy, one of the most luminous individual X-ray emitters is the superluminal-motion source GRS 1915+105 with erg/s (daily average during high-states) and peak luminosities up to erg/s (on a timescale of seconds; Greiner et al. 1998).
NGC 1365–X1 is exceptionally luminous. Its temporal variability excludes an interpretation in terms of several spatially unresolved weak sources. Another definitely bright ( erg/s) source was found by Vogler et al. (1997) in an outer spiral arm of NGC 4559. They suggested an interpretation in terms of a ‘buried supernova’. In contrast to NGC 1365–X1, this source did not show any X-ray variability. Although a supernova in dense medium is an efficient way to reach high X-ray luminosities (e.g. Shull 1980, Wheeler et al. 1980, Terlevich et al. 1992), the huge variability on the timescale of months we detect seems to favour an interpretation in terms of accretion onto a compact object. The amplitude and rapidity of variability share similarity with the off-nuclear source in NGC 4945 reported by Brandt et al. (1996). However, the present case is much more powerful, by at least a factor of 16 in luminosity.444They observe erg/s in the 0.8–2.4 keV band, NGC 1365–X1 shows erg/s in the same band.
At present, the most likely interpretation seems to be an ultra-powerful X-ray binary, with either a highly super-eddington low-mass black hole or a very massive black hole. The hard powerlaw component derived from the ROSAT and ASCA spectral fits is known to be present in Galactic X-ray binaries (see Tanaka 1997 for a recent review); they have soft-excesses added in their high-states. In case the accretion is not super-eddington, a rather high-mass black hole of 100–200 M⊙ is inferred which may pose a challenge for stellar evolution models.
6 Summary and conclusions
We studied the nuclear and circumnuclear X-ray emission of NGC 1365 using ROSAT PSPC and HRI observations. The HRI image shows compact emission from the nucleus, from the highly variable southwestern source, and resolves the source just outside the SW spiral arm into a double source.
The analysis of the spectral
and temporal X-ray properties
of the nucleus of NGC 1365 and the
enigmatic source RX J0333-3609 = NGC 1365–X1 is summarized as follows:
The core of NGC 1365. To describe the X-ray spectrum, we favour a two-component model consisting of about equally strong contributions from a Raymond-Smith (RS) plasma (with cosmic abundances) and a powerlaw. Although a single RS model yields a successful spectral fit as well, it requires heavily depleted metal abundances which seems to be in contradiction to optical observations. The powerlaw component signifies the presence of a hard component not common in simple starbursts; this hard component as well as an FeK line is also present in ASCA data of I97 strengthening the view that it arises in the AGN.
The thermal RS part of the X-ray spectrum is found to be consistent with being produced in starburst-induced superwind shocks if the starburst dominates the mid to far IR and its H emitters are largely hidden.
A detailed comparison of the X-ray properties with multi-wavelength observations of NGC 1365 and a large sample of type-I AGNs was performed. We find that, if the hard X rays (2–10 keV) or the broad H are representative tracers of the active nucleus in NGC 1365, they can only account for a minute amount of the IR; or, conversely, if the IR were due to dust heating by the AGN, the latter has to be essentially completely hidden. This and the large extent of the starformation region support the view that the IR is starburst dominated although emission-line H from the starburst has to be largely obscured as well.
A puzzle is the low X-ray luminosity of NGC 1365
as compared to the strength of the BLR Balmer line component;
this poses a problem for the simplest version of the
unified model.
In particular, a comparison with the
Piccinotti sample of type-1 AGNs strengthens the view that we see
scattered X-rays in the 2–10 keV range. This
is in line with our alternative successful X-ray spectral model of
a warm scatterer; highly photoionized and high column density material close to
the AGN continuum source.
Such a scenario, as alternative to a low-luminosity AGN viewed directly,
still requires a peculiar viewing geometry to simultaneously
explain the observed strength of the broad lines.
NGC 1365–X1. Attributed to NGC 1365, this source is among the most luminous ( several 1040 erg/s) and most highly variable (factor 10 within 6 months) off-nuclear X-ray sources known so far. At present, the most likely interpretation seems to be an ultra-powerful X-ray binary. If this interpretation is confirmed, this or similar X-ray sources in nearby galaxies will be important probes for the extremes of stellar evolution. Further monitoring of NGC 1365–X1, and derivation of improved spectral information will certainly be worthwhile.
Acknowledgements.
St.K. acknowledges support from the Verbundforschung under grant No. 50 OR 93065. It is a pleasure to thank Per Olof Lindblad for helpful comments and suggestions. The ROSAT project is supported by the German Bundesministerium für Bildung, Wissenschaft, Forschung und Technologie (BMBF/DLR) and the Max-Planck-Society. We thank Gary Ferland for supplying Cloudy, and Andreas Vogler for providing the software to plot the overlay contours of Fig. 4. The optical image shown is based on photographic data of the National Geographic Society – Palomar Observatory Sky Survey (NGS-POSS). This research has made use of the NASA/IPAC extragalactic database (NED) which is operated by the Jet Propulsion Laboratory, Caltech, under contract with the National Aeronautics and Space Administration.References
- [1] Allen C.W., 1973, Astrophysical Quantities, 3rd ed., London: The Athlone Press
- [2] Alloin D., Edmunds M.G., Lindblad P.O., Pagel B.E.J., 1981, A&A 101, 377
- [3] Antonucci R., 1993, ARA&A 31, 473
- [4] Anonucci R., Miller J.S., 1985, ApJ 297, 621
- [5] Arp H., 1997, A&A 319, 33
- [6] Brandt W.N., Iwasawa K., Reynolds C.S., 1996, MNRAS 281, L41
- [7] Bregman J.N., Pildis R.A., 1992, ApJ 398, L107
- [8] Briel U., Aschenbach B., Hasinger G. et al., 1994, ROSAT user’s handbook
- [9] Burbidge E.M., Burbidge G.R., 1960, ApJ 132, 30
- [10] Buote D.A., Fabian A.C., 1998, MNRAS 296, 977
- [11] Dickey J.M., Lockman F.J., 1990, ARA&A, 28, 215
- [12] Edmunds M.G., Pagel B.E.J., 1982, MNRAS 198, 1089
- [13] Edmunds M.G., Taylor K., Turtle A.J., 1988, MNRAS 234, 155
- [14] Ehle M., Pietsch W., Beck R., 1995, A&A 295, 289
- [15] Fabbiano G., 1989, ARA&A 27, 87
- [16] Ferland G., 1993, University of Kentucky, Physics Department, Internal Report
- [17] Gehrz R.D., Sramek R.A., Weedman D.W., 1983, ApJ 267, 551
- [18] Green P.J., Anderson S.F., Ward M.J., 1992, MNRAS 254, 30
- [19] Greiner J., Morgan E.H., Remillard R.A., 1998, in Frascati workshop on Multifrequency behaviour of high energy cosmic sources, eds. F. Giovanelli and L. Sabau-Graziati, Mem. Soc. Astron. Ital. 1998, in press (http://www.obs.aip.de/ jcg/publis.html)
- [20] Heckman D.M., Dahlem M., Eales S.A., Fabbiano G., Weaver K., 1996, ApJ 457, 616
- [21] Heisler Ch.A., Lumsden S.L., Balley, J.A. 1997, Nat 385, 700
- [22] Hjelm M., Lindblad P.O., 1996, A&A 305, 727
- [23] Immler S., Pietsch W., Aschenbach B., 1998, A&A in press (MPE Preprint 427)
- [24] Iyomoto N., Makishima K., Fukazawa Y., et al., 1997, PASJ 49, 425 (I97)
- [25] Jörsäter S., Peterson C.J., Lindblad P.O., Boksenberg A., 1984a, A&AS 58, 507
- [26] Jörsäter S., Lindblad P.O., Boksenberg A., 1984b, A&A 140, 288
- [27] Jörsäter S., Lindblad P.O., 1989, in Extranuclear Activity in Galaxies, E.J.A. Meurs & R.A.E. Fosbury (eds.), ESO Conf. Proc. 32, 39
- [28] Jörsäter S., van Moorsel G., 1995, AJ 110, 2037
- [29] Komossa S., Fink H., 1997a, A&A 322, 719
- [30] Komossa S., Fink H., 1997b, A&A 327, 483
- [31] Komossa S., Schulz H., 1998, in Highlights in X-ray Astronomy, Aschenbach et al. (eds.), MPE Report, in press
- [32] Komossa S., Schulz H., Greiner J., 1998, A&A 334, 110
- [33] Kraan-Korteweg R.C., 1986, A&AS 66, 255
- [34] Kristen H., Jörsäter S., Lindblad P.O., Boksenberg A., 1997, A&A 328, 483
- [35] Madore B.F., Freedman W.L., Kennicut R.C., Mould J.R., Ferrarese L. et al. 1996, BAAS 28, 1420
- [36] Mac Low M.-M., McCray R., 1988, ApJ 324,776
- [37] Miley G.K., Neugebauer G., Soifer B.T., 1985, ApJ 293, L11
- [38] Mulchaey J.S., Koratkar A., Ward M.J. et al., 1994, ApJ 436, 586
- [39] Osmer P.S., Smith M.G., Weedman D.W., 1974, ApJ 192, 279
- [40] Phillips M.M., Turtle A.J., Edmunds M.G., Pagel B.E.J., 1983, MNRAS 203, 759
- [41] Piccinotti G., Mushotzky R.F., Boldt E.A., et al., 1982, ApJ 253, 485
- [42] Pfeffermann E., Briel U.G., Hippmann H., et al., 1987, SPIE 733, 519
- [43] Radecke H.-D., 1997, A&A 319, 18
- [44] Roy J.-R., Walsh J.R., 1988, MNRAS 234, 977
- [45] Roy J.-R., Walsh J.R., 1997, MNRAS 288, 715
- [46] Sandqvist Aa., Jörsäter S., Lindblad P.O., 1995, A&A 295, 585
- [47] Schlegel E.M., 1995, Rep. Prog. Phys. 58, 1375
- [48] Schmitz C., 1996, Diplom thesis, Ruhr-Univ. Bochum
- [49] Schulz H., Knake A., Schmidt-Kaler T., 1994, A&A 288, 425
- [50] Schulz H., Komossa S., Berghöfer T., Boer B., 1998, A&A 330, 823
- [51] Shull J.M., 1980, ApJ 237, 769
- [52] Silbermann N.A., Harding P., Ferrarese L. et al., 1998, astro-ph/9806017, to appear in ApJ
- [53] Storchi-Bergmann T., Bonatto C.J., 1991, MNRAS 250, 138
- [54] Supper R., Hasinger G., Pietsch W. et al., 1997, A&A 317, 328
- [55] Tanaka Y., 1997, in Accretion Disks – New Aspects, E. Meyer-Hofmeister, H. Spruit (eds.), Lecture Notes in Physics 487, 1
- [56] Terlevich, R., Tenorio-Tagle, G., Franco, J., Melnick, J., 1992, MNRAS 255, 713
- [57] Teuben P.J., Sanders R.H., Atherton P.D., van Albada G.D., 1986, MNRAS 221, 1
- [58] Trümper J., 1983, Adv. Space Res. 2, 241
- [59] Turner T.J., Urry C.M., Mushotzky R.F., 1993, ApJ 418, 653 (TUM93)
- [60] Veron P., Lindblad P.O., Zuiderwijk E.J., Veron M.P., Adam G., 1980, A&A 87, 245
- [61] Vogler A., 1997, PhD Thesis, TU Munich
- [62] Vogler A., Pietsch W., Bertoldi F., 1997, A&A 318, 768
- [63] Ward M.J., Done C., Fabian A.C., Tennant A.F., Shafer R.A., 1988, ApJ 324, 767
- [64] Wheeler J.C., Mazurek T.J., Sivaramakrishnan A., 1980, ApJ 237, 781
- [65] Zaritsky D., Kennicutt jr., R.C., Huchra J.P. 1994, ApJ 420, 87
- [66] Zimmermann H.U., Becker W., Belloni T., et al., 1994a, MPE Report 257
- [67] Zimmermann H.U., Lewin W., Predehl P., et al., 1994b, Nature 367, 621