The 1998 outburst of the X-ray transient 4U 1630–47 observed with BeppoSAX
Abstract
We report results of five pointed BeppoSAX observations of the black hole candidate 4U 1630–47 during part of its 1998 outburst when the 2–10 keV source luminosity decreased from erg s-1 (for an assumed distance of 10 kpc) by a factor of 7. The 2–200 keV spectrum can be modeled by a soft multi-temperature disk blackbody and a hard power-law. During four of the observations, there is evidence for deviations from a pure power-law shape 20 keV which may be due to reflection. As the outburst decayed a number of spectral trends are evident: (1) the amount of photoelectric absorption decreased, (2) the spectrum became harder (i.e. the power-law index became smaller), (3) the temperature of the disk blackbody decreased and (4) the inferred inner disk radius increased by a factor of 4. The change in the accretion disk inner radius during the outburst is in contrast to results from other soft X-ray transients. We find that the disk blackbody temperature depends on the inner disk radius roughly as . For a standard Shakura-Sunyaev disk model this implies that the inferred mass accretion rate at the inner disk radius did not change appreciably during the part of the outburst observed by BeppoSAX.
Key Words.:
Stars: individual (4U 1630–47) – X-rays: stars1 Introduction
4U 1630–47 is an X-ray transient discovered by Uhuru (Jones et al. 1976), while the first recorded outburst was detected in 1969 by Vela 5B (Priedhorsky 1986). Outbursts occur approximately periodically with intervals ranging from 600–690 days (Jones et al. 1976; Priedhorsky 1986; Kuulkers et al. 1997a). Archival observations are reported in Parmar et al. (1995, 1997b). The 1984 outburst, and its subsequent decay, were relatively well studied by EXOSAT (Parmar et al. 1986). The flux decayed over a period of 100 days from 2.8 to 4 ergs s-1 (1–50 keV, for an assumed distance of 10 kpc). This distance estimate is based on the high absorption towards the source and its proximity to the galactic center (Parmar et al. 1986). The relative strength of the soft component decreased by at least a factor of two during the decay and the power-law component became harder as the outburst progressed.
4U 1630–47 is a black hole candidate based on its X-ray spectral and timing behavior (White et al. 1984; Parmar et al. 1986; Kuulkers et al. 1997b). The typical recurrence timescale for black hole candidate outbursts is 10–50 yr (e.g., Parmar et al. 1995), and the more prolific outburst activity of 4U 1630–47 is therefore unusual. No optical counterpart is known, probably due to high reddening and the crowded field (see Parmar et al. 1986). Kuulkers et al. (1997a) predicted that 4U 1630–47 would undergo another outburst near 1998 January 31. It went into outburst on around 1998 February 2, and was detected by the All Sky Monitor (ASM) on-board RXTE (Kuulkers et al. 1998a). The outburst reached a peak 2–12 keV intensity of 460 mCrab on around February 24. During the outburst a radio counterpart was detected by Hjellming & Kuulkers (1998).
We report on five BeppoSAX pointed observations performed during the decay of the 1998 outburst. We discuss the 2–200 keV spectrum of 4U 1630–47 and its evolution as the luminosity changed by a factor 7. In addition, we report on an observation in 1997 March when the source was in quiescence.
2 Observations and Analysis
4U 1630–47 was observed five times by BeppoSAX during the 1998 February-May outburst (Table 1, see also Fig. 1). Results obtained with the coaligned LECS, MECS, HPGSPC, and PDS instruments are presented. The LECS is sensitive between 0.1–10 keV (Parmar et al. 1997a), the MECS between 2–10 keV (Boella et al. 1997), the HPGSPC between 4–120 keV (Manzo et al. 1997), and the PDS between 15–300 keV (Frontera et al. 1997). The LECS and the MECS are imaging instruments with circular fields of view (FOVs) with diameters of 37′ and 56′, respectively. The non-imaging HPGSPC consists of a single unit with a collimator that is alternatively rocked on- and off-source to monitor the background spectrum. The non-imaging PDS consists of four independent units arranged in pairs each having a separate collimator. Each collimator is operated in a rocking-mode to monitor the background. The HPGSPC and PDS were operated in their nominal modes with a dwell time of 96 s for each on- and off-source position and rocking angles of 210′ and 180′, respectively. The HPGSPC and PDS have hexagonal FOVs of 78′ and 66′ full-width at half maximum, respectively.

| Obs | Date | Start Time | Total | MECS | MECS |
|---|---|---|---|---|---|
| Time | Exp. | Count | |||
| (1998) | (MJD) | (ks) | (ks) | rate (s-1) | |
| 1 | Feb 20 | 50864.188 | 42.5 | 20.0 | 78.9 |
| 2 | Feb 24 | 50868.254 | 34.1 | 13.5 | 75.7 |
| 3 | Mar 07 | 50879.517 | 55.7 | 29.5 | 41.8 |
| 4 | Mar 19 | 50891.620 | 48.4 | 27.7 | 20.8 |
| 5 | Mar 26 | 50898.720 | 60.0 | 31.1 | 11.7 |
For the spectral fits only MECS data in the energy range 1.85–10.5 keV and PDS data in the energy range 13–100 keV were used, since – due to the high absorption towards 4U 1630–47 – there is no useful LECS data at lower energies, while the LECS spectrum in the 2–10 keV band is consistent with that from the MECS. Typically, the source is detected with more than 10 significance up to 200 keV in the PDS. The PDS spectra were grouped using a logarithmic energy grid and the MECS spectra were grouped such that each energy bin has at least 20 counts. The relative normalization between the instruments was a free parameter to allow for small absolute calibration uncertainties, but the best-fit values are always close to unity.
The HPGSPC data were used to check the spectral shape of the source in the band 10.5–13 keV, which is not covered by the MECS and PDS instruments. The shape obtained from the MECS and PDS is in good agreement with the HPGSPC results. The HPGSPC data were not used in the final fits, because there are systematic residuals present which may be instrumental in origin. These tend to increase the values of (while the best-fit parameters remain unchanged). These residuals may be partly caused by the non-optimal background subtraction (see below) due to the presence of a source in the offset collimator position.
The presence of contaminating sources in the off-source collimator positions of the HPGSPC and the PDS was checked. During the later observations there is clearly a source (probably GX 340+0) in the offset position of the HPGSPC, and in the negative offset position of the PDS. Therefore, data obtained during Earth occultations were used to accumulate background spectra for the HPGSPC, and only the positive offset position was used for the PDS. Due to the different roll-angle of the satellite for each observation, the contribution of this contaminating source is not significant during observations 1 and 2, but in order to obtain a uniform dataset, the same method of background subtraction was used for all five observations. Note that using only one offset spectrum in the background subtraction results in a poorer signal to noise ratio, since the exposure time of the background spectrum is effectively halved.
| Obs | NH | Norm1 | T (keV) | Norm2 | /dof | |
| (PL) | (Disk BB) | |||||
| 1 | 10.33 | 2.67 | 13.3 | 2.21 | 13.5 | 1.706/246 |
| 2 | 9.88 | 2.70 | 11.3 | 1.96 | 27.2 | 0.993/246 |
| 3 | 9.00 | 2.485 | 5.36 | 1.13 | 111 | 1.631/246 |
| 4 | 8.32 | 2.30 | 1.10 | 1.020 | 218 | 1.177/246 |
| 5 | 8.13 | 2.28 | 0.75 | 0.86 | 263 | 1.561/246 |
| 1Photon flux at 1 keV | ||||||
| 2, where is the inner disk radius, the distance in units of | ||||||
| 10 kpc and the disk inclination angle | ||||||
| Obs | NH | Norm1 | Relative | T (keV) | Norm1 | L | /dof | ||
| (pexriv) | reflection2 | (Disk BB) | |||||||
| 1 | 10.03 | 2.56 | 10.9 | 0.19 | 2.10 | 17.9 | 2.08 | 0.29 | 1.414/244 |
| 2 | 9.88 | 2.70 | 11.3 | 0.06 | 1.96 | 2.00 | 0.34 | 1.002/244 | |
| 3 | 9.03 | 2.50 | 5.51 | 111.0 | 1.05 | 0.22 | 1.608/244 | ||
| 4 | 8.39 | 2.35 | 1.22 | 0.18 | 1.01 | 0.47 | 0.56 | 1.151/244 | |
| 5 | 8.23 | 2.37 | 0.69 | 0.85 | 282 | 0.27 | 0.47 | 1.112/244 | |
| 1Units are the same as in Table 2 | |||||||||
| 2Constrained to be positive | |||||||||
3 Results


A model consisting of an absorbed multi-temperature disk blackbody (Mitsuda et al. 1984) and an absorbed power-law fits the general broad-band spectral shape reasonably well (Table 2). However, with the exception of the spectra obtained during observation 2, deviations from the best-fit model are present which give rise to formally unacceptable values of . Fitting the spectra with a combination of absorbed power-law and blackbody models gives similar results. The spectra were next fitted with an absorbed disk blackbody and a cut-off power-law model. This gives some improvement in fit quality, but is still unable to satisfactorily model the deviations, or “wiggles”, in the spectrum which are most prominent around 20 keV (see Fig. 2).
These deviations prompted the use of a model which incorporates reflection such as pexriv in XSPEC which models a power-law reflected by ionized material (Magdziarz & Zdziarski 1995). The spectra were fit with the photon index, folding energy, relative reflection, and normalization as free parameters. The best-fit parameters are given in Table 3, with the exception of the folding energy, which was always much larger than highest energy used in the fit. The ionization parameter, , was fixed at 1.0 (corresponding to un-ionized material), since the fits are insensitive to changes in this parameter. The effects of reflection can be seen as deviations from a power-law continuum starting at 10 keV and extending to 30–40 keV in Fig. 3. With this model the overall is significantly less than with a power-law and disk blackbody model, but individual values are still are not always formally acceptable. In comparison with the cutoff power-law model, the values of are similar for observation 1, while for observations 2–4 the pexriv model gives marginally lower values of (at 90–94% confidence), and for observation 5 the reduction in is highly significant (99.9999% confidence). The trends in NH, disk blackbody temperature, and inner disk radius are very similar whichever model is used for the hard component (see e.g. Tables 2 and 3). Therefore the conclusions in Sect. 4 with regard to the derived disk blackbody parameters do not depend on the assumed hard-component model.

Tables 2 and 3 reveal that the temperature of the disk blackbody decreased and the inferred inner disk radius increased as the outburst progressed (see also Fig. 4). To investigate whether these changes could be artefacts of the fitting procedure, the correlations between the disk blackbody normalization (proportional to the square of the inner disk radius) and the power-law slope and disk blackbody temperature were investigated. Large changes are apparent in these quantities and a (very) strong correlation between parameters could give rise to an apparent change in the inner disk radius (which should then not be interpreted in a physical way). In order to check that this is not the case, contour-plots corresponding to large changes in ( =10, 20) were produced. The confidence contours do not overlap for the different observations since the differences between the obtained parameters are an order of magnitude larger than the size of the confidence contours for these already large differences. This analysis reveals that the observed changes are much larger than can be explained as due to correlations between fit parameters. The observed changes in the spectral parameters therefore reflect physical changes.
Power spectra of 4U 1630–47 were searched for any distinctive features such as quasi-periodic oscillations. None were found. However, the quality of the power spectra is rather poor (a much better analysis can be done with e.g. RXTE data) and so a more detailed timing analysis was not attempted.
During the BeppoSAX observation of 4U 1630–47 in its quiescent state (on 1997 March 26–27), 4U 1630–47 was not detected. However, due to the presence of a number of nearby sources and the relatively poor LECS and MECS spatial resolution, it is difficult to separate the contributions from nearby faint sources. The 3 upper limit to the MECS count rate is 1.2 s-1. This translates into an upper limit on the 2–10 keV unabsorbed flux of 1.9 ergs s-1, for an assumed distance of 10 kpc, a photon index of 2.1, and an NH of 8 atoms cm-2 (close to lowest value obtained). This photon index is the value obtained for the black hole candidate GS 2023+338 in quiescence by Narayan et al. (1997). The corresponding value for the unabsorbed 2–10 keV flux for an NH of 2.0 atoms cm-2(the galactic value; Dickey & Lockman 1990) is 1.0 ergs s-1. This upper limit is similar to previous limits for the flux of 4U 1630–47 in quiescence (see Parmar et al. 1997b).
4 Discussion
The BeppoSAX observations of 4U 1630–47 during its 1998 outburst reveal a decreasing NH, a hardening of a power-law like component, a decreasing disk blackbody temperature, and an increasing inferred inner disk radius (Fig. 4). These first two changes were also observed during the 1986 outburst of 4U 1630–47 by Parmar et al. (1986), and in other X-ray transients (e.g. GS 2023+338; Oosterbroek et al. 1997). The change in NH may suggest that the initial outburst onset is a rather dramatic event, which leaves significant amounts of material around the compact object, which later on is either accreted, or expelled from the system.

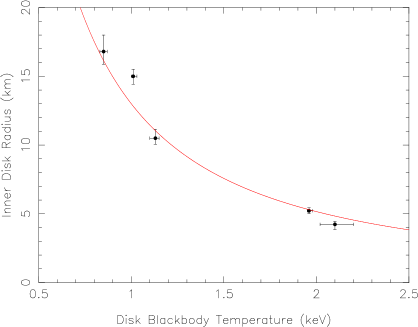
The inner disk radius (which has been interpreted as the radius of the innermost stable orbit around a black hole; Ebisawa 1991) increased by a factor of 4 (Fig. 4) during the part of the outburst observed by BeppoSAX. Therefore it is clearly not related (at least in a simple way) to the innermost stable orbit. It is interesting to note that a similar phenomenon, as seen in GRS 1915+105 by Belloni et al. (1997), may be evident here: the inner part of the accretion disk changes its state such that it does not contribute to the X-ray flux. However, in GRS 1915+105 this occurs on a much shorter time scale of seconds to minutes. The fact that the best-fit temperature at the inner disk radius decreased during the outburst supports this interpretation - it is just the result of the change in effective inner disk radius. The relation between the best-fit inner disk radii and temperature is shown in Fig. 5. Comparing this to the theoretical temperature profile of a standard Shakura-Sunyaev disk (, where is the surface temperature and r the radius), shows a qualitive agreement. We note that this relation is, strictly speaking, only valid for radii much larger than the inner disk radius. Since the mass accretion rate, this implies that is approximately constant during the part of the outburst observed by BeppoSAX (if the contribution from the non-thermal component is excluded), and that the inner part of the accretion disk progressively changed its state to produce the observed spectral changes.
This behavior is quite different from outbursts of the transients GS 112468, GRO J165540 and GS 2000+25 and from the persistent source LMC X-3 observed by Ginga and RXTE. In those sources the best-fit inferred inner disk radii remain approximately constant during the entire outburst (GS 2000+25), or until the late stages (150 days) of the outburst (see Tanaka & Lewin 1995; Ebisawa et al. 1994; Sobczak et al. 1998). This difference is unlikely to be caused by the broad energy coverage of BeppoSAX, which allows the underlying power-law(-like) spectrum to be well constrained, since the Ginga and RXTE energy ranges extend far beyond where the disk blackbody contributes to the flux. Another difference with respect to the above sources is that their disk blackbody temperatures are 1 keV, compared to 2 keV with 4U 1630–47 near the peak of the outburst. A similar high temperature was observed in GRS 1915+105 (Belloni et al. 1997). We speculate that the difference in spectral properties may be related to the difference in outburst recurrence intervals between 4U 1630–47 (1.6 yrs) and the other soft X-ray transients which have typical recurrence intervals 25 yrs. This may suggest that a different mechanism is responsible for the outbursts in 4U 1630–47, which also gives rise to a different behavior during the outburst. The fact that the inner part of the accretion disk disappears slowly (and smoothly) suggests that the matter accretes into the black hole (as opposed to the sudden phase transition observed in GRS 1915+105). This, in turn, may cause a drop in at the inner edge, which is needed to cause the end of an outburst in irradiated disks (see King & Ritter 1998).
The increase in the best fit inner disk radius is compatibible with the model of Esin et al. (1997) who assume that accretion takes place through a Shakura-Sunyaev disk beyond some truncation radius, but within this radius the flow jumps to the advective solution. They model the change from a high to a low state as an increase in the radius where the character of the flow changes. The observed increase in best-fit inner disk radius may therefore simply reflect the outward expansion of the radius where optically thick material is present as the outburst evolved. We note that the best-fit values for the inner disk radius are lower than the value (3 Schwarzschild radii, the innermost marginally stable orbit) for the high state in the Esin et al. (1997) model. However, we have assumed that the disk is viewed face-on (an inclination angle of 0∘), while there are indications that the inclination is in the range 60–75∘ (Kuulkers et al. 1998b). In addition, the distance to the source is uncertain. These factors may result in larger values for the “real” inner disk radius. Życki et al. (1998) also find much smaller values for the inner disk radius from their modeling of the spectra of GS 112468, compared to the values predicted in Esin et al. (1997).
We note that the changing inferred inner disk radius has implications for the method applied by Zhang et al. (1997) to determine black hole spin. They calculate the general relativistic effects of black hole rotation on the inner disk regions, which allows the obtained disk blackbody temperatures and inner disk radii to be interpreted in terms of the spin of the black hole. Our results suggest that other processes also affect the spectrum (since a change of black hole spin can be excluded on a time scale of 40 days), which cautions against interpreting spectral properties in term of black hole parameters alone.
The nature of the hard component in 4U 1630–47 is unclear. Although a reflection model provides the lowest overall , this does not necessarily mean that significant reflection is occuring in the system. The largest reduction in using the pexriv model compared to a power-law is obtained when the fitted relative reflection is high, which does mean that the deviations from a power-law, to first order, can be modeled with a reflection component. However, the values of are not always formally acceptable, which suggests that, although the pexriv model gives a better overall fit then a power-law or a cutoff power-law, the detailed modeling of the reflected component is unsatisfactory. We note that the fits to the EXOSAT spectra also gave formally unacceptable values, although Parmar et al. (1986) used a different model consisting of a Wien-like soft component and a power-law. It appears that the spectrum of 4U 1630–47 is complex and contains features which cannot be currently modeled in a realistic way.
The amount of reflection in the pexriv model (see Table 3) increased, compared to the underlying continuum, as the outburst decayed. However, there is no obvious correlation between the amount of relative reflection and the normalizations of the disk blackbody and power-law, as modeled with the pexriv model, suggesting that any reflected component is neither constant nor directly related to the strengths of either spectral component. The weakness of the “wiggles” during observation 2 coincided with the peak of the outburst, as can be seen from the RXTE ASM light curve (Fig. 1). This may be coincidence, or it could be that the continuum becomes “smoother” near the maximum of the outburst as a rule. We note that the residuals in the 4–7 keV range become significantly less if a narrow Gaussian component is added, suggesting the presence of a weak (30 eV equivalent width) iron line (obs. 3). However, the residuals are at the 2–3% level, comparable to the systematic uncertainties. In comparison with Active Galactic Nuclei where reflection components and associated iron fluorescence lines have been detected from a number of systems (e.g., Pounds et al. 1990), the lack of intense (100 eV equivalent width) iron emission from 4U 1630–47 is surprizing, if reflection is important in this system. However, we note that during a Broad Band X-ray Telescope observation of the blackhole candidate Cyg X-1 by Marshall et al. (1993) also showed evidence for reflection by material surrounding the central source, but only a narrow line at 6.4 keV with an equivalent width of eV was possibly detected.
Acknowledgements.
The BeppoSAX satellite is a joint Italian–Dutch programme. T. Oosterbroek acknowledges an ESA Fellowship. We thank the staff of the BeppoSAX Science Data Center for their support and the RXTE/ASM teams at MIT and at NASA’s GSFC for providing quick-look results.References
- (1) Belloni T., Méndez M., King A.R., van der Klis M., van Paradijs J., 1997, ApJ 479, L145
- (2) Boella G., Chiappetti L., Conti G., et al., 1997, A&AS 122, 327
- (3) Dickey J.M., Lockman F.J., 1990, ARA&A 28, 215
- (4) Ebisawa K., 1991, Ph.D. Thesis, ISAS, University of Tokyo
- (5) Ebisawa K., Ogawa M., Aoki T., et al., 1994, PASJ 46, 375
- (6) Esin A.A., McClintock J.E., Narayan R., 1997, ApJ 489, 865
- (7) Frontera F., Costa E., Dal Fiume D., et al., 1997, A&AS 122, 357
- (8) Hjellming R.M., Kuulkers E., 1998, IAU Circ. 6827
- (9) Jones C., Forman W., Tananbaum H., Turner M.J.L., 1976, ApJ 210, L9
- (10) King A.R., Ritter H., 1998, MNRAS 293, L42
- (11) Kuulkers E., Parmar A.N., Kitamoto S., Cominsky L.R., Sood R.K., 1997a, MNRAS 291, 81
- (12) Kuulkers E., van der Klis M., Parmar A.N., 1997b, ApJ 474, L47
- (13) Kuulkers E., Dieters S., McCollough M., et al., 1998a, IAU Circ. 6822
- (14) Kuulkers E., Wijnands R., Belloni T., et al., 1998b, ApJ 494, 753
- (15) Magdziarz P., Zdziarski A.A., 1995, MNRAS 273, 837
- (16) Manzo G., Giarusso S., Santangelo A., et al., 1997, A&AS 122, 341
- (17) Marshall F.E., Mushotzky R.F., Petre R., Serlemitsos P.J., 1993, ApJ 419, 301
- (18) Mitsuda K., Inoue H., Koyama K., et al., 1984, PASJ 36, 741
- (19) Narayan R., Barret D., McClintock J.E., 1997, ApJ 482, 448
- (20) Oosterbroek, T., van der Klis M., van Paradijs J., et al., 1997, A&A 321, 776
- (21) Parmar A.N., Stella L., White N.E., 1986, ApJ 304, 664
- (22) Parmar A.N., Angelini L., White N.E., 1995, ApJ 452, L129
- (23) Parmar A.N., Martin D.D.E., Bavdaz M., et al., 1997a, A&AS 122, 309
- (24) Parmar A.N., Williams O.R., Kuulkers E., Angelini L., White N.E., 1997b, A&A 319, 855
- (25) Pounds K.A., Nandra K.P., Stewart G.C., George I.M., Fabian A.C., 1990, Nat 344, 132
- (26) Priedhorsky W.C., 1986, AP&SS 126, 89
- (27) Sobczak G.J., McClintock J.E., Remillard R.A., Bailyn C.D., Orosz J.A., 1998, ApJ submitted (astro-ph/9809195)
- (28) Tanaka Y., Lewin W.H.G., 1995, in Lewin W.H.G., van Paradijs J., van den Heuvel E.P.J., eds., X-ray Binaries. Cambridge Univ. Press, Cambridge, p 126.
- (29) White N.E., Kaluzienski J.L., Swank J.H., 1984, in Woosley S.E., ed., Proc AIP Conf. 115, High Energy Transients in Astrophysics. AIP, New York, p. 31.
- (30) Zhang S.N., Cui W., Chen W., 1997, ApJ 482, L155
- (31) Życki P.T., Done C., Smith D.A., 1998, ApJ 496, L25