A NIR search for high-redshift clusters
1Instituto Astronômico e Geofísico, Av Miguel Stéfano 4200,
04301-904, São Paulo, Brazil
2Universitäts-Sternwarte, Ludwig-Maximilians-Universität,
Scheinersstrasse 1, 81679 Munich, Germany
Abstract: We describe our preliminary results on a search for high-redshift ( 0.5) galaxy clusters using near-infrared photometry obtained with the Omega camera at the 3.5m telescope at Calar Alto.
1. Introduction
The project described here is a search for high-redshift clusters using VRIJK photometry. We have four main goals: 1) determine the space density of 1 clusters; 2) measure large-scale structure at redshifts 0.5; 3) test the number density evolution of elliptical galaxies; 4) select a sample of large– elliptical galaxies for populations studies. (1), (2) and (3) provide strong discrimination of different cosmologies, (4) will give a time baseline to test models of elliptical galaxy formation and evolution.
Why do we expect to find clusters at 1? There are several lines of evidence that suggest there has been little evolution between and the present. The passive evolution of the fundamental plane relations of cluster galaxies out to , the small-scatter of the colour-magnitude diagram and Mg– relation for medium-redshift clusters and the mild change in the mean colour of cluster elliptical galaxies with redshift out to (Kelson et al. 1997, Ellis et al. 1997, Bender et al. 1996, 1998, Ziegler & Bender 1997, Stanford et al. 1998) are some of the evidences which point to a redshift of formation of cluster ellipticals larger than 2.
A few examples of high-redshift clusters have already been found, e.g. 3C 324 at 1.20 (Dickinson 1995), CIG J0848+4453 at z=1.27 (Stanford et al. 1997), but no systematic search using NIR colours and covering a large area on the sky has yet been done.
Near-infrared imaging surveys offer one of the most useful tools for finding clusters at high redshifts. Other successful techniques are based on the detection of optical background fluctuations over hundreds of square degrees on the sky (Zaritsky et al. 1997) and searches using ROSAT x-ray observations (e.g. Rosati et al. 1995 – these are mainly restricted to 1 clusters however).
Why search for clusters using NIR photometry? Old, passively-evolving galaxies observed at high-z have very red optical-NIR colours. It is then natural to look for them with very red filters. Identifying high-redshift galaxies using NIR photometry avoids confusion with galactic stars or blue field galaxies. In addition, NIR colours are weakly affected by evolution. There is also the advantage of a small and uniform k-correction for all galaxy types.
2. Previous NIR galaxy surveys
The largest faint galaxy photometric survey in the near-infrared is the “ESO K’-band survey”. and images were obtained over 40 arcmin2 down to and 170 arcmin2 to . A recent paper on the galaxy counts was published by Saracco et al. (1997). They identified a population of blue objects () brighter than which they suggest represent a population of sub-L∗ nearby evolving galaxies.
Another large galaxy survey which includes photometry in the near-infrared is that of Elston, Eisenhardt & Stanford (1995). They performed a BRIzJK field survey over 100 arcmin2 down to K=22 and found one cluster at z=1.27 (later confirmed by Keck spectroscopy of 8 galaxies, Stanford et al. 1997).
There are several other deep NIR surveys which, however, cover very small areas from 1 to 20 arcmin2 (eg. Cowie et al. 1990, Cowie et al. 1994, Soifer et al. 1994, McLeod et al. 1995; Djorgovski et al. 1995, Moustakas et al. 1997 and others). The main goal of these surveys was to study galaxy evolution through number counts in the K band.
Optical/near-infrared surveys designed to look for rich clusters of galaxies at high redshifts have been described by Dickinson and collaborators. Imaging of the environment of powerful radio galaxies yielded the identification of several candidate rich clusters, visible as an overdensity of red galaxies, some of which were confirmed to be clusters with subsequent spectroscopy (Dickinson 1995).
3. Our survey
J and images were taken at the 3.5m-telescope at Calar Alto targeting 0.5 quasars. The NIR camera (Omega) with a Rockwell 1024 x 1024 pix (HgCdTe detector) giving 0.4”/pixel and a field of view of 6.8’ x 6.8’ was used. Typical exposure times were 20 min. in J and . About 20 fields were observed ( arcmin2 each) covering 0.26 degree2 in total. Our goal is to cover a 3 degree2 field.
Seven of the fields have been processed so far. These sample the environment of quasars with redshifts 0.5 2.0. We give some of our preliminary results based on the J and images of these fields in the next section. A publication in preparation will describe in more detail the results for the whole sample. Optical photometry on these fields is planned for the near future.
4. Preliminary results
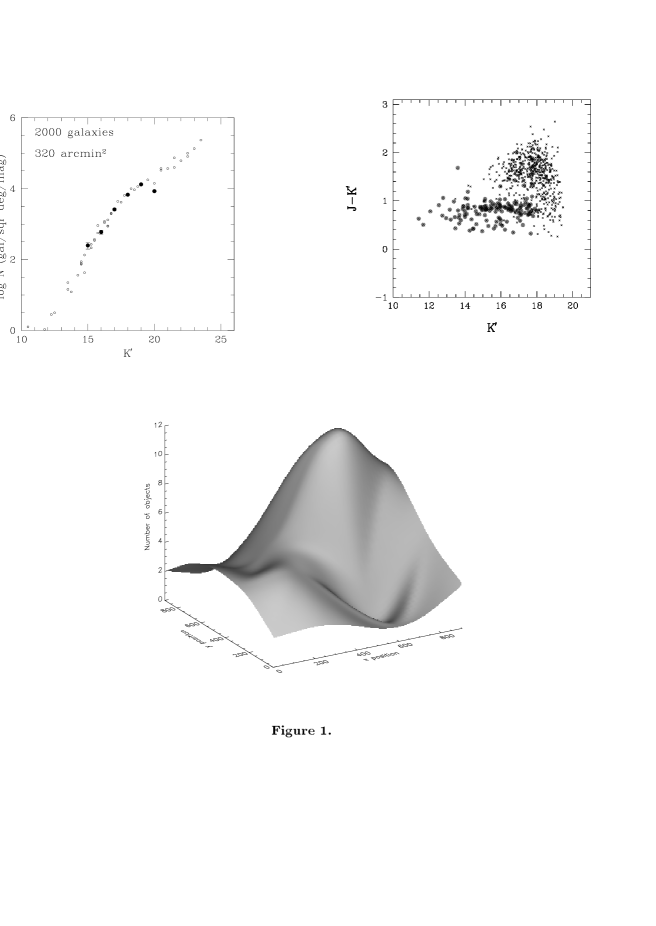
Detection and photometry of the objects in the images was done using the software package SEXTRACTOR (Bertin & Arnouts 1996). Galaxy/star separation was possible to magnitude . Add-star experiments were performed to assess the photometric completion. Our results show that the raw counts are 68% complete at =19.5. In Fig. 1a we show the counts for the seven fully reduced fields, compared to the counts obtained from data published previously in the literature (Djorgovski et al. 1995, Glazebrook et al. 1994, Gardner et al. 1993). About 2000 galaxies were detected in an area of 320 arcmin2 in our survey. The area we have covered so far is larger than that for the largest previously published survey (to the magnitude limit we reach). Fig. 1a shows the number of galaxies per degree2, per magnitude bin. The shape of the curve is very similar to that found in previous studies. In particular, we confirm the change of slope of the curve at a magnitude of .
colours were determined for all objects detected in . Colours within an aperture of diameter 4 arcsec vs. magnitudes are plotted in Fig. 1b for five of the fields for which and images were available. It is clear that there are a number of galaxies which are as red as early-type galaxies at (). We find about 1 galaxy with per arcmin2 to a limiting magnitude =19 mag.
We performed a search for a surface density enhancement of red objects, as a first indication of the presence of candidate clusters in our fields. In only one field was such an enhancement found. Fig. 1c shows a plot of the number of galaxies with magnitudes in the interval 17–18.5, with 1.7 in circles of 1 arcmin radius centered at 16 positions for one of the frames. We find a 3 surface overdensity of red galaxies around a quasar at redshift = 0.72 (position 600, 600) which we explain as a possible poor cluster of galaxies. Optical VRI images of the candidate cluster and preliminary photometric redshift determinations (described in a paper in preparation) confirmed the presence of a density enhancement in this area. Subsequent spectroscopy is planned to confirm the nature and redshift of the cluster.
Acknowledgements
We thank the staff at Calar Alto for helping with the observations. CMdO acknowledges the financial support from the Alexander von Humboldt Foundation. This work was supported by the Sonderforschungsbereich SFB375.
References
- [1] Bender, R., Saglia, R.P., Ziegler, B., Belloni, P., Greggio, L., Hopp, U., Bruzual, G.: 1998, ApJ 493, 529
- [2] Bender, R., Ziegler, B., Bruzual, G.: 1996, ApJ 463, 51
- [3] Bertin, E., Arnouts, S.: 1996, A&AS 117 117, 393
- [4] Cowie, L.L., Gardner, J.P., Lilly, S.J., McLean, I.: 1990, ApJ 360, L1
- [5] Cowie, L.L., Gardner, J.P., Hu, E.M., Songaila, A., Hodapp, K.W., Wainscoat, R.J.: 1994, ApJ 434, 114
- [6] Dickinson, M.: 1995, Fresh Views of Elliptical Galaxies, eds. A. Buzzoni, A. Renzini, A. Serrano, ASP, San Francisco, p. 283
- [7] Djorgovski, S., et al.: 1995, ApJ 438, L13
- [8] Ellis, R.S., Smail, I., Dressler, A., Couch, W.J., Oemler, A., Butcher, H. and Sharples, R.M.: 1997, ApJ 483, 582
- [9] Elston, R., Eisenhardt, P. Stanford, A.: 1995, AAS 187, 3001
- [10] Gardner, J.P., Cowie, L.L., Wainscoat, R.J.: 1993, ApJ 415, L9
- [11] Glazebrook, K., Peacock, J., Collins, C., Miller, L.: 1994, MNRAS 266, 65
- [12] Kelson, D.D., Van Dokkum, P.G., Franx, M., Illingworth, G., Fabricant, D.: 1997, ApJ 478, L13
- [13] Mcleod, B.A., Bernstein, G.M., Reike, M.J., Tollestrup, E.V., Fazio, G.G.: 1995, ApJS 96, 117
- [14] Moustakas, L.A., Davis, M., Graham, J.R., Silk, J., Peterson, B.A., Yoshii, Y.: 1997, ApJ 475, 44
- [15] Rosatti, P., Della Ceca, R., Burg, R., Norman, C., Giacconi, R.: 1995, ApJ 445, L11
- [16] Saracco, P., Chincarini, G., Iovino, A., Garilli, B., Maccagni, D.: 1997, AJ 114, 887
- [17] Soifer, B.T. et al. 1994: ApJ 420, L1
- [18] Stanford, S.A., Eisenhardt, P.R., Dickinson, M.: 1998, ApJ 492, 461
- [19] Stanford, S.A., Richard, E., Eisenhardt, P., Spinrad, H., Stern, D., Arjun, D.: 1997, AJ 114, 2232
- [20] Zaritsky, D., Nelson, A.E., Dalcanton, J.J., Gonzalez, A.H.: 1997, ApJ 480, L91
- [21] Ziegler, B., Bender. R.: 1997, MNRAS 291, 527