ROSAT observations of the Sculptor galaxy NGC 7793
Abstract
We report here the results of spectral imaging observations with the ROSAT PSPC of the field surrounding the very nearby ( Mpc) Sculptor galaxy, NGC 7793. Many point sources are detected within the field, several of them showing evidence for variability. Seven sources are seen to lie within the optical confines of the system, the brightest ( erg s-1), lying to the southern edge of NGC 7793. This source, also observed to be variable, is seen now, not to be associated with a redshift QSO, as was previously thought. A number of the other sources within the NGC 7793 disc are likely to be due to X-ray binaries, supernova remnants or superbubbles within the galaxy itself. Other sources may be associated with background AGN. In addition to the point source emission, rather uniform unresolved emission is detected in and around NGC 7793 extending to a radius of perhaps 4 kpc. This emission is likely to be contaminated to some degree by unresolved point sources, as its temperature ( keV) is rather hotter than is seen for the diffuse gas components in other nearby spiral galaxies. Comparing the X-ray properties of NGC 7793 with those of the remaining Sculptor group members, suggests that it may, in terms of activity, lie somewhere between its quiescent and starburst neighbours.
Key Words.:
Galaxies: clusters: Sculptor – Galaxies: individual: NGC 7793 – Galaxies: ISM – Galaxies: spiral – X-rays: galaxies1 Introduction
NGC 7793 is a reasonably face-on galaxy (53.7∘), of type Sd(s) (IV) (Sandage & Tammann Sandage (1987)), and is one of the five well-known galaxies making up the nearby Sculptor galaxy group. It has a very thin bulge and a filamentary spiral structure, though this spiral pattern is almost lost within the numerous regions of H ii emission and star formation. Though estimates of its distance vary, ranging from 2.5 (de Vaucouleurs et al. RC3 (1991)) to 3.4 Mpc (Carignan Carignan85 (1985)), recent efforts have concentrated towards the high end of this range, and we here adopt a distance of 3.38 Mpc, in agreement with several other authors (Blair & Long Blair (1997); Carignan & Puche Carignan90 (1990); Puche & Carignan Puche91 (1991)). At this distance, 1′ corresponds to just under a kiloparsec (0.98 kpc). It is an intrinsically small and dim system, with an exponential scale length , and an absolute magnitude . This absolute magnitude corresponds to a total blue luminosity of (Carignan & Puche Carignan90 (1990)).
As far as previous X-ray observations of NGC 7793 go, NGC 7793 was observed with the Einstein IPC for almost 2 ks in 1979 (Fabbiano et al. Fabbiano92 (1992)). Very little was gleaned from these observations apart from the fact that the ‘X-ray centroid does not coincide with the nucleus’. These observations are described more fully throughout this paper. The ROSAT X-ray telescope (XRT) however, with the Position Sensitive Proportional Counter (PSPC) (Pfeffermann et al. Pfeffermann (1986)) at its focal plane, offers three very important improvements over previous X-ray imaging instruments (such as the Einstein IPC). Firstly, the spatial resolution is very much improved, the 90% enclosed energy radius at 1 keV being (Hasinger et al. Hasinger (1992)). Secondly, the PSPC’s spectral resolution is very much better ( FWHM at 1 keV) than earlier X-ray imaging instruments, allowing the derivation of characteristic source and diffuse emission temperatures. Lastly, the PSPC internal background is very low ( ct s-1 arcmin-2; Snowden et al. Snowden94 (1994)), thus allowing the mapping of low surface brightness emission source populations (see Trümper (Trumper (1992)) for a description of the ROSAT satellite and instruments).
Here we report the results of a 23.8 ks ROSAT PSPC observation of the field surrounding NGC 7793. The plan of the paper is as follows. Sect. 2 describes the observation and the preliminary data reduction methods used, Sect. 3 discusses the results as regards the point source emission, and Sect. 4 discusses the results as regards the remaining unresolved emission. Sect. 5 discusses the X-ray properties of NGC 7793, with regard both to its membership of the Sculptor group and to how it compares to spiral galaxies in general. Finally a summary is presented in Sect. 6.
2 ROSAT observations and preliminary analysis
The field surrounding NGC 7793 was observed with the ROSAT PSPC in essentially two separate observations (on December 7th 1992, and between May 20th-27th 1993) for a total of 23.8 ks. Towards the end of the December 1992 observation, a modest increase (by a factor of 1.5) in the count rate is observed. Investigating further, one sees that this extra emission pervades the entire field of view, and is merely an enhancement in the background over the whole detector. This background enhancement, which merely decreases the signal to noise ratio over parts of the observation, is noted here, and its effects are discussed throughout the paper. Apart from this, the data appeared essentially very clean, and just less than 600 seconds of data were removed on the basis of either very high ( ct s-1) accepted event rates, very high ( ct s-1) master veto rates, or large values of atomic oxygen column density along the line of sight.
Source detection and position determination were performed over the full field of view with the EXSAS local detect, map detect, and maximum likelihood algorithms (Zimmermann et al. Zimmermann92 (1992)). Images of pixel size 15″ were used for the source detection.
Sources accepted as detections were those with a likelihood L 10, and this gave rise to a number of sources. Probabilities P, are related to maximum likelihood values L, by the relation P. Thus a likelihood L of 10 corresponds to a Gaussian significance of 4.0 (Cruddace et al. Cruddace (1988); Zimmermann et al. Zimmermann94 (1994)).
Over the central 25′25′ area (which we here concentrate on), 27 sources are detected, and these are listed in Table 1 as follows: source number (col. 1), corrected right ascension and declination (cols. 2, 3), error on the source position (col. 4, including a 39 systematic attitude solution error), likelihood of existence (col. 5), net counts and error (col. 6), count rates and errors after applying deadtime and vignetting corrections (col. 7), and 0.12.4 keV flux, assuming a 5 keV thermal bremsstrahlung model (col. 8). Count rates of the PSPC-detected point sources can be converted into fluxes, assuming a variety of spectral models. A 1 keV thermal bremsstrahlung model for instance, gives rise to fluxes 0.88 times those given in Table 1. Two hardness ratios are given in cols. 9 & 10, HR1, defined as (hardsoft)/(hardsoft) (hard and soft being the net counts in the hard (channels 52201) and soft (channels 841) bands, respectively), and HR2, defined as (hard2hard1)/(hard2hard1) (hard1 and hard2 being the net counts in the hard1 (channels 5290) and hard2 (channels 91201) bands, respectively). The corresponding errors are also given (note that where a source is not formally detected in one of the four bands, an upper or lower limit to the hardness ratio has been calculated using a 2 upper limit to the counts). HR1 is most sensitive to variations in the absorbing column, while HR2 traces more the power law index or temperature. Hardness ratios can be used to give very crude estimates of the spectral parameters that best describe the source photons, and it may be worth comparing the tabulated values with plots in the literature which show the variation of HR1 and HR2 for simple spectral models (see e.g. Pietsch et al. Pietsch98a (1998)). The final column (col. 11) of Table 1 gives the nearest bright optical counterpart from the APM finding charts of Irwin et al. (Irwin (1994)); type (Sstellar, Ggalaxy, Ffaint), B magnitude, and offset in arcseconds. Note that further correlations with several catalogues were performed, notably with the SIMBAD database operated at CDS, Strasbourg. Finally, the only source flagged as extended (and then, only at a likelihood of 8.4) is source P27.
In an effort to improve the accuracy of the PSPC source positions, the RA and Dec of five bright point sources (P3, P4, P12, P19 and P21) were compared with the APM finding charts of Irwin et al. (Irwin (1994)). Sources apparently associated with the central galaxy, although they appeared to be very coincident, were not used in the correction process, because of the confused and apparently extended nature of both their optical and X-ray emission. A very small offset of 004 in right ascension and 05 in declination is observed (the coordinates given in Table 1 have been corrected for this).
| Src. | R.A. (J2000) Dec | Rerr | Lik. | Net counts | Ct. rate | Hardness ratios | Identification | |||
|---|---|---|---|---|---|---|---|---|---|---|
| () | () | () | (ks-1) | () | (HR1) | (HR2) | ||||
| (1) | (2) | (3) | (4) | (5) | (6) | (7) | (8) | (9) | (10) | (11) |
| P1 | 23 57 12.9 | -32 23 57 | 16.6 | 25.0 | 72.112.8 | 3.40.6 | 4.30.8 | 0.10.1 | F (24.1) 30 | |
| P2 | 23 58 28.8 | -32 24 42 | 17.3 | 10.2 | 33.19.3 | 1.60.5 | 2.00.6 | 0.80.3 | S (20.8) 277 | |
| P3 | 23 58 42.4 | -32 26 09 | 10.4 | 63.3 | 107.713.8 | 5.20.7 | 6.60.8 | -0.20.1 | 0.20.2 | S (19.5) 50 |
| P4 | 23 57 53.1 | -32 28 10 | 5.4 | 279.4 | 219.016.7 | 9.90.8 | 12.51.0 | 0.10.1 | 0.10.1 | S (21.3) 26 |
| P5 | 23 57 44.3 | -32 28 46 | 10.0 | 26.7 | 51.610.1 | 2.30.5 | 2.90.6 | -0.10.2 | F (23.0) 56 | |
| P6 | 23 57 48.5 | -32 32 30 | 15.0 | 16.1 | 41.39.6 | 1.80.4 | 2.30.5 | 0.10.2 | S (16.1) 28(?) | |
| P7 | 23 57 52.6 | -32 33 11 | 9.9 | 31.9 | 54.710.1 | 2.40.5 | 3.00.6 | 0.20.2 | 0.20.2 | S (17.9) 15(?) |
| P8 | 23 57 59.8 | -32 33 24 | 13.5 | 29.5 | 69.512.0 | 3.10.5 | 3.90.7 | 0.10.2 | 0.00.2 | (?) |
| P9 | 23 58 08.6 | -32 34 03 | 6.1 | 111.7 | 110.112.5 | 4.90.6 | 6.20.7 | 0.30.1 | F (21.2) 73(?) | |
| P10 | 23 57 47.1 | -32 36 05 | 11.7 | 79.8 | 173.418.1 | 7.70.8 | 9.71.0 | 0.10.1 | 0.00.1 | NGC 7793 |
| P11 | 23 58 03.1 | -32 36 34 | 12.9 | 18.8 | 41.29.3 | 1.80.4 | 2.30.5 | 0.40.2 | NGC 7793 | |
| P12 | 23 58 38.6 | -32 37 10 | 6.2 | 182.8 | 180.515.7 | 8.40.7 | 10.60.9 | 0.00.1 | 0.00.1 | G (18.3) 17 |
| P13 | 23 57 51.2 | -32 37 23 | 4.1 | 2746.6 | 976.032.0 | 43.51.4 | 54.91.8 | 0.90.0 | 0.40.0 | NGC 7793 |
| P14 | 23 57 31.5 | -32 37 25 | 11.6 | 17.9 | 42.19.5 | 1.90.4 | 2.40.5 | S (20.3) 276 | ||
| P15 | 23 58 32.6 | -32 38 16 | 9.0 | 37.3 | 62.110.4 | 2.90.5 | 3.70.6 | 0.20.2 | F (20.9) 11 | |
| P16 | 23 57 12.0 | -32 38 22 | 21.9 | 14.5 | 73.714.1 | 3.40.6 | 4.30.8 | 0.30.2 | 0.30.2 | G (18.3) 36 |
| P17 | 23 57 17.8 | -32 39 50 | 12.9 | 22.1 | 52.910.6 | 2.40.5 | 3.00.6 | -0.10.2 | 0.10.2 | F (21.2) 161 |
| P18 | 23 57 25.3 | -32 42 28 | 24.3 | 15.5 | 72.914.4 | 3.30.7 | 4.20.8 | -0.20.2 | 0.00.3 | G (12.6) 141 |
| P19 | 23 58 50.0 | -32 42 45 | 10.6 | 52.7 | 99.113.5 | 4.80.7 | 6.10.8 | 0.10.2 | 0.10.2 | S (19.3) 35 |
| P20 | 23 58 28.5 | -32 42 50 | 16.0 | 14.5 | 42.510.2 | 2.00.5 | 2.50.6 | -0.60.3 | F (20.9) 123 | |
| P21 | 23 57 51.4 | -32 42 53 | 11.8 | 23.9 | 49.710.0 | 2.30.5 | 2.90.6 | 0.10.2 | 0.20.2 | G (19.1) 57 |
| P22 | 23 56 57.3 | -32 43 32 | 19.8 | 33.4 | 130.918.1 | 6.30.9 | 8.01.1 | 0.40.2 | 0.20.1 | G (13.9) 46 |
| P23 | 23 57 49.9 | -32 45 48 | 11.3 | 29.7 | 60.510.9 | 2.80.5 | 3.50.6 | F (21.7) 05 | ||
| P24 | 23 56 57.5 | -32 46 34 | 38.0 | 11.0 | 66.915.7 | 3.30.8 | 4.21.0 | -0.20.2 | F (22.3) 51 | |
| P25 | 23 57 41.8 | -32 46 53 | 8.3 | 94.9 | 131.614.4 | 6.20.7 | 7.80.9 | 0.00.1 | 0.30.2 | F (21.2) 62 |
| P26 | 23 57 14.0 | -32 47 11 | 16.1 | 61.0 | 164.018.7 | 7.90.9 | 10.01.1 | -0.20.1 | 0.30.2 | S (19.4) 112 |
| P27 | 23 58 21.2 | -32 47 17 | 7.5 | 249.8 | 302.320.9 | 14.51.0 | 18.31.3 | -0.40.1 | 0.10.1 | S (18.8) 37 |
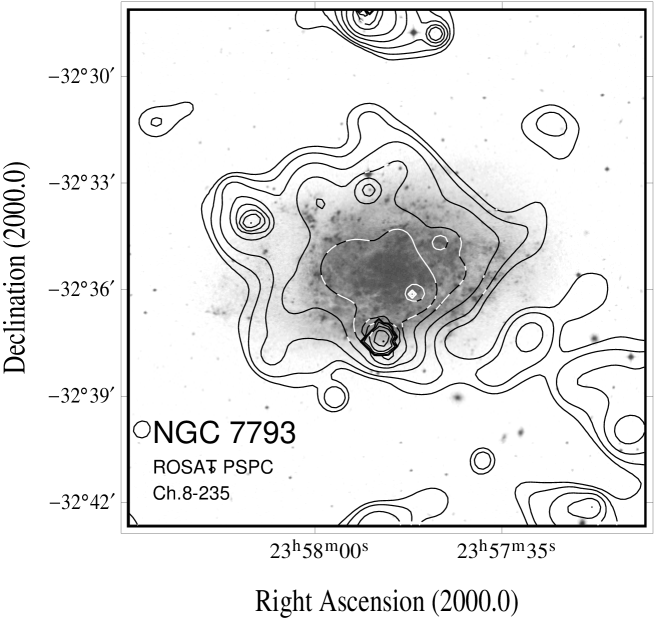
Fig. 1 shows a broad band (channels 8235, corresponding approximately to 0.082.35 keV) contour image of the central 25′25′ region. All of the sources listed in Table 1 are marked. Also shown in Fig. 1 are three smaller images, showing the very central (10′10′) emission, selected over three separate spectral bands the ‘soft’ band (channels 841), the ‘hard 1’ band (channels 5290) and the ‘hard 2’ band (channels 91201).
To investigate whether any residual, low surface brightness emission is visible within or around NGC 7793, an adaptive filtering technique was used to create an intensity-dependent smoothed image. The signal-to-noise level of low surface brightness emission is boosted by smoothing lower and lower intensity sections of the image using Gaussians of progressively larger FWHM. Photons (from channels 8235) were binned into an image of pixel size 8″. Pixels of amplitude 1 (2,3,4,5,6,7,8) were smoothed with a Gaussian of FWHM 170″ (120,85,60,40,30,20,15)″. Pixels of amplitude greater than 8 remained unsmoothed, thus ensuring that the bright point sources were not smoothed into the background regions. The resultant image is shown as a contour map overlaid on an optical image in Fig. 2 (the optical image is taken from the U.K. Schmidt plate digitised sky survey).
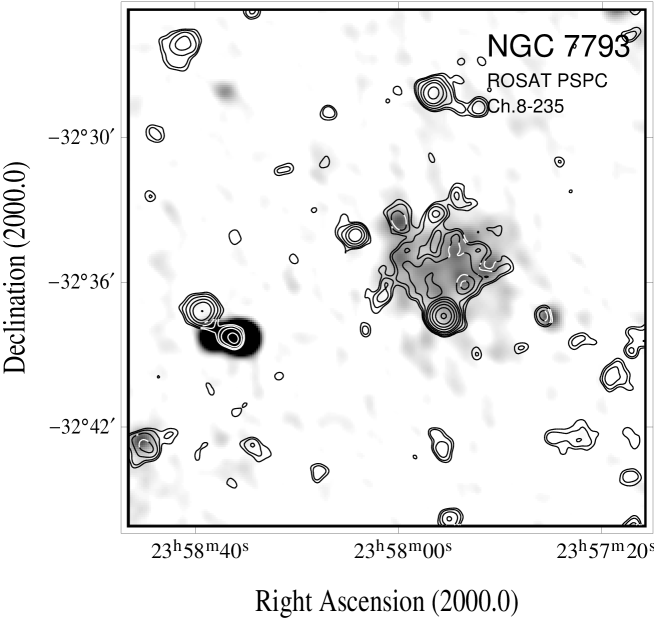
The X-ray data was also compared with the NRAO VLA (NVSS) Sky Survey (Condon et al.Condon (1998)), a radio continuum survey at 1.4 GHz, covering the sky north of -40∘ declination. Cross-correlating the NVSS catalogue with the sources listed in Table 1) gave rise to radio counterparts lying within 20″ of three X-ray sources, namely sources P14, P15 and P19. This information was used to create Fig. 3, where contours of broad-band X-ray emission (exactly as in Fig. 1) are shown superimposed on the NVSS 1.4 GHz continuum radio emission.
2.1 Time variability study of point sources
A time variability study was performed on all of the central 27 PSPC-detected sources.
As mentioned briefly earlier, essentially two separate observations were carried out, almost half a year apart. The first of these (7/12/92) consisted of eight observation blocks (of between 1.5 and 2 ks). The second observation consisted of six observation blocks (again, of between 1.5 and 2 ks), the first five from 20/5/93, the last from 27/5/93.
It was decided at first to bin the complete observation into these 2 main observations separated by six months, the December 1992 and the May 1993 observation. A maximum likelihood search at the source positions given in Table 1 was performed for both observation intervals, the vignetting and deadtime corrected count rates (and errors) calculated within a cut radius of the PSF FWHM at the source positions. Table 2 gives the count rates for the 27 sources for the two observation intervals plus the probability that the source is variable. As can be seen, a few of the sources appear variable, notably P9, P13 and P25. Two further sources that appear to be variable at greater than the 2 significance level, are P21 () and P26 ().
| Source | Count rate ( s-1) | Prob.(var) | |
|---|---|---|---|
| Dec. 1992 | May 1993 | ||
| (1) | (2) | (3) | (4) |
| P1 | 2.50.7 | 3.60.8 | 67% |
| P2 | 1.40.6 | 2.00.7 | 48% |
| P3 | 5.80.9 | 4.20.9 | 79% |
| P4 | 10.51.1 | 8.51.0 | 82% |
| P5 | 2.40.6 | 1.90.6 | 41% |
| P6 | 1.70.6 | 1.30.6 | 41% |
| P7 | 2.60.6 | 1.70.5 | 37% |
| P8 | 2.30.6 | 2.20.6 | 13% |
| P9 | 8.00.9 | 0.80.4 | 100% |
| P10 | 5.10.8 | 5.20.9 | 7% |
| P11 | 1.60.6 | 2.00.6 | 37% |
| P12 | 8.61.0 | 7.31.0 | 63% |
| P13 | 36.91.7 | 52.92.4 | 100% |
| P14 | 2.00.6 | 1.30.5 | 60% |
| P15 | 3.40.7 | 2.20.6 | 79% |
| P16 | 2.00.6 | 1.70.6 | 30% |
| P17 | 2.60.7 | 2.10.6 | 42% |
| P18 | 1.50.6 | 2.50.7 | 73% |
| P19 | 4.60.9 | 4.80.9 | 8% |
| P20 | 1.70.6 | 2.10.7 | 32% |
| P21 | 3.00.7 | 1.10.5 | 98% |
| P22 | 3.70.8 | 4.51.0 | 48% |
| P23 | 2.60.7 | 2.80.7 | 13% |
| P24 | 2.00.8 | 2.80.9 | 47% |
| P25 | 7.61.0 | 3.50.8 | 100% |
| P26 | 6.91.1 | 3.60.9 | 99% |
| P27 | 13.81.3 | 12.11.3 | 64% |
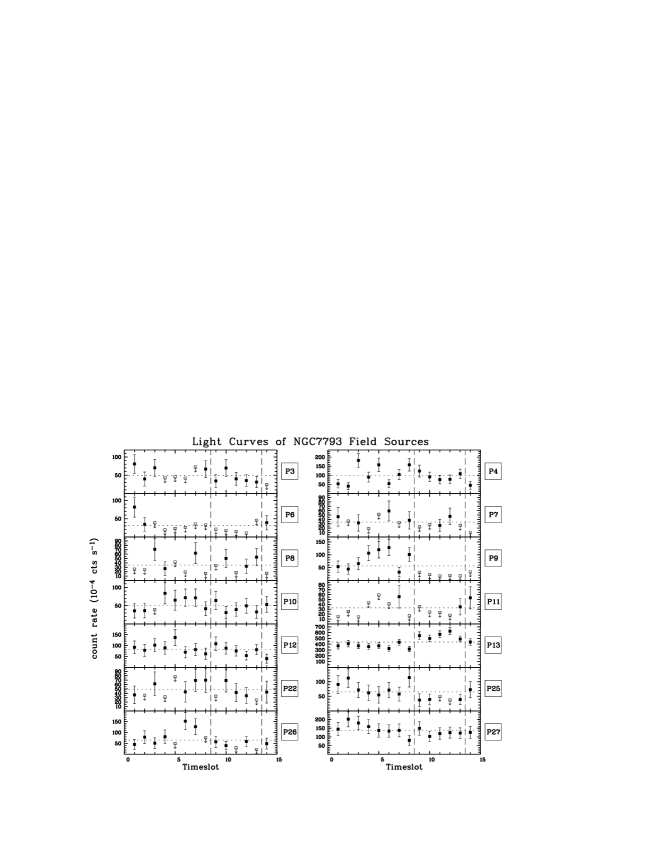
In an effort to search deeper into any further time variability present, the complete observation was binned into the 14 convenient observation blocks described above, and the same procedure was applied. Where a source was not detected with a likelihood (corresponding to a Gaussian significance of ), a upper limit to the count rate was calculated.
Fig. 4 shows the results of this analysis for 14 of the 27 sources. These 14 sources are the sources apparently associated with NGC 7793 (sources P6, P7, P8, P9, P10, P11 and P13) and those remaining sources containing in excess of 100 net counts (sources P3, P4, P12, P22, P25, P26 and P27). The lightcurves of the remaining 13 sources are generally of poor quality, and none show any significant signs of variability. When viewing Fig. 4, bear in mind that the x-axis is not linear; timeslot (or observation block number) is plotted, not time. Almost half a year exists between timeslots 8 and 9, and a week between timeslots 13 and 14.
Note that we are here interested in variations in the count rate from these sources, and not so much in the absolute values of these count rates, as these have been calculated earlier (Table 1). Hence we have been able to use smaller cut radii to avoid contamination from neighbouring sources. Differences in the calculated count rates between these two methods, however, appear to be negligible, except in cases involving sources embedded in extended emission (e.g. P10).
3 Results and discussion - the point sources
3.1 The NGC 7793 point sources
As can be seen in Fig. 1, several sources are detected within the central region of the PSPC field of view. Of particular interest to us are the sources apparently associated with NGC 7793. These seven sources are indicated in Table 1 by either a ‘NGC 7793’ or a ‘(?)’ in the last column, and it is these sources that we shall discuss first.
Spectra of all seven point sources lying within the optical confines of NGC 7793 (P6, P7, P8, P9, P10, P11 and P13) were analysed. Apart from the very bright P13, spectra were extracted for the remaining six objects from within circles of radius 10. The P13 spectrum was extracted from a circle of radius 15.
A ‘pure’ background spectrum was extracted from an annulus 5′75 from the centre of the field of view, with the data associated with each of the intervening point sources having been excluded to a radius of 2′.
It is obvious from Fig. 1, that several of the apparently NGC 7793-associated sources lie above, or appear embedded within, unresolved, perhaps diffuse, emission. Because of this, it was thought sensible to perform the source spectral fitting with not only the ‘pure’ background (extracted as explained above) as the background, but also with a ‘backgroundunresolved’ spectrum as the background. Though we describe the spectral properties of the unresolved emission in the next section, the extraction of the spectrum is described here, as it is used as a background spectrum in the fitting of the NGC 7793-associated sources.
The unresolved spectrum (which obviously also contains ‘pure’ background) was extracted from a circle of radius 5′, centred on the unresolved emission. Point source emission was excluded from this spectrum to radii of 075 (10 in the case of P13).
The seven source spectra were background-subtracted (with both the ‘pure’ background and the ‘pureunresolved’ background), and, once corrected for exposure and vignetting effects, were fitted with standard spectral models (power law, thermal bremsstrahlung, blackbody and Raymond & Smith (Raymond (1977)) hot plasma models). The results of all the best fits, both using the ‘pure’ background, and, in cases where they are of comparable or better quality, those using the ‘unresolved’ background, are given in Table 3 as follows: Source (col. 1) and spectral model, whether PL - power law plus absorption, TB - thermal bremsstrahlung plus absorption or BB - blackbody plus absorption (col. 2) (note that Raymond & Smith hot plasma plus absorption models did not give a best fit in any of the cases). Note also that a ‘U’ in brackets indicates that the ‘pureunresolved’ background has been used, as opposed to the ‘pure’ background. The next columns give the fitted (col. 3), the fitted photon index , where (col. 4), the fitted temperature (kT, in keV) (col. 5), and the reduced (col. 6). Note that in several cases (P7, P8 & P10), very low values of reduced are obtained. Here the errors are so large that a large range of models is able to fit the data very well. Nothing really can be said here as regards whether one model is significantly better than another. Two values of the (0.12.4 keV) luminosity are given (cols. 7& 8), one (col. 7) giving the ‘intrinsic’ luminosity of the source (i.e. correcting for the total (i.e. fitted) ), the second (col. 8) giving an ‘emitted’ luminosity (i.e. correcting merely for the Galactic ; 1.14 cm-2). All luminosities are calculated for an assumed distance of 3.38 Mpc.
Source P6 is X-ray faint, and lies some way from the optical confines of NGC 7793. It is however, almost coincident with a 16th magnitude stellar-like object, less than 3″ distant. P6’s spectrum, though rather unconstrained, is consistent with that of quasars, which typically have power-law spectra with photon indices in the range 2.20.2 (Branduardi-Raymont et al. Branduardi (1994); Roche et al. Roche (1995)). P6 is therefore likely to be a background source.
Source P7 is in many ways similar to P6. Again X-ray faint, and lying some way from the centre of NGC 7793, it too has a stellar-like (18th magnitude) counterpart, less than 2″ distant, visible in the H + Nii and the Siii images of Blair & Long (Blair (1997)), as a strong, slightly fuzzy source, which the authors do not attribute to anything belonging to NGC 7793. Again, as in the case of P6, P7’s spectrum is consistent with it being due to a background QSO (though the photon index is a little on the low side). Interestingly, a feature quite close to source P7 is visible in the Einstein IPC image (Fabbiano et al. Fabbiano92 (1992)) (it actually lies north of P7 and east of P6), though only a handful of counts were received. Again, like P6, P7 may be unrelated to NGC 7793, and instead is likely due to a background object.
Source P8 is very interesting, as it appears coincident (to within 3″) of a very bright H and Siii complex, identified in Blair & Long (Blair (1997)) as being associated with a supernova remnant (their S26), one of the largest and brightest in their NGC 7793 sample. The fact that the X-ray spectrum of P8 is best fit by a low-temperature thermal model is very encouraging, and adds credence to the idea that S8 is associated with the supernova remnant S26. Furthermore, note that an enhancement in 1.4 GHz radio continuum emission is seen coincident with P8 (Fig. 3), as would be expected if supernova activity were ongoing at this position. In fact, the situation is even more interesting than this as, as discussed in Blair & Long Blair (1997), the SNR NGC 7793-S26 is only the bright, high surface brightness portion of a much more extended, high [Siii]:H ratio, roughly oval emission region, which is thought, on account of its appearance, size, surface brightness, and lack of multiple loop structures, to be a collection of multiple supernovae, blowing out a large bubble of shock-excited gas, perhaps eventually becoming a superbubble. It is useful to compare the spectral properties of known H ii regions and superbubbles with P8. Williams & Chu (Williams (1995)) present hardness ratios (calculated in their paper as the difference divided by the sum of high- (1.02.5 keV) and low- (0.11.0 keV) counts) for H ii regions in M101 and superbubbles in the LMC. The hardness ratio (calculated in the same way) for P8 (0.52) is soft, and agress very favourably both with the majority of the M101 H ii regions, and all of the Williams & Chu (Williams (1995)) superbubbles. We must be careful however, as it can be seen in Fig. 4 that there may be some evidence for time-variability within source P8. If this were true, then this would point against P8 being due to a superbubble. Note that the limits in Fig. 4 are not very restrictive however, and that the probability of time-variability for P8, when comparing the two main observations, is very low (see Table 2).
Source P9, though quite bright, appears coincident with nothing whatsoever. Situated at the very north-eastern edge of a filament of material from NGC 7793, it may well be associated with the host galaxy, though no bright H ii regions or plausible sites of significant supernova activity lie anywhere within 1′. Also, no enhancement at all in the radio emission is seen at this position (see Fig. 3), and the nearest optical counterpart, over 7″ distant, is very faint (below 21st magnitude). The X-ray spectrum of P9, though very unconstrained, is very strange also, being very steep, but very absorbed. One other interesting facet of P9’s X-ray emission can be gleaned from Fig. 4 and the discussion within Section 2.1 it is most definitely variable. There is a very significant difference between the X-ray strength of P9 during the first observation (Dec. 92), where some evidence for a gradual rise in brightness is seen, and the strength of the emission during the second observation (May 93), where very little emission is seen (see Table 2). This change in the flux level of source P9 is very apparent in Fig. 5, where contours of hard band (channels 52201) X-ray emission are shown for each of the two separate observations, the December 1992 observations and the May 1993 observation. In the Einstein image of Fabbiano et al. (Fabbiano92 (1992)), a feature is observed less than 15″ from the position of P9. Again however, as with the Einstein feature tentatively associated with P7/P6, very few counts (around 67) were obtained. P9 is probably though, on account of its lying within the optical confines of NGC 7793, and its unusual spectrum, associated with NGC 7793.
| Source | Model | Photon | red. | (1038 erg s-1) | |||
|---|---|---|---|---|---|---|---|
| 1020 cm-2 | Index | (keV) | (Intrinsic) | (Emitted) | |||
| (1) | (2) | (3) | (4) | (5) | (6) | (7) | (8) |
| P6 | PL | 1.9 | 2.182.06 | 1.23 | 0.380.09 | 0.270.07 | |
| TB | 0.9 | 1.24 | 1.23 | 0.260.06 | 0.260.06 | ||
| P7 | PL | 1.91.1 | 1.371.59 | 0.19 | 0.400.09 | 0.360.08 | |
| TB | 1.6 | 12.9 | 0.19 | 0.390.09 | 0.360.08 | ||
| P8 | TB | 7.8 | 0.360.25 | 0.21 | 1.380.30 | 0.390.08 | |
| BB | 3.1 | 0.170.05 | 0.16 | 0.440.10 | 0.350.08 | ||
| P9 | PL | 37.38.9 | 3.914.18 | 1.02 | 52.67.42 | 0.640.09 | |
| TB | 20.9 | 0.64 | 1.04 | 2.660.38 | 0.640.09 | ||
| P10 | TB | 2.91.6 | 0.770.64 | 0.14 | 1.240.14 | 0.830.09 | |
| TB(U) | 3.32.2 | 0.630.52 | 0.06 | 1.240.14 | 0.740.08 | ||
| P11 | PL | 0.1 | 0.720.81 | 1.84 | 0.310.07 | 0.310.07 | |
| PL(U) | 1.3 | 0.781.41 | 0.71 | 0.280.06 | 0.270.06 | ||
| P13 | PL | 12.08.2 | 1.760.45 | 1.21 | 17.80.59 | 8.680.29 | |
| TB | 9.83.8 | 3.49 | 1.27 | 14.00.46 | 8.710.29 | ||
| PL(U) | 13.510.9 | 1.760.55 | 1.26 | 18.00.59 | 8.490.28 | ||
Source P10 lies nearest to the centre of NGC 7793, and appears embedded in diffuse emission (as an aside, it is interesting to note that no nuclear enhancement is visible, either as a nuclear point source, or as an increase in unresolved emission). Though in a region containing much supernova activity and H ii regions, no particular sources stick out as probable counterparts within the work of Blair & Long (Blair (1997)). The same is true as regards the radio emission (Fig. 3) though a number of enhancements in the radio emission are visible within the NGC 7793 disc, none are particularly coincident with P10. P10 is likely however, to be due, as in the case of source P8, to a superbubble, or collection of supernova remnants, given the fact that it appears constant in flux (Fig. 4) and that a good thermal low-temperature fit to its spectrum is obtained. A fitted absorbing column of greater than (although consistent with) the Galactic column, may indicate that source P10 lies, in some way, beneath a layer of diffuse emission.
Source P11 appears similar to both source P6 and P7, in that it is a faint X-ray source with a bright stellar-like counterpart that shows up both as a source of H and Siii emission (Blair & Long Blair (1997)). Also, as with sources P6 and P7, no significant radio counterpart appears to exist, and some hint of X-ray variability is present, though the low number of counts (in all of these three cases) make it impossible to attach any degree of certainty to this last statement. Interestingly, a significantly better fit to P11’s spectrum is obtained, when the diffuse emission is included in the background (indicating that significant diffuse emission is present at this position, as is evident from Fig. 2). The best power-law fit (both with ‘pure’ and with ‘pure + unresolved’ background) suggests, in contrast to sources P6 and P7, a very flat spectrum, indicating a non-QSO origin. Given this, and the optical correlations described above, P11 is likely to belong to NGC 7793.
Source P13, the brightest source in the vicinity of NGC 7793 (and indeed in the entire PSPC field of view), is perhaps the most interesting source detected. It is clearly visible in the Einstein image of Fabbiano et al. (Fabbiano92 (1992)), dominating the emission from NGC 7793. Though the X-ray position they quote lies some 15″ east and 28″ north of P13, it should be noted that the Einstein positions are not thought to be too accurate (1′; e.g. Margon et al. (Margon (1985))). This 1850 s Einstein observation obtained almost 40 source counts from within a circle of radius 25, leading to an estimated flux of 6.81 erg cm-2 s-1. Note that in the Einstein case, (1) this circle, apart from containing P13, also contains our sources P10 and P11, (2) this circle will also contain a hard (0.5 keV) component of the unresolved emission, and (3), in calculating their flux value, Fabbiano et al. (Fabbiano92 (1992)) were only, due to the very poor spectral resolution of the Einstein IPC, able to assume a nominal 5 keV thermal bremsstrahlung spectrum.
P13 has had a series of optical follow-up observations made on it. It appears for instance, in Margon et al.’s (Margon (1985)) atlas of X-ray selected quasi-stellar objects, in which optical identifications of objects serendipitously detected by Einstein, were made. Here, spectra were obtained for all candidate objects within the X-ray position regions, to a limit of . An object (named 2355-329) with a QSO-type spectrum is observed in the vicinity of source P13, at a redshift (the smallest in Margon et al.’s (Margon (1985)) sample) of 0.071 (corresponding to a distance of 280 Mpc, assuming H km s-1 Mpc-1). The object is very strong in [Oii] , and shows a large UV excess on the CTIO 1 m plate.
More recently, Bowen et al. (Bowen (1994)) have presented finding charts and optical positions, accurate to 1″, for several QSOs, including the one to the south of NGC 7793. They name it 2355-3254 and give its 2000.0 position as 23h57m52.39s, -32∘38′17.1″. Margon et al. (Margon (1985)) quote the large discrepancy between the optical and Einstein positions (just over an arcminute), stating that the Einstein positions are ‘accurate to of order 1′’.
Though this may have been true, the problem still exists the ROSAT-detected source P13 lies just less than an arcminute north-by-northwest of the optical source 2355-329. This is shown clearly in Fig. 6, where contours of broad-band (Ch. 8235) X-ray emission are shown superimposed upon on optical image of the southern part of NGC 7793. The Margon et al. (Margon (1985)) proposed optical counterpart, the QSO at a redshift of 0.071, is actually the leftmost of the two point-like objects, an arcminute or so to the south of the X-ray contour peak.
The ROSAT X-ray position is far more accurate than the Einstein position (just over 4″, in the case of P13), and, as such, we can conclude that the bright X-ray source P13 is not associated with the QSO-type object 2355-329. The spectral properties of source P13 are consistent with that of a QSO or high-mass X-ray binary. The best fit to the P13 spectrum (tabulated in Table 3, and shown in Fig. 7) is a power-law model with a photon index of 1.760.45 (see above discussion regarding P6).
P13 does appear to be significantly variable. While the fitting of the P13 lightcurve (see Fig. 4) to a constant flux level results in a of 40.85 (suggesting a variability at the 3.9 (=9.21) significance level), the difference in count rates obtained during the December 1992 and May 1993 observations (see Table 2) confirm that P13 is most definitely variable.
Given the lack of any obvious counterpart (as is evident both in Fig. 6 and in Blair & Long (Blair (1997))), and the evidence presented here, the true nature of P13 still remains a mystery. The variability is strongly suggestive of the emission being due to a single object, and not, for instance, to a collection of X-ray binaries, say. It could be due a background QSO, though the emission spectrum is a little flat when compared with typical QSOs, and it would have to be a radio quiet system, as no significant enhancement in radio emission is seen (Fig. 3). P13 could be a young supernova, as these can attain X-ray luminosities equal to or greater than that of P13. SN 1980K (in NGC 6946), SN 1986J (in NGC 891), SN 1978K (in NGC 1313), SN 1993J (in M81) (see Schlegel (Schlegel95 (1995)) and the references therein) and SN 1979C (in M100; Immler et al. Immler (1998)) have all attained X-ray luminosities greater than or equal to that of P13. Furthermore, even though P13’s emission is hard, its hardness ratio (calculated as in the case of P8) being positive (+0.14), supernovae are seen to show a large range in spectral hardness (Schlegel Schlegel95 (1995); Bregman & Pildis (Bregman92 (1992)). The fact, however, that nothing significant is seen in the radio (Fig. 3), and that the putative supernova was never actually observed in outburst, suggest strongly against the supernova argument. If P13 is contained within NGC 7793, then it is certainly a superluminous source. It is unlikely to be an X-ray nova, unless we have caught it in outburst in both the December 1992 and the May 1993 observations. Instead it is most likely (if it is contained within NGC 7793) to be due to an accreting binary. Bearing in mind however, that the Eddington limit for a compact object is erg s-1, then P13’s X-ray emission suggests the prescence of a massive () black hole X-ray binary. Finally, nothing more conclusive can be said regarding the nature of P13, when one considers its ratio. One can estimate a limiting optical magnitude at the position of P13 from the U.K. Schmidt digitised sky survey optical image (shown in Figs. 2, 5 and 6). This limit (), when used in conjunction with the method of Maccacaro et al. (Maccacaro88 (1988)), gives rise to a ratio of around 5, rather high, but consistent with that of AGNs and X-ray binaries.
3.2 The secondary point sources
Many of the remaining bright sources within the NGC 7793 field are interesting. P3, appears to be non-variable, and is undoubtedly associated with a star-like object ( magnitude = 19.5), given the good spatial correlation between the object position and the X-ray position (5″), and the lack of any other, even faint optical counterpart within more than half an arcminute. The identity of P4 is more uncertain, as two very faint sources lie within 3″ of the X-ray position. A bright star (=15.5), lying nearly 17″ distant, is unlikely to be the source, given the error in the X-ray source position (54; see Table 1). P12 is almost definitely associated with a (=18.3) galaxy. The spatial correlation between optical and X-ray position is excellent (17), and no other, even faint feature is observable out to 25″. Note also that P12 appears to be very constant in flux. Source P22 is, in many ways, identical to P12, though the identification is less certain. Though a bright (=13.9) galaxy, 46 from the P22 X-ray position, is likely to be the host, the error on the X-ray position is large (nearly 20″), encompassing a faint (=20.2) star. Though the nearest feature to source P25 (as given in Table 1) lies some 62 distant, the true optical counterpart is perhaps more likely to be a far brighter (=15.6) star-like feature, 12″ distant (note though, that the error on the X-ray position is somewhat less than this). The nearest source to P26’s X-ray position (a =19.4 star-like object) lies some 112 distant, a problem perhaps, if it weren’t for the fact that the error on P26’s X-ray position (161; Table 1) is large. Finally, P27 is almost certainly associated with a =18.8 star-like object, nearly 4″away. A small error in the X-ray position, together with a constant X-ray flux level, and a lack of any other optical features within more than 20″ of the X-ray position, makes this statement quite secure.
P14, P15 and P19 all appear to have radio counterparts (see Fig. 3 and the discussion thereof). Though no optical counterpart to P14 is seen out to a distance of almost 05, P19 lies only 35 from a (=19.3) star-like object. Both objects are likely to be background AGN. P15 seems to be the most interesting of the three however, as it lies between two very bright radio features (which have been overexposed in Fig. 3). Furthermore, a very faint (=20.9) optical feature is seen 11 away from the X-ray position. This source is very suggestive of being an X-ray bright AGN with a double-lobed radio source (the rightmost lobe seemingly being directed towards us). Many sources of this type have been found in the REX survey (Maccacaro et al. Maccacaro98 (1998)), a project aiming, through the cross-correlation of radio and X-ray surveys, to select large samples of BL Lac objects and other kinds of radio loud AGN. P15 appears to be a REX (a Radio Emitting X-ray source), and may indeed be a BL Lac.
4 Results and discussion - the unresolved emission
4.1 The unresolved emission - spectral properties
As has been discussed briefly before and, as is evident from both the soft band image of Fig. 1 and from Fig. 2, a good amount of unresolved, perhaps diffuse emission is present. Good evidence that a significant fraction of this unresolved X-ray emission is truly diffuse is seen in the radio (Fig. 3), where what appears to be diffuse continuum emission is seen covering the NGC 7793 disc. This diffuse radio emission is very likely due to supernovae and supernova remnants, which would give rise to diffuse X-ray emitting gas also.
A spectrum of this unresolved X-ray emission, together with a background spectrum were extracted, as described in Sect. 3. As in the fitting of the point source spectra, spectral models were fitted to this unresolved emission spectrum. Power law plus absorption, thermal bremsstrahlung plus absorption and Raymond & Smith hot plasma plus absorption models were each used in the fitting process, and the results of the best model fits are given in Table 4, the columns being identical to those of Table 3 (see Sect. 3). Note again, that the very low values of reduced are really a reflection of the statistics, and nothing concrete can be said regarding whether one model is significantly better than another. Note also that all luminosities (calculated again for an assumed distance of 3.38 Mpc) have been scaled up to allow for the emission lost in the ‘holes’ left after the source subtraction procedure.
| Model | Photon | red. | (1038 erg s-1) | ||||
| 1020 cm-2 | Index | (keV) | (Solar) | (Intrinsic) | (Emitted) | ||
| (1) | (2) | (3) | (4) | (5) | (6) | (7) | (8) |
| RS | 0.9 | 1.010.56 | 0.06 | 0.36 | 4.070.42 | 4.070.42 | |
| 1.14(F) | 0.970.30 | 0.040.02 | 0.31 | 4.320.45 | 4.320.45 | ||
| TB | 1.81.8 | 0.850.40 | 0.49 | 5.310.55 | 4.270.44 | ||
| 1.14(F) | 1.110.48 | 0.51 | 4.590.47 | 4.590.47 | |||
| PL | 3.53.4 | 2.581.03 | 0.65 | 10.531.09 | 4.470.46 | ||
| 1.14(F) | 1.850.25 | 0.93 | 4.800.50 | 4.800.50 | |||
As can be seen, thermal models give very good results, the Raymond & Smith (RS) hot plasma model being the best (though all are good). The unresolved emission spectrum and the best (RS) model is shown in Fig. 8. The size of the error regions can be seen in Fig. 9, where Gaussian contour levels of 1, 2 and 3 are shown in the metallicitytemperature and the temperatureabsorption column plane for the Raymond & Smith hot plasma model (note that the equivalent bottom plot for the thermal bremsstrahlung model is essentially identical, though the error regions are slightly larger). The RS absorption column value is entirely consistent with the column out of our own Galaxy in the direction of NGC 7793, 1.14 cm-2 (Dickey & Lockman Dickey (1990)), and when the column is frozen at this value, an equally good fit is obtained with no change in the other parameters. This is indicative of the emission having no intrinsic absorption, i.e. lying, in some sense, above the host galaxy NGC 7793. This is good evidence for the majority of this unresolved emission being truly diffuse gas.
The temperature of the unresolved emission appears to lie in the range 0.71.7 keV, with a best fit value of 1 keV. This is rather on the high side when compared with other galaxies, where the temperature of the diffuse emission has been estimated to be more like 0.5 keV or lower (e.g. Bregman & Pildis Bregman94 (1994); Wang et al. Wang (1995); Ehle et al. Ehle (1995); Snowden & Pietsch Snowden95 (1995); Read et al. Read97PS (1997); Pietsch & Vogler Pietsch98b (1998)), and may indicate that some fraction of the unresolved emission associated with NGC 7793 may be due to unresolved point sources.
It is here we must proceed with some caution. There are several threads of evidence indicating that the unresolved emission is not truly diffuse, and is contaminated to some degree with unresolved point source emission. Firstly, as discussed above, the temperature is high. Secondly, as can be seen in Fig. 5, even in the hard band, where the unresolved emission contributes only a little, variations in the unresolved emission structure can be seen between the December 1992 and the May 1993 observations (note the changes in the ‘plumes’ to the north-east and north-west of the bright southern P13 source). Whether these changes are significant is very difficult to say, as the features in question lie at the 2 or 3 level. Nevertheless, point-source contamination appears very possible. Comparison of equivalent soft band images to those in Fig. 5, where the unresolved emission (or at least the diffuse component of the unresolved emission) contributes most, is fraught with difficulties, on account of the large increase in the entire field-of-view background (mentioned earlier in Sect. 2) during the second half of the December 1992 observation. Nothing very conclusive can be said regarding the variation in the unresolved emission via this method.
In a further effort to establish whether there is any variation in the unresolved emission, a similar procedure to that performed on the point sources was performed here. Both the unresolved (the sources having been again removed to radii of 075 (10 for P13)) and the background emission were binned (using the same spatial regions as used in the extraction of the equivalent spectra) into the two separate December 1992 and May 1993 observations, and also into the 14 individual observation blocks. The unresolved emission was then corrected for background, vignetting effects and exposure time, leading to unresolved emission count rates of 3.231.07 cts s-1 arcmin-2 (December 1992) and 3.770.54 cts s-1 arcmin-2 (May 1993) (note the larger error in the December observation due to the increased background contamination). This gives rise to a probability of variability of 55.1% (significant at only the 0.76 level). Furthermore, fitting of the 14-block lightcurve to a constant count rate results in a good fit (with a of 14.15), suggesting that the unresolved emission is only variable at a significance level of 0.91 (1.01). The unresolved emission therefore appears to be non-variable in terms of flux level, though this of course, does not exclude the possibilty of the emission being contaminated with unresolved point sources.
Another way to search for contamination within the unresolved emission from unresolved point sources, is to search for these sources spectrally. Several two-component models were fitted to the unresolved emission spectrum. These models had the general form of a cool (0.5 keV, more typical of spiral halos), unabsorbed thermal component, representing the true diffuse gaseous emission, and a hot (10 keV) component, representing any unresolved point source component. Though all avenues were explored in terms of variation of models and freezing and freeing of parameters, no significant improvement on the one-component RS model was obtained.
Assuming at first then, that this unresolved emission is due entirely to hot gas, then mean physical properties of this gas can be inferred from the above results if we make some assumptions about the geometry of the emission. Here we have assumed the simple geometry of the emission being hemispherical with a radius of 35 (in actuality, only a rough approximation to the gas properties can be calculated here and assumption of a slightly different radius gives rise to very similar results).
Using the volume derived for this hemispherical ‘bubble’ model, the fitted emission measure (where is the ‘filling factor’ – the fraction of the total volume which is occupied by the emitting gas) can be used to infer the mean electron density, , and hence the total mass , thermal energy and cooling time of the gas.
Performing these calculations, after first accounting for the extra emission lost in the ‘holes’ left after the source-subtraction procedure, one arrives at approximate values to the physical properties of the gaseous emission as follows; X-ray luminosity (0.12.4 keV) 4.1 erg s-1; , 4.6 cm-3; , ; , 5.4 erg; , 4.2 Gyr. If, as seems likely however, some contamination from unresolved point sources exists, then the above results should only be taken as upper limits.
5 NGC 7793 as a member of the Sculptor Group
In comparing the X-ray properties of NGC 7793 with other galaxies, it is useful to compare its properties with those of its group neighbours.
The Sculptor group is possibly the nearest small group of galaxies to our own Local Group, and as such, much is known about the individual members. Kinematical studies (e.g. Puche & Carignan Puche88 (1988)) have established the group to be made up of five major members (NGC 55, NGC 247, NGC 253, NGC 300 and NGC 7793). Other smaller galaxies, such as NGC 24 and NGC 45, were found to be more distant, and although dwarf galaxies do exist within Sculptor (e.g. Lausten et al. Lausten (1977)), they contribute essentially nothing to the group emission or dynamics. Now, with the completion of the present work, all five major Sculptor members have had their X-ray properties analysed and the results presented (e.g. Schlegel et al. Schlegel (1997); Read et al. Read97PS (1997); Vogler & Pietsch Vogler (1998); Pietsch & Vogler Pietsch98b (1998)). The ROSAT PSPC observations of all four of NGC 7793’s neighbours have been analysed in a self-similar way, and are presented in Read et al. (Read97PS (1997)).
Basic properties (including the present X-ray results) of the five Sculptor galaxies are given in Table 5, as follows; Col. 1 gives the galaxy name. Cols. 2, 3 and 4 give the galaxy type, diameter and axis ratio (all taken from de Vaucouleurs et al.’s (RC3 (1991)) Third Reference Catalog of Bright Galaxies). For each of NGC 7793’s neighbours, the galaxy distances quoted in Tully (Tully (1988)) are given in col. 5. These are based on km s-1 Mpc-1, and assume that the Galaxy is retarded by 300 km s-1 from universal expansion by the mass of the Virgo cluster. Optical (B) luminosities (col. 6) are taken from Tully (Tully (1988)) and FIR luminosities (col. 7) are calculated from IRAS 60 and 100 m fluxes using the expression
(see e.g. Read & Ponman Read95P (1995)). Here is the distance in Mpc and and , the IRAS 60 and 100 m fluxes (in Janskys), are taken from Soifer et al. (Soifer (1989)) and from Rice et al. (Rice (1988)). The (0.12.4 keV) X-ray luminosities (from Read et al. (Read97PS (1997)) and the present paper) are given in col. 8. We have here assumed, with reference to the discussion in Sect. 3, that sources P6 and P7 are not associated with NGC 7793. Two sets of values are given for NGC 7793 however, based on the fact that the true nature of source P13 (the brightest in the field) is not known. It may or may not be associated with NGC 7793. Ratios of the three luminosities are given in cols. 9, 10 and 11, and the temperature of the diffuse X-ray emission is given in col. 12. The values for NGC 247, NGC 253 and NGC 300 are taken from Read et al. (Read97PS (1997)), the value for NGC 55 is taken from Schlegel et al. (Schlegel (1997)).
| Galaxy | Type | Diam. | Axis | Dist. | Log luminosity (erg s-1) | Luminosity ratios () | |||||
| (kpc) | ratio | (Mpc) | (keV) | ||||||||
| (1) | (2) | (3) | (4) | (5) | (6) | (7) | (8) | (9) | (10) | (11) | (12) |
| NGC 55 | SBS9 | 12.3 | 5.8 | 1.3 | 43.02 | 41.94 | 38.91 | 830 | 0.78 | 9.3 | 1 |
| NGC 247 | SXS7 | 13.1 | 3.1 | 2.1 | 42.96 | 41.48 | 38.68 | 330 | 0.52 | 16.0 | 0.16 |
| NGC 253 | SXS5 | 24.0 | 4.1 | 3.0 | 43.78 | 43.74 | 40.04 | 9100 | 1.80 | 2.0 | 0.39 |
| NGC 300 | SAS7 | 7.6 | 1.4 | 1.2 | 42.52 | 41.43 | 38.18 | 810 | 0.46 | 5.6 | (0.1) |
| NGC 7793 | SAS7 | 9.1 | 1.5 | 3.4 | 43.01 | 42.23 | 39.17 | 1700 | 1.45 | 8.7 | 0.97 |
| (w/out P13) | 38.78 | 0.59 | 3.6 | ||||||||
As one can see from Table 5, NGC 7793 is, like all the members of the Sculptor group, a late-type spiral galaxy. It appears, in spite of its small size, to be the second most active galaxy in the group, at least in terms of its far-infrared properties, the most active being of course the famous large starburst, NGC 253. Disregarding NGC 253 for the moment, NGC 7793, although small, is as optically bright or brighter than the remaining three, and has the highest value of the four non-starbursts.
In terms of NGC 7793’s X-ray emission, the situation is complicated by the fact that P13 may or may not belong to the galaxy. If it does, then NGC 7793 appears to lie midway between the very quiescent NGC 55, NGC 247 and NGC 300, and the starburst NGC 253, lying directly on the correlation of Read & Ponman (Read98 (1998)), and slightly above their correlation. If P13 does not belong, then NGC 7793 lies under the correlation, appearing almost identical to M33 (Read et al. Read97PS (1997)), and directly on the correlation, almost coincident with NGC 55.
Why NGC 7793 is relatively rather bright (in all wavebands, possibly including the X-ray) for its size may be due to that fact; its size, or rather, the size of its dark halo. In an effort to explain why, when the average value of , for the individual Sculptor galaxies (the value for NGC 7793 itself being the smallest, at around 5), the value for the group as a whole is ten times higher, Puche & Carignan, in a series of papers (Puche91 (1991) and the references therein), produced H i rotation curves and mass models for each of the five individual systems. NGC 7793 is seen to possess the only truly declining rotation curve, and as such, is very rare within the local universe (Carignan & Puche Carignan90 (1990)). In fact, a model comprising the luminous components and ‘no dark matter’ can be adequately fit to the NGC 7793 H i data. Its halo is found to be very small ( kpc, approximately the size of the diffuse X-ray emission region), and its central density is found to be a factor 1015 higher than is seen in other late type spirals.
An interesting aspect of the X-ray emission from NGC 7793 is the unresolved emission, and more specifically, its temperature. As mentioned earlier, the temperature obtained in the spectral fitting of the unresolved spectrum, 1 keV, is high, typical normal and starburst galaxies containing diffuse emission at temperatures more like 0.5 keV or lower. Note (from Table 5) that the estimated temperature of the ‘diffuse’ emission in NGC 55, is also around 1 keV (Schlegel et al. Schlegel (1997)). As we shall see here, comparing these two systems’ unresolved emission properties is particularly useful.
It is very possible, as discussed earlier, that the unresolved emission is due in part to unresolved sources. We have discussed earlier our unsuccessful search for this unresolved component, but perhaps it is worth some further discussion on more theoretical grounds. Following similar arguments to those of Primini et al. (Primini (1993)), and to those of Schlegel et al. (Schlegel (1997)) (who analysed the NGC 55 unresolved emission), one can arrive at some interesting conclusions as regards the integrated emission of the unresolved point sources (i.e. stars, supernova remnants, cataclysmic variables and low- and high-mass X-ray binaries) within NGC 7793.
Because of their very similar unresolved X-ray emission properties, both in terms of luminosity (3.0 erg s-1 for NGC 55, compared to 4.1 erg s-1 in the present case) and temperature, many of the conclusions reached as regards NGC 55 by Schlegel et al. (Schlegel (1997)), can be applied here to NGC 7793. NGC 7793’s smaller size however, means that the constraints placed are even more severe. For instance, both cataclysmic variables (with typical ’s of erg s-1; Cordova (Cordova (1995))) and active stars ( erg s-1) fail, by well over two orders of magnitude, to account for the unresolved X-ray emission within NGC 7793. Supernova remnants (, typically being erg s-1) could account for the emission, though a few hundred would be needed (compared to the 28 detected by Blair & Long (Blair (1997)). A further problem related to SNRs accounting for the unresolved emission, is that, as NGC 7793 is rather face-on, the SNR spectra would be relatively unabsorbed, and therefore too soft, when compared with the rather hard unresolved spectrum observed.
X-ray binaries however, may well be able to explain the unresolved emission within NGC 7793. Only a hundred or so low-luminosity ( erg s-1) systems, or just a handful of high luminosity ( erg s-1) systems are required to account for the flux seen. Furthermore, the unresolved emission appears to be rather uniform (see Fig. 2), and follows the disc quite well, as would a population of evolved stars.
One must be careful however as, for instance, if there were a largish collection of XRBs within NGC 7793, we might expect to detect some, especially within the disc. All of the discrete sources detected, with the exception of source P10 (which is likely a SNR or superbubble), appear around the edge of the galaxy. No plausible XRB candidates are detected within the NGC 7793 disc. Source P13 may possibly be a high-mass XRB, though its luminosity is several times the Eddington limit for a compact object ( erg s-1). Furthermore, though the temperature obtained for the unresolved emission is somewhat hotter than is generally seen in spiral galaxies, it is not very hot, and is constrained, at least at the 1 confidence level to be less than keV. This may be too cool for the emission to be explained in terms of a large proportion of it being due to evolved stars (note the confidence limit to the unresolved emission temperature is rather much high, however).
6 Summary
We have observed the ROSAT PSPC data from a field centred on the nearby Sculptor galaxy NGC 7793. 27 sources are detected within the central 25′25′area, several appearing to be variable, and the brightest being situated to the south of NGC 7793. In addition to point source emission, unresolved residual emission is detected within and around NGC 7793. Our findings with regard to the observed point-source and unresolved emission can be summarized as follows:
1. Seven point sources are detected within the optical confines of NGC 7793, two of which appear to be unrelated to the host galaxy. Four of the others appear to be associated with X-ray binaries, supernova remnants or superbubbles within the galaxy. Interestingly, no significant enhancement is seen at the galactic nucleus.
2. The remaining source, the brightest point source in the field, lies on the southern rim of NGC 7793, and is now seen not to be associated with a redshift QSO, as was previously thought. It may be associated with NGC 7793 (with a (0.12.4 keV) of 8.7 erg s-1), though no obvious counterpart is seen. It is seen to be significantly time variable, and may be a high-mass, possibly black hole X-ray binary.
3. Unresolved residual emission is also observed, quite uniformly distributed over the galaxy, extending to a radius of perhaps 4 kpc. Spectral fitting of this emission indicates that it is intrinsically, rather unabsorbed, suggesting that a large component of the emission may be diffuse hot gas surrounding the system. The fitted temperature however ( keV) implies that a significant contribution from unresolved point sources (here thought to be X-ray binaries) is likely.
4. Comparison of NGC 7793’s X-ray properties with its Sculptor group neighbours (and with other galaxies in general) depends largely on whether the bright source P13 is associated with NGC 7793 or not. If it is, then NGC 7793, in terms of its activity, lies somewhere between the very quiescent Sculptor galaxies NGC 55, NGC 247 and NGC 300, and the well-known starburst NGC 253. If P13 is unrelated to NGC 7793, then NGC 7793 appears rather similar to its quiescent neighbours.
Acknowledgements.
AMR acknowledges the grateful receipt of a Royal Society fellowship during this work. We are also very grateful to Thomas Boller for carefully reading this manuscript, to Andreas Vogler for his X-ray-optical overlay routines, and to the referee, whose comments and suggestions have improved the paper. This research has made use of the SIMBAD database operated at CDS, Strasbourg. Optical images are based on photographic data obtained with the UK Schmidt Telescope, operated by the Royal Observatory Edinburgh, and funded by the UK Science and Engineering Research Council, until June 1988, and thereafter by the Anglo-Australian Observatory. Original plate material is copyright (c) the Royal Observatory Edinburgh and the Anglo-Australian Observatory. The plates were processed into the present compressed digital form with their permission. The Digitized Sky Survey was produced at the Space Telescope Science Institute under US Government grant NAG W-2166. Finally, we thank our colleagues from the MPE ROSAT group for their support. The ROSAT project is supported by the German Bundesministerium für Bildung, Wissenschaft, Forschung und Technologie (BMBF/DLR) and the Max-Planck-Gesellschaft (MPG).References
- (1) Blair W.P., Long K.S., 1997, ApJS, 108, 261
- (2) Bowen D.V., Osmer S.J., Blades J.C., Tytler D., Cottrell L., Fan X.-M., Lanzetta K.M., 1994, AJ, 107, 461
- (3) Branduardi-Raymont G., et al., 1994, MNRAS 270, 947
- (4) Bregman J.N., Pildis R.A., 1992, ApJ, 398, L107
- (5) Bregman J.N., Pildis R.A., 1994, ApJ, 420, 570
- (6) Carignan C., 1985, ApJS, 58, 107
- (7) Carignan C., Puche D., 1990, AJ, 100, 394
- (8) Condon J.J., Cotton W.D., Greisen E.W., Yin Q.F., Perley R.A., Taylor G.B., Broderick J.J., 1998, AJ, 115, 1693
- (9) Cordova F., 1995, in Lewin W. (ed) X-ray Binaries, Cambridge University Press, Cambridge
- (10) Cruddace R.G., Hasinger G.R., Schmitt J.H.M.M., 1988, in Murtagh F., Heck A. (eds), Astronomy from large databases, ESO Conference and Workshop Proc. 28, p. 177
- (11) de Vaucouleurs G., de Vaucouleurs A., Corwin H.G., Jr., Buta R.J., Paturel G., Fouqué P., 1991, Third Reference Catalogue of Bright Galaxies (RC3). Springer-Verlag, New York
- (12) Dickey J.M., Lockman F.J., 1990, ARA&A 28, 215
- (13) Ehle M., Pietsch W., Beck R., 1995, A&A, 295, 289
- (14) Fabbiano G., Kim D.-W., Trinchieri G., 1992, ApJS 80, 531
- (15) Hasinger G., Turner T.J., George I.M., Boese G., 1992, OGIP calibration memo CAL/ROS/92-001
- (16) Immler S., Pietsch W., Aschenbach B., 1998, A&A, 331, 601
- (17) Irwin M., Maddox S., McMahon R., 1994, Spectrum, 2, 14
- (18) Lausten S., Richter W., van der Lans J., West R.M., Wilson R.N., 1977, A&A, 54, L639
- (19) Maccacaro T., Gioia I.M., Wolter A., Zamorani G., Stocke J.T., 1988, ApJ, 326, 680
- (20) Maccacaro T., Caccianiga A., Della Ceca R., Wolter A., Gioia I.M., 1998, AN, 319, 15
- (21) Margon B., Downes R.A., Chanan G.A., 1985, ApJS, 59, 23
- (22) Pfeffermann E., et al., 1986, Proc. SPIE 733, 519
- (23) Pietsch W., Trinchieri G., Vogler A.J., in preparation
- (24) Pietsch W., Vogler A.J., in preparation
- (25) Primini F., Forman W., Jones C., 1993, ApJ, 410, 615
- (26) Puche D., Carignan C., 1988, AJ, 95, 1025
- (27) Puche D., Carignan C., 1991, ApJ, 378, 487
- (28) Raymond J.C., Smith B.W., 1977, ApJS 35, 419
- (29) Read A.M., Ponman T.J., 1995, MNRAS 276, 1327
- (30) Read A.M., Ponman T.J., Strickland D.K., 1997, MNRAS 286, 626
- (31) Read A.M., Ponman T.J., 1998, in preparation
- (32) Rice W., Lonsdale C.J., Soifer B.T., Neugebauer G., Kopan E.L., Lloyd L.A., de Jong T., Habing H.J., 1988, ApJS, 68, 91
- (33) Roche N., Shanks T., Georgantopoulos I., Stewart G.C., Boyle B.J., Griffiths R.E., 1995, MNRAS 273, L15
- (34) Sandage A., Tammann G., 1987, A Revised Shapley-Ames Catalog of Bright Galaxies (Carnegie Inst. Washington Publ. 635) (2d ed.; Washington: Carnegie Inst. Washington)
- (35) Schlegel E.M., 1995, Rep. Prog. Phys., 58, 1375
- (36) Schlegel E.M., Barrett P., Kulinder P.S., 1997, AJ 113, 1296
- (37) Snowden S.L., McCammon D., Burrows D., Mendenhall J., 1994, ApJ 424, 714
- (38) Snowden S.L., Pietsch W., 1995, ApJ, 452, 627
- (39) Soifer B.T., Boehmer L., Neugebauer G., 1989, AJ, 98, 766
- (40) Trümper J., 1992, QJRAS 33, 165
- (41) Tully R.B., 1988, Nearby Galaxies Catalogue. Cambridge University Press, Cambridge
- (42) Vogler A.J., Pietsch W., 1998, in preparation
- (43) Wang Q.D., Walterbos R.A.M., Steakley M.F., Norman C.A., Braun R., 1995, ApJ, 439, 176
- (44) Williams R.M., Chu Y.H., 1995, ApJ, 439, 132
- (45) Zimmermann H.-U., Belloni T., Boese G., et al., 1992, in Guyenne T.D., Hunt J.J. (eds), Proc. European ISY conference, ESA ISY-3, p. 231
- (46) Zimmermann H.-U. et al., 1994, EXSAS User Guide, 4th edition