Near infrared observations of quasars with extended ionized envelopes ††thanks: Based on data obtained at the European Southern Observatory, La Silla, Chile. Also based on observations made with the NASA/ESA Hubble Space Telescope, obtained from the data archive at the Space Telescope Science Institute; STScI is operated by the Association of Universities for Research in Astronomy, Inc. under NASA contract NAS 5-26555. This research has made use of the SIMBAD database, operated at CDS, Strasbourg, France and of the NASA/IPAC extragalactic database (NED), which is operated by the Jet Propulsion Laboratory, Caltech under contract with the National Aeronautics and Space Administration.
Abstract
We have observed a sample of 15 and 8 quasars with redshifts between 0.11 and 0.87 (mean value 0.38) in the J and K’ bands respectively. Eleven of the quasars were previously known to be associated with extended emission line regions. After deconvolution of the image, substraction of the PSF when possible, and identification of companions with the help of HST archive images when available, extensions are seen for at least eleven quasars. However, average profiles are different from that of the PSF in only four objects, for which a good fit is obtained with an law, suggesting that the underlying galaxies are ellipticals.
Redshifts were available in the literature for surrounding objects in five quasar fields. For these objects, one to five companion galaxies were found. One quasar even belongs to a richness class 1 cluster. Most other quasars in our sample have nearby galaxies in projection which may also be companions. Environmental effects are therefore probably important to account for the properties of these objects.
Key Words.:
galaxies: active - galaxies: fundamental parameters - galaxies: interactions - galaxies: photometry - quasars: general - infrared: galaxies1 Introduction
Attempts to understand properties of active galactic nuclei (AGN) and their cosmological evolution has led to the conclusion that the AGN activity as a whole is most likely to be described as a succession of episodic and time limited events happening in most if not all galaxies (Cavaliere & Padovani 1989, Collin-Souffrin 1991). The most plausible explanation for the onset of activity is fuelling of the nucleus by gas streaming towards the center of the galaxy as a result of interaction, accretion or merging events.
AGN surrounded by an extended emission line region are of particular interest since most often gas lying very far from the center is revealed by the ionizing flux from the active nucleus. Studying the kinematics and physical properties of this gas is a unique way towards disentangling the tight interaction between the gas motions and the nuclear activity (see e.g. the case of NGC 4388, where we have shown that the gas is certainly connected to the intracluster gas and that the source of ionization is not coincident with the optical nucleus, Petitjean & Durret 1993). In such studies, the knowledge of the host galaxy morphology is crucial since it strongly constrains the framework in which the observations should be analyzed (presence of a companion, distorsion of the disk, orientation and inclination of the galaxy).
A number of extended ionized nebulae have been detected with radii of the order of tens to hundreds of kpc from the nucleus itself (see catalogues by Durret 1989, and Heckman et al. 1991). The properties of these gaseous nebulae appear to be tightly correlated with the AGN activity, in particular with the UV and radio emission (McCarthy et al. 1987, Durret 1990), and the gas often suffers from important turbulent motions (Jorsäter et al. 1984, Bergeron et al. 1989, Heckman et al. 1991, Durret et al. 1994). Besides, the emission line widths are observed to increase with redshift (Heckman et al. 1991), implying that the properties of the gaseous nebulae evolve with redshift. For 2 the properties of the ionized gas around quasars and radio galaxies seem to be similar, as would be the case for similar objects seen from different viewing angles (Barthel 1989). However, an analysis of the IRAS data for a sample of radio quasars and radio galaxies has shown a systematic difference between the IR properties of these two types of objects (Heckman et al. 1992).
The morphologies of the host galaxies have been investigated by Hutchings (1987) through optical broad band images of radio galaxies and radio quasars; he concludes that 80% of them are interacting. However, for objects with redshifts of about 0.3, the [OIII]500.7 emission line is redshifted in the R band and can contribute most of the light. A striking example is TON 616 for which the [OIII]500.7 map (Durret et al. 1994) perfectly matches the R band image (Hutchings & McClure 1990). Near infrared imaging is not sensitive to young stellar populations, but on the contrary allows to sample mainly the old stellar population and can reveal unambiguously the structure of the underlying host. Moreover, near infrared images with a good spatial resolution in the K band are particularly well adapted to this purpose, since at these wavelengths the contributions of both dust and young ionizing stars are also minimized. The K band images will reveal the morphologies and near environments of the harboring galaxies, and allow us to connect the emitting gas morphology and kinematics (when available) with the potential of the underlying galaxy. In particular, such data should allow to study what kinds of perturbations could be invoked as the origin of the gas fuelling (presence of close companions, nonaxisymmetrical perturbations in accretion or merging events, or tidal interacting forces).
We present here observations in the J and K’ bands of a sample of eleven quasars that were known to be associated with an extended ionized nebulosity. Three other nearby quasars (indicated with an ∗ in Table 1) were included because they had extensions in their optical images which could be contaminated by ionized gas emission lines. Finally, A 0401-350A was observed serendipitously because it was in our redshift range and there was no object in our sample at this right ascension.
2 The data
| Object | Coordinates | Observing | Filter | Scalea | Exposure | Seeing | Source | Radio | |
|---|---|---|---|---|---|---|---|---|---|
| name | date | time | FWHM | redshift | (mag/ | ||||
| (minutes) | (arcsec) | arcsec2) | |||||||
| A 0401-350A | 1/2/96 | J | C | 30 | 1.20 | 0.22 | 22.0 | No | |
| PKS 0812+020 | 31/1/96 | J | C | 30 | 1.34 | 0.402 | 22.1 | Yes | |
| PKS 0812+020 | 31/1/96 | J | B | 45 | 1.03 | 21.0 | |||
| PKS 0812+020 | 31/1/96 | K’ | B | 45 | 1.00 | 19.7 | |||
| PKS 0837-120∗ | 8/5/96 | J | C | 60 | 1.49 | 0.1976 | 22.6 | Yes | |
| PKS 0837-120∗ | 9/5/96 | K’ | B | 48 | 1.03 | 20.3 | |||
| 3C 215 | 1/2/96 | J | C | 30 | 1.30 | 0.411 | 22.0 | Yes | |
| IRAS 09149-6206∗ | 1/2/96 | J | C | 3 | 0.96 | 0.057 | 20.8 | No | |
| IRAS 09149-6206∗ | 1/2/96 | K’ | B | 7 | 0.81 | 18.8 | |||
| PKS 1011-282 | 31/1/96 | J | C | 45 | 1.10 | 0.253 | 21.9 | Yes | |
| 3C 275.1 | 8/5/96 | J | C | 36 | 1.62 | 0.557 | 22.6 | Yes | |
| 3C 275.1 | 9/5/96 | K’ | B | 48 | 1.31 | 20.3 | |||
| PKS 1302-102∗ | 31/1/96 | J | C | 30 | 1.20 | 0.286 | 21.8 | Yes | |
| 3C 281 | 8/5/96 | J | C | 30 | 1.32 | 0.599 | 22.7 | Yes | |
| 3C 281 | 8/5/96 | K’ | B | 42 | 1.36 | 20.2 | |||
| 4C 20.33 | 9/5/96 | J | C | 36 | 1.52 | 0.871 | 22.6 | Yes | |
| 4C 11.50 | 9/5/96 | J | C | 30 | 1.52 | 0.436 | 22.5 | Yes | |
| 4C 11.50 | 9/5/96 | K’ | B | 42 | 1.11 | 20.1 | |||
| MRK 877 | 8/5/96 | J | C | 30 | 1.42 | 0.114 | 22.7 | No | |
| 3C 334 | 8/5/96 | J | C | 30 | 1.37 | 0.555 | 22.6 | Yes | |
| MC 1745+163 | 8/5/96 | J | C | 30 | 1.29 | 0.392 | 22.4 | Yes | |
| MC 1745+163 | 9/5/96 | K’ | B | 48 | 1.31 | 20.3 | |||
| 4C 11.72 | 8/5/96 | J | C | 42 | 1.47 | 0.323 | 22.4 | Yes | |
| 4C 11.72 | 9/5/96 | K’ | B | 36 | b | 19.9 |
a C=0.507”/pix, B=0.278”/pix
b No star in the frame
The data were obtained during two runs with the ESO 2.2m telescope with IRAC2B in 1996. The detector was a NICMOS-3 array with pixels of size 40m, a Read Out Noise of 46 e- and a Gain of 6.6 e-/ADU. We used lenses B (0.278”/pix) and C (0.507”/pix), that give field sizes of 71”x71” and 129”x129” respectively. The observing strategy for each object was the following: we first obtained a J image with lense C and if it showed any hint of an extension we changed to lense B and obtained the K’ image. Details on the observations are given in Table 1. For every target, we obtained a number of images (less than 1 minute exposure each) shifting the quasar position by about 15”-20” until the total exposure time was attained. For the flux calibration we measured the following standard stars: HD29250, HD56189, HD84503, HD105116 (first run), HD84090, HD1148951, DM597287, HD177619 and SJ9149 (second run). The data reduction and calibration was performed, following the standard procedures with the IRAF111IRAF is the Image Analysis and Reduction Facitily made available to the astronomical community by the National Optical Astronomy Observatories, which are operated by the Association of Universities for Research in Astronomy (AURA), Inc., under contract with the U.S. National Science Foundation. software and SQIID package. We used dome flat-fields by subtracting the images taken with the lamps off from those taken with the lamps on. We compute the median of object images to obtain the corresponding sky frame. Sky-subtracted images were used to obtain the final mosaics. We reach a photometric accuracy of about 10%. In column 9 of Table 1 we give the isophotal magnitude/arcsec2 corresponding to 2 of the background for the regions close to the quasar (where the S/N is the highest). Total magnitudes given in Table 2 were measured in circular apertures.
Deconvolution from the point spread function was performed using the Lucy algorithm in the stsdas.analysis.restore package. We estimated the shape of the PSF by using starlike objects in the field. Average isophotal profiles were determined using the IRAF task ellipse in the stsdas.analysis.isophote222STSDAS is distributed by the Space Telescope Institute, which is operated by AURA, Inc., under NASA contract NAS 5-26555. package. We have computed the host contribution by subtracting the PSF profile (for the images with suitable stars to compute the PSF) from that of the quasar, forcing that the resulting profile has no central hole (Aretxaga et al. 1995; Rönnback et al. 1996); the magnitudes of the host galaxies are given in Table 3. Since the deconvolution procedure does not conserve calibrated fluxes, we have deconvolved sky-subtracted non-calibrated images. This explains why the deconvolved images are given with fluxes in arbitrary units (Figs. 2, 12, 14 and 15).
Table 2 lists for every object detected in our images: (1) our order number (mentioned in the text with a # symbol); (2) and (3) abridged and coordinates; (4) and (5) and positions relative to the quasar (the quasar coordinates were taken from the Simbad database, in order to have more accurate values than those written in the image headers); (6) and (7) our J and K’ magnitude measurements (note that the spatial coverage is smaller for the higher resolution scale of the K’ images); (8) R magnitudes from published optical photometry; (9) references; (10) numbering in the corresponding reference; (11) type of the object (1=galaxy, 2=probable galaxy, 3=star) given by the reference or, when no reference was given, type assigned by us. When available, we also give the redshift in column 11 in parentheses, with the corresponding reference; (12) Yes for radio-loud, No for radio-quiet objects.
A few of the objects closest to the quasar are indicated in the various plots (Figures 1 to 16) with their corresponding numbers as given in Table 2, column 1. Whenever they are mentioned in the text we use the #number; when we mention the numbering given by other authors we just use the number.
We compare the infra-red images with optical HST images (Figures 17 to 23) from the public archive when available to verifiy in particular that the extensions that we detect are not a consequence of the presence of close companions.
3 Description of individual objects.
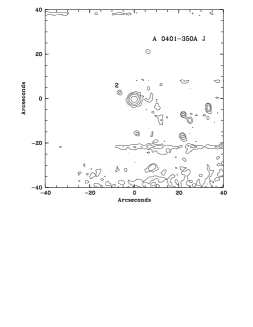
3.1 A 0401-350A (z=0.22)
Very little is known about this quasar from previous studies. We do not detect any extension even after deconvolution and PSF subtraction. Note however that the background is quite noisy, especially to the South-East (Fig. 3); this prevents a reliable determination of the PSF at faint levels, making the analysis of the presence of faint extensions very uncertain.
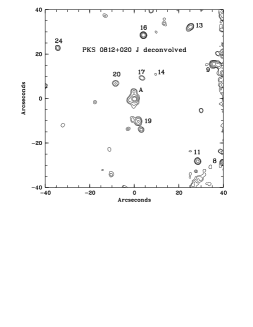
3.2 PKS 0812+020 (z=0.402)
According to Hutchings & Neff (1990), PKS 0812+020 is a one-sided lobe radio source, with a very close neighbour only 7 kpc away (in probable tidal interaction) and 16 galaxies within a distance of ”.
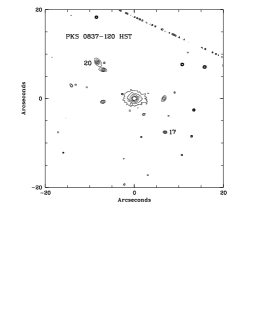
The J band image shows structures similar to what is seen in the optical by Wyckoff et al. (1981), in their search for the underlying galaxy. The radio lobe 10” to the North-West, found to be coincident with a diffuse optical emission region (Wyckoff et al. 1983), corresponds to an object (#17) of magnitude 18.8 in J and 17.7 in K’. We detect extensions to the East and South out to about 3” and 2.5” respectively from the quasar, and a very close object 3.5” to the North (object A). The deconvolved image (Fig. 3) shows that the counterpart of the radio lobe (object #17) has elliptical contours; however Ellingson et al. (1991a) have not measured its redshift.
The HST image (Fig. 19) shows that the extension seen to the east in the J band image is an independent object lying 2” from the quasar (object B). The optical counterpart of the radio lobe (#17) seems to be a spiral galaxy. The extension to the South is not visible in this image. From the HST image we can also say that objects #14, #19 and #20 are galaxies.
In Table 2, four objects taken from Ellingson et al. (1991a) are quoted with redshifts between 0.30 and 0.408. Out of these, only objects #11 and #19 are inside the field shown in Fig. 3. We do not detect galaxy 7 in Ellingson et al. (1991a), and their object 12 (z=0.4038) is unfortunately outside our field. Note that object #19 is exactly at the same redshift as the quasar.
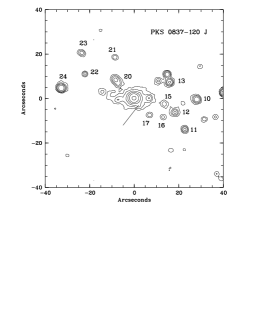
3.3 PKS 0837-120 (3C 206, z=0.1976)
This quasar is a steep spectrum, classical double radio source (Miley & Hartsuijker 1978), strongly variable at optical wavelengths (see e.g. Ellingson et al. 1989). As suggested by Wyckoff et al. (1981) and confirmed by Hutchings et al. (1988), the host galaxy of this quasar can be seen in several wavelength bands. At least three galaxies appear to be very close to the quasar in projection (Véron-Cetty & Woltjer 1990), and Ellingson et al. (1989) have confirmed spectroscopically that PKS 0837-120 is indeed located in a richness class 1 cluster of galaxies.
Our J band image (Fig. 3) shows the same structures as those seen in the optical by Véron-Cetty & Woltjer (1990), with a number of objects in the close vicinity of the radio quasar. The deconvolution of the K’ image allows to resolve the extension to the S-SW (indicated with a line on Fig. 3) as an object; the host galaxy is also visible and its derived magnitude is K’gal = 13.7.
In the HST image (Fig. 19) the closest objects are clearly resolved and appear as galaxies, in particular object #17, the object about 7” to the South-West, and those about 11” to the North-East which seem to be a close interacting pair (corresponding to object #20 in Table 2 and object 94 in Table I by Ellingson et al. 1989). The very small extension to the SE corresponds to a faint galaxy about 1.7” from the QSO center.
Redshift measurements are available for 7 of the 13 objects reported as probable galaxies in Table 2, with values between 0.0828 and 0.2677, five of them being very close to that of the quasar (Ellingson et al. 1989). Only one of them, object #10 in Table 2 (with z=0.1966), is in the field of Fig. 3. Note that in Ellingson et al. (1989) there are two additional objects close to the QSO with measured redshifts that we have not included in Table 2: for that placed 7” West of the QSO (88 in Ellingson et al. 1989, z=0.1929), we cannot measure magnitudes due to contamination by the QSO; neither do we resolve the other one, located 10” NE of the QSO (94 in Ellingson et al. 1989, z=0.1994).
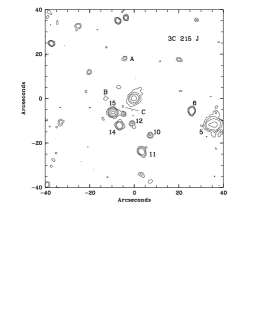
3.4 3C 215 (z=0.41)
This quasar appears to have a very complex radio structure (see e.g. Bridle et al. 1994); it is in probable tidal interaction with a companion galaxy only 28 kpc (about 6”) away and is surrounded by 14 galaxies within ” of the quasar (Hutchings & Neff 1990). Extended ionized gas has been detected along PA=190°(Crawford & Fabian 1989). The R band profile of 3C 215.0 appears somewhat more extended than the stellar profile, and consistent with an elliptical host galaxy; a companion object is present 7” South-East of the quasar, but with no measured redshift (Hutchings 1992).
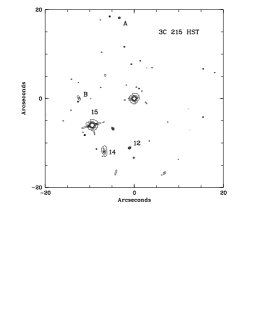
In Fig. 6 we see a faint extension to the North-West. We list 16 objects in Table 2. Note that objects #11 and #16 have the same redshift as the quasar. Three weak objects, labeled A, B and C are found to coincide well with three features in the Hutchings et al. (1998) radio map.
The HST image (Fig. 19) shows that all the objects located close to the quasar but one, that we detect in J, seem to be galaxies, object #14 having a spiral morphology (the brightest one, #15, is a star).
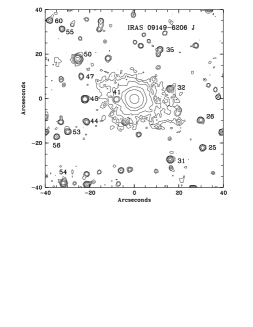
3.5 IRAS 09149-6206 (z=0.057)
The properties of the underlying galaxy have been discussed by Véron-Cetty & Woltjer (1990), who claim that a spheroidal model gives a much better fit than a disk model to their i filter imaging. The parameters of the fit in the V band are given in more detail by Véron-Cetty et al. (1991), leading to an absolute magnitude M.
In Fig. 6 we clearly see the host galaxy of this bright quasar, which extends about 40” along its major axis direction (PA62°). The average isophotal profile results to be clearly broader than that of the PSF, as shown in Fig. 24. We have deconvolved the image and subtracted the PSF to obtain a final continuous profile with no central hole (a “flat top profile with no hole in the center”, Aretxaga et al. 1995; Ronnback et al. 1996); the resulting profile follows quite well an r1/4 law; the host galaxy is therefore probably an elliptical galaxy with magnitude K’gal = 10.35. This field is very rich in objects, but no redshift is available.
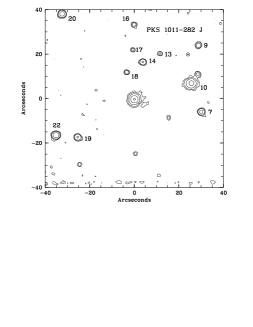
3.6 PKS 1011-282 (z=0.253)
The B and R band images of this quasar were only marginally resolved by Hutchings et al. (1984, 1988). A remarkable arc-like distribution of ionized gas was detected around this object by Stockton & MacKenty (1987), and analyzed by Boisson et al. (1994), in relation with its radio properties (Gower & Hutchings 1984). Two galaxies are located within of the quasar, but there is no visible interaction (Hutchings & Neff 1990).
The extension corresponding to the host galaxy is visible in our J image (see Fig. 6) and the deconvolution enhances this structure. However, we do not detect in J the diffuse arc-like feature observed in the [OIII] line image (about 20” North-West of the quasar), implying that this is a region of ionized gas with no underlying stellar population, as already mentioned by Boisson et al. (1994) who detected no optical counterpart.
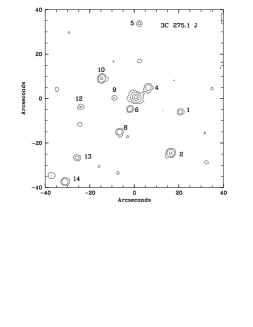
3.7 3C 275.1 (z=0.557)
Hintzen et al. (1981) have shown that this quasar could be at the center of an elliptical galaxy belonging to a galaxy cluster. Later, extended ionized gas with a complex structure and large scale motions was reported by Hintzen & Stocke (1986); the ionized gas appears to be elongated along an angle roughly perpendicular to the radio axis (e.g. Stocke et al. 1985). Hintzen & Romanishin (1986) obtained optical images in the R and redshifted narrow [OII] 372.7 bands, and found a clear extension along PA=45°; once an elliptical component has been subtracted, some small extensions remain mainly along the major axis. Redshifts from Ellingson & Yee (1994) show that the quasar has a very close companion at the same redshift (object #6 in Table 2) and that it belongs to a group of galaxies, which Kempeć-Krygier et al. (1998) have analyzed in detail from the physical and dynamical points of view; they have shown that the quasar is located at the bottom of the gravitational potential well of the group.
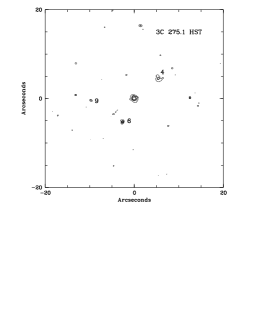
Our J band image (Fig. 9) shows the host galaxy as elliptical contours with a PA roughly consistent with that found in the optical images. There is also a small extension to the East. Deconvolution is not possible since the stars in the frame are too faint or contaminated by close objects to give an accurate estimation of the PSF. Several nearby objects are also visible in the J image, a number of these being foreground galaxies (see redshifts in Table 2).
The HST image (Fig. 22) shows that object #4 has a spiral morphology and that objects #9 and #6 are galaxies, #6 being at the same redshift as the quasar. Besides, we can note that galaxies #4 and #6 correspond to two small radio emitting features in the Hutchings et al. (1998) radio map.
Note that Akujor et al. (1994) suggest that the northern radio component may be distorted by interaction with a companion galaxy (object #4). This is unlikely since the redshift of this galaxy is notably smaller than that of the quasar.
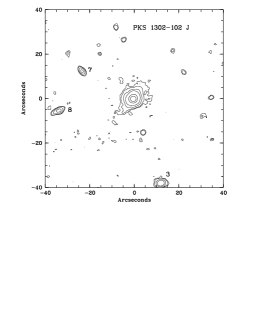
3.8 PKS 1302-102 (z=0.286)
Hutchings & Neff (1992) have detected two objects in the close vicinity of the quasar and related their presence to the merging state of the system; they also fit a profile which is a combination of an r1/4 law and an exponential law. Bahcall et al. (1995) did not detect the host galaxy in their HST image. After deconvolution with the PSF however they can see two companion galaxies located about 1” and 2” N-NW away from the quasar center (see their Figure 8). From a new HST image, Disney et al. (1995) detect the two companion objects with no need of PSF subtraction and the host galaxy is well fit with a r1/4 profile. The detection of the host galaxy from HST imaging was later confirmed by Bahcall et al. (1997), who gave values for the size and morphology of the host galaxy.
Our J band image (Fig. 9), very similar to that of McLeod & Rieke (1994b) in the H band, is well suited to trace the host galaxy; its isophotal profile is clearly different from that of the PSF (see Fig. 24) as in McLeod & Rieke (1994b), and notably more extended than that obtained by Wyckoff et al. (1981). The underlying galaxy is extended along a direction roughly perpendicular to the radio axis, as already noted by Gower & Hutchings (1984). In the deconvolved image we have subtracted the quasar by using the PSF normalized to a central value that produces no hole after subtraction. This barely allows us to detect the object 2” North of the quasar, which appears as an isophotal distorsion in the direct image, but we do not separate the quasar from the small object 1” away. The contribution of the quasar to the total light in J results to be about 60%. The resulting profile of the host galaxy can be well fit by an r1/4 law and its derived magnitude is Jgal = 14.9. These results are in agreement with McLeod & Rieke (1994b) concerning the relative contribution of the host galaxy (31% with Hgal = 14.79) although they fit an exponential. We note that the presence of the very close object 1” away does not produce any significant contamination in the average profile, which is dominated by the host galaxy.
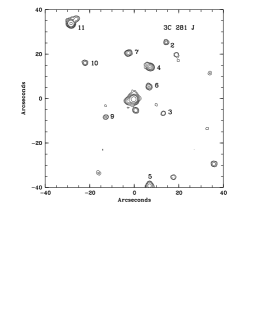
3.9 3C 281 (z=0.599)
This quasar is a double radio source (Hutchings et al. 1998) rich in extended ionized gas (Bremer et al. 1992).
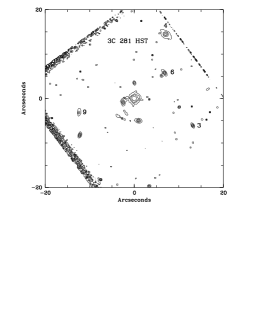
In our J band image (Fig. 9) an object 5” South of the quasar is visible, together with extensions to the North and to the East. The deconvolution enhances the Northern extension and separates the Eastern one as an object.
The HST image (Fig. 22) shows that these extensions are in fact two objects located respectively 3.5” North and 2.7” East of the quasar center. We also see that objects #6 and #9 in Table 2, which were reported as a probable galaxy and a star respectively, are both galaxies. Object 132 in Yee et al. (1986), located 5” North of #9 is also a galaxy, but is too weak to be detected in the J band image.
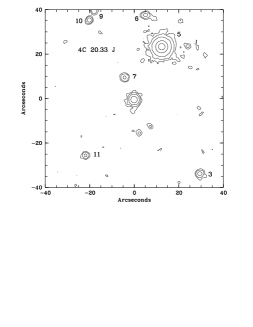
3.10 4C 20.33 (z=0.871)
This quasar is an asymmetric radio source with a collimated one-sided jet extending from the quasar to the South (Mantovani et al. 1997). Fabian et al. (1988) detected extended ionized gas around this quasar.
Isophotes are elongated towards the South in our J band image (Fig. 12), a feature which is enhanced after deconvolution. In this case, and contrary to some of the objects previously described, the elongation appears to be along a direction roughly similar to that of the radio axis (Mantovani et al. 1992). We also see a number of objets (probably galaxies) close to the quasar that could be associated with it. Redshifts are obviously needed for this field.
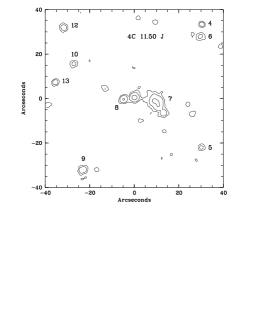
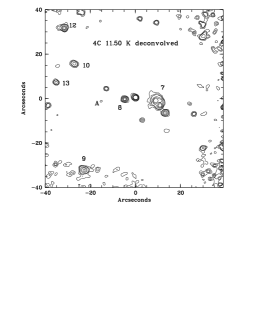
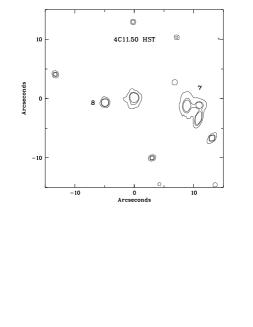
3.11 4C 11.50 (z=0.436)
The image by Stockton and MacKenty (1987) shows extended ionized gas elongated along PA 306°. A second quasar (object #8) at much higher redshift (z=1.901, Wampler et al. 1973) is located 5” to the East and a tight group of three galaxies (object #7) is associated with 4C 11.50 at an average distance of 10” West of the quasar (Stockton 1978).
We observe similar structures in our J and K’ band images (Figs. 12, 12). The quasar appears elongated along PA 47° in our deconvolved K’ image, where the three objects to the West reported by Stockton and MacKenty (1987) are clearly separated. The northernmost one is elongated to the West, due to the presence of a separate object as seen in the HST image (Fig. 22). The object detected 12” South-West of the quasar (object 142 in Yee et al. 1986) is extended in the HST image, but is too weak to be detected in J. Note that the host galaxy of the quasar appears to be detected in the HST image. A weak object labeled A appears to coincide with a faint feature in the Hutchings et al. (1998) radio map.
We give R magnitudes from the literature for the objects in the field in Table 2; note that the quasar at z=1.901 (object #8) is indicated as a star. We also give redshifts for objects #7 and #9 from Ellingson et al. (1991a); both objects result to be companion galaxies to the quasar (z=0.4323 and 0.4331 respectively).
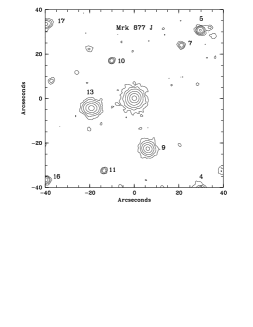
3.12 Mrk 877 (z=0.114)
Boroson et al. (1982) detected faint emission from ionized gas extended over several arcseconds from Mrk 877. The analysis of the H band image by McLeod and Rieke (1994a) results in an quasar isophotal profile which is slightly different from that of the PSF. Our J band image (Fig. 15) has been taken in poor seeing conditions (1.4 arcsec) but good spatial sampling (0.5 arcsec/pix) and shows a definite difference between the QSO and PSF profiles (see Fig. 24). The profile from our deconvolved J band image can be well fit by an law, suggesting here also that the host galaxy to this quasar is an elliptical galaxy, with an estimated magnitude Jgal=14.95. A number of objects appear in the QSO field with profiles different from the PSF and sizes comparable to the QSO host and could be possible companion galaxies.
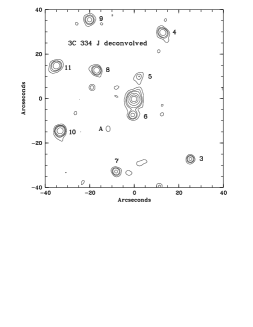
3.13 3C 334 (z=0.555)
This quasar is a triple radio source oriented NW to SE with a jet originating in the nucleus and extending towards the SE component (Hintzen et al. 1983, Swarup et al. 1984, Dennet-Thorpe et al. 1997, Hutchings et al. 1998); it has a resolved underlying galaxy (Hintzen 1984). Ionized gas was found to extend over 6” in the spectra by Crawford & Fabian (1989), and an object was detected 7” south of the quasar by Hes et al. (1996) using narrow band imaging in the [OII] 372.7 line.
Our J band image (Fig. 15) shows an extension to the North-West (to about 5” from the quasar) and two objects 10” North and 7” South respectively (objects #5 and #6 in Table 2). The latter corresponds to that detected in [OII] by Hes et al. (1996). A weak object, labeled A, coincides with a bright feature in the Hutchings et al. (1998) radio map and is also visible in the HST image (Fig. 23).
The deconvolved image allows to separate the small extension to the North-West as an object (indicated in Fig. 23 with a line). This object, as well as objects #5 and #6, are clearly separated from the quasar in the HST image, #6 probably being a galaxy. It would be very interesting to determine the redshift of these three objects and to search for any relation with the three weak Ly absorptions observed at = 0.5387, 0.5449 and 0.5491 (Jannuzi et al. 1998).
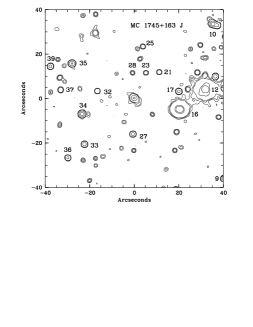
3.14 MC 1745+163 (z=0.392)
Stockton and MacKenty (1987) give an image of the ionized gas in MC 1745+163, which they claim to be resolved, with an elongation to the West along PA 90°.
Our J band image shows this extension as well; though in the direct image (Fig. 15) the major axis PA is smaller (PA =50°), it is somewhat larger (62°) in the deconvolved image. The isophotal profile is notably different from that of the PSF already in the direct image (Fig. 24). The resulting profile of the deconvolved and PSF subtracted image is well fit by an profile; the host galaxy is therefore likely to be an elliptical with K’gal = 16.19. Many objects are detected in this field; most are stellar like, except for objects #12 and #16 which look like galaxies but for which we do not have redshifts.
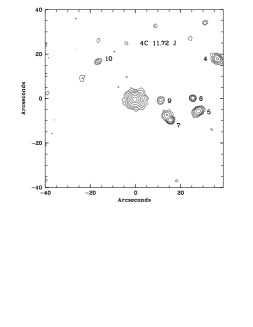
3.15 4C 11.72 = PKS 2251+113 (z=0.323)
This quasar has two companion galaxies with comparable redshifts: = 0.3287 et 0.3240 for objects #4 and #5 in Table 2 respectively (Robinson & Wampler 1972, following observations by Gunn 1971). It is embedded in an extended ionized nebulosity (Stockton & MacKenty 1987, Hutchings & Crampton 1990), where the gas appears to be very disturbed, oppositely to the host galaxy, which Hutchings & Neff (1992) classify as an “undisturbed galaxy”; from integral field spectroscopy, Durret et al. (1994) have shown that the velocity field was in fact consistent with the presence of a rotating disk, on to which are superimposed several smaller blobs possibly interacting with the main envelope.
Optical images in and by Block and Stockton (1991) show the extended nature of the residual after the QSO subtraction (see their Figure 5). Our J image is given in Fig. 16. Since we do not have in our field a suitable star to compute the PSF, we cannot proceed either with the deconvolution nor with a PSF subtraction to look for the nearest objects, labeled A and B by Block & Stockton (1991). Objects #9 and #10 in Table 2 correspond to objects 7 and 4 in Block & Stockton (1991). Object #7 corresponds to two objects, the northernmost one corresponding to object W in Gunn (1971).
Jannuzi et al. (1998) have observed this quasar spectroscopically with the HST and detected a strong C iv-O vi associated absorption line system at = 0.3256 . It would be very interesting to obtain higher spectral resolution optical data to study the kinematics and composition of the gas, in order to investigate the possibility that it is associated either with the AGN (Petitjean et al. 1994) or with a hot phase resulting from the interaction of several objects (Durret et al. 1994).
There is an additional Ly absorption line at = 0.3236. If the latter is associated with the gaseous halo of object #5 which has the same redshift, then the radius of the halo should be larger than 95 kpc for = 0. This radius is consistent with studies of the low-redshift Ly forest (e.g. Le Brun et al. 1996). However this quasar is part of a group of galaxies where the distribution of gas into individual halos is questionable. Indeed there is no H i absorption associated with object #4 which is at a projected distance of 135 kpc from the line of sight.


4 Summary and Conclusions
We have obtained near infrared imaging for a sample of fifteen QSOs, most of them selected as having extended ionized nebulosities, in order to analyze the possible connection of this gas with the underlying stellar population. We detect infrared extensions in at least eleven of them. The ionized gas extensions obtained from spectroscopic studies are within the extensions that we determine from NIR imaging. When images of the ionized gas are available, their extensions are compatible with the gas belonging to the host galaxies. The kinematical behaviour of this gas should be analyzed in order to be able to put some constraints on the possible mechanisms for the gas origin and fuelling.
We have determined the relative contribution of the host galaxies by subtracting the scaled PSF to the quasar profile. The corresponding magnitudes are given in Table 3. For the whole set of 15 objects, the resulting average contribution is 50 20 % in J (48 22 % for the twelve radio loud quasars and 58 7 % for the three radio quiet). We could extract the host galaxy for only four quasars in K’, for which the host galaxy contributed 67 8 % in average to the total luminosity. For the four hosts extracted in both J and K’, we find that their contributions are similar in both bands for IRAS 09149-6206 (radio quiet) and larger in K’ than in J for the remaining three (radio loud), in agreement with the expectation that K’ describes the stellar population better than J. The average absolute magnitudes of the host galaxies are 1.1 (1.2 for the radio loud and 0.5 for the radio quiet) and 0.6.
This is in agrement with previous results on radio loud quasars in other bands (Véron-Cetty & Woltjer 1990, Taylor et al. 1996, Bahcall et al. 1997, Hooper et al. 1997, assuming typical values VH=3.0, RH=2.5, HK=0.2 and JH=0.8). J and K’ absolute magnitudes are also compatible with those of Bright Cluster Member galaxies by Thuan & Puschell (1989) and Aragón-Salamanca et al. (1998).
Given our limited spatial resolution, we cannot always discriminate whether asymmetric extensions are intrinsic or are the consequence of the presence of objects in projection close to the line of sight to the quasar. We have attempted to answer this question first by estimating the shape of the PSF from starlike objects in the field, deconvolving the images and then subtracting the PSF of the deconvolved image to the quasar infrared profile, and second by using high resolution optical images retrieved from the HST archives, which were available for eight of the observed QSOs.
It was possible to resolve the extensions into close objects for PKS 0812+020, PKS 0837-120 and 3C 281, though for the second quasar the elongated structure seems also to be present in the HST images, suggesting that the underlying galaxy is indeed detected. In all the other cases the infrared extensions are symmetric, as expected for a normal underlying host galaxy; however, the corresponding average profiles are notably different from the PSF profiles in only four QSOs: IRAS 09149-6206, PKS 1302-102, Mrk 877 and MC 1745+163 (see Fig.24), where the harboring galaxies are well fit by the r1/4 profile describing elliptical galaxies. Out of these four quasars, note that PKS 1302-102 and MC 1745+163 are radio loud, while IRAS 09149-6206 and Mrk 877 are radio quiet.
Note that although HST images were needed to resolve close objects, they have proven to be sometimes less efficient to detect low surface brightness features, as for PKS 1302-102 (Bahcall et al. 1995, see section 3.8). For 3C 215, the HST image does not allow to trace the elongation due to the host galaxy, whereas our J image does. The present study confirms that infrared imaging is well adapted to detect underlying galaxies in quasars, after objects located close to the quasar are identified with high spatial resolution imaging (HST or adaptive optics ground based data).
One of the possibilities to explain the presence of extended gaseous envelopes around QSOs is to claim their belonging to rich environments, with the presence of close companions producing the physical mechanisms (tidal forces or nonaxisymmetrical perturbations in accretion or merger events) that can account for gas fuelling. A number of redshifts have been measured for the objects in the vicinity of five of the QSOs we have observed: PKS 0812+020, PKS 0837-120, 3C 215, 3C 275.1 and 4C 11.50. Note that out of these five quasars four are known to be rich in ionized gas, and the only one for which ionized gas has not been reported is PKS 0837-120, which belongs to a richness class 1 cluster. For all five quasars, between one and five galaxies were found to have redshifts similar to that of the quasar. The presence of such a large number of companion objects is therefore likely to imply the existence of environmental effects which could account for the existence of extended ionized nebulosities in most of these objects.
Unfortunately, we do not have redshift informations for field objects around the ten other QSOs in our sample. However, our infrared imaging shows that at least in projection most of these quasars have a number of galaxies in their environments. 3C 334 has at least one close galaxy, and some of the objects close to PKS 1011-282 and 4C 20.33 seem to be galaxies as well, while the fields around IRAS 09149-6206 and MC 1745+163 are crowded with mostly star like objets.
In order to improve such a study of the physical parameters of the underlying galaxies of quasars, and to describe their environments, high spatial resolution deeper infrared images of larger fields and with a higher sensitivity are obviously required (in particular, our limiting magnitudes together with the small frame sizes we are dealing with – less than 1’ – result in small object numbers that prevent a reliable statistical analysis of colors and number counts of companions, such as that performed by Hall & Green 1998). After the neighbouring objects are detected and galaxies are separated from stars, spectroscopy is necessary to determine which galaxies really belong to the quasar environment.
Acknowledgements.
I. Márquez acknowledges financial support from the Spanish Ministerio de Educación y Ciencia. I. M. acknowledges technical support from the IRAC team at ESO, specially Luis Ramirez. We are very grateful to Ron Probst, who made available the SQIID package for the reduction of infrared images within IRAF available to us. Finally, we thank the anonymous referee for useful comments.References
- (1) Akujor C.E., Lüdke E., Browne I.W.A. et al. 1994, A&AS 105, 247
- (2) Aretxaga I., Boyle, B.J. and Terlevich, R.J. 1995, MNRAS 275, L27
- (3) Aragón-Salamanca, A., Baugh, C.M., Kauffmann, G. 1998, MNRAS, in press, astro-ph/9801277
- (4) Bahcall J.N., Kirhakos S., Schneider D.P. 1995, ApJ 450, 486
- (5) Bahcall J.N., Kirhakos S., Saxe D.H., Schneider D.P. 1997, ApJ 479, 642
- (6) Barthel P.D. 1989, ApJ 336, 606
- (7) Bergeron J., Petitjean P., Durret F. 1989, A&A 213, 61
- (8) Block D.L., Stockton A. 1991, AJ 102, 1928
- (9) Boisson C., Durret F., Petitjean P., Bergeron J. 1994, A&A 285, 377
- (10) Boroson T.A., Oke J.B., Green R.F. 1982, ApJ 263, 32
- (11) Bremer M.N., Crawford C.S., Fabian A.C., Johnstone R.M. 1992, MNRAS 254, 614
- (12) Bridle A.H., Hough D.H., Lonsdale C.J., Burns J.O., Laing R.A. 1994, AJ 108, 766
- (13) Cavaliere A., Padovani P. 1989, ApJ 340, L5
- (14) Collin-Souffrin S. 1991, A&A 243, 5
- (15) Crawford C.S., Fabian A.C. 1989, MNRAS 239, 219
- (16) Dennet-Thorpe J., Bridle A.H., Scheuer P.A.G., Laing R.A., Leahy J.P. 1997, MNRAS 289, 753
- (17) Disney M.J., Boyce P.J., Blades J.C. 1995, Nature 376, 150
- (18) Durret F. 1989, A&AS 81, 253
- (19) Durret F. 1990, A&A 229, 351
- (20) Durret F., Pécontal E., Petitjean P., Bergeron J. 1994, A&A 291, 392
- (21) Ellingson E., Green R.F., Yee H.K.C., Kinman T.D. 1989, AJ 97, 1539
- (22) Ellingson E., Green R.F., Yee H.K.C. 1991a, ApJ 378, 476
- (23) Ellingson E., Yee H.K.C., Green R.F. 1991b, ApJS 76, 455
- (24) Ellingson E., Yee H.K.C. 1994, ApJS 92, 33
- (25) Ellingson E., Yee H.K.C., Bechtold J., Dobrzycki A. 1994, AJ 107, 1219
- (26) Fabian A.C., Crawford C.S., Johnstone R.M., Allington-Smith J.R., Hewett P.C. 1988, MNRAS 235, 13P
- (27) Gower A.C., Hutchings J.B. 1984, AJ 89, 1658
- (28) Green R.F., Yee H.K.C. 1984, ApJS 54, 495
- (29) Gunn J.E. 1971, ApJ 164, L113
- (30) Hall, P.B., Green, R.F. 1998, astro-ph/9806151
- (31) Heckman T.M., Lehnert M.D., Miley G.K., van Breugel W. 1991, ApJ 381, 373
- (32) Heckman T.M., Chambers K.C., Postman M. 1992, ApJ 391, 39
- (33) Hes R., Barthel P.D., Fosbury R.A.E. 1996, A&A 313, 423
- (34) Hintzen P., Boeshaar G.O., Scott J.S. 1981, ApJ 246, L1
- (35) Hintzen P., Ulvestad J., Owen F. 1983, AJ 88, 709
- (36) Hintzen P. 1984, ApJS 55, 533
- (37) Hintzen P., Stocke J. 1986, ApJ 308, 540
- (38) Hintzen P., Romanishin W. 1986, ApJ 311, L1
- (39) Hoope, E.J., Impey C.D., Foltz C.B. 1997, ApJ 480, L95
- (40) Hutchings J.B., Crampton D., Campbell B., Duncan D., Glendenning B. 1984, ApJS 55, 319
- (41) Hutchings J.B. 1987, ApJ 320, 122
- (42) Hutchings J.B., Johnson I., Pyke R. 1988, ApJS 66, 361
- (43) Hutchings J.B., Crampton D. 1990, AJ 99, 37
- (44) Hutchings J.B., McClure R.D. 1990, PASP 102, 48
- (45) Hutchings J.B., Neff S.G. 1990, AJ 99, 1715
- (46) Hutchings J.B., Neff S.G. 1992, AJ 104, 1
- (47) Hutchings J.B. 1992, AJ 104, 1311
- (48) Hutchings J.B., Dewey A., Chaytor D. et al. 1998, PASP 110, 111
- (49) Jannuzi B., Bahcall J.N., Bergeron J., et al. 1998, astro-ph/9805148
- (50) Jorsäter S., Lindblad P.O., Boksenberg A. 1984, A&A 140, 288
- (51) Kirhakos S., Sargent W.L.W., Schneider D.P. et al. 1994, PASP 106, 646
- (52) Krempeć-Krygier J., Krygier B., Walentinowicz G. 1998, A&A 334, 427
- (53) Le Brun V., Bergeron J., Boissé P. 1996, A&A 306, 691
- (54) Mantovani F., Junor W., Fanti R. et al. 1992, MNRAS 257, 353
- (55) Mantovani F., Junor W., Fanti R., Padrielli L., Saikia D.J. 1997, A&AS 125, 573
- (56) McCarthy P.J., van Breugel W.J.M., Spinrad H., Djorgovski S.G. 1987, ApJ 321, L29
- (57) McLeod K.K., Rieke G.H. 1994a, ApJ 420, 58
- (58) McLeod K.K., Rieke G.H. 1994b, ApJ 431, 137
- (59) Miley G.K., Hartsuijker A.P. 1978, A&AS 34, 129
- (60) Petitjean P., Durret F. 1993, A&A 277, 380
- (61) Petitjean P., Rauch M., Carswell R.F. 1994, A&A 291, 29
- (62) Robinson L.B., Wampler E.J. 1972, ApJ 171, L83
- (63) Rönnback, J., van Groningen, E., Wanders, I., Örndahl, E. 1996, MNRAS 283, 282
- (64) Stocke J.T., Burns J.O., Christiansen W.A. 1985, ApJ 299, 799
- (65) Stockton A. 1978, ApJ 223, 747
- (66) Stockton A., MacKenty J.W. 1987, ApJ 316, 584
- (67) Swarup G., Sinha R.P., Hilldrup K. 1984, MNRAS 208, 813
- (68) Taylor, G.L., Dunlop, J.S., Hughes, D.H., Robson, E.I. 1996, MNRAS 283, 930
- (69) Thuan, T.X. & Puschell, J.J. 1989, ApJ 346, 34
- (70) Véron-Cetty M.-P., Woltjer L. 1990, A&A 236, 69
- (71) Véron-Cetty M.-P., Woltjer L., Roy A.L. 1991, A&A 246, L73
- (72) Wampler E.J., Baldwin J.A., Burke W.L., Robinson L.B. 1973, Nature 246, 204
- (73) Wyckoff S., Wehinger P.A., Gehren T. 1981, ApJ 247, 750
- (74) Wyckoff S., Johnston, K., Ghigo, F., Rudnick, L., Wehinger, P., Boksenberg, A. 1983, ApJ 265, 43
- (75) Yee H.K.C., Green R.F., Stockman H.S. 1986, ApJS 62, 681
| object | (1950) | (1950) | refa | nr. | type()b | |||||
| A 0401-350A | 04 01 01.20 | -35 03 40.0 | 0.0 | 0.0 | 15.5 | QSO | ||||
| 1 | 04 00 58.48 | -35 02 38.4 | 43.0 | -16.8 | 18.7 | 3 | ||||
| 2 | 04 00 59.42 | -35 02 51.8 | 6.5 | 2.9 | 19.5 | 1 | ||||
| 3 | 04 01 00.13 | -35 02 56.3 | 65.9 | 18.7 | 16.8 | 2 | ||||
| 4 | 04 01 01.73 | -35 03 37.1 | -13.1 | 43.7 | 18.5 | 2 | ||||
| 5 | 04 01 04.70 | -35 03 56.8 | -21.9 | 48.2 | 18.4 | 3 | ||||
| 6 | 04 01 04.71 | -35 02 51.5 | 43.0 | 48.5 | 12.1 | 3 | ||||
| 7 | 04 01 06.57 | -35 03 21.3 | -33.4 | 61.6 | 11.7 | 3 | ||||
| PKS 0812+020 | 08 12 47.26 | 02 04 13.1 | 0.0 | 0.0 | 15.6 | 14.5 | 1 | QSO | ||
| 1 | 08 12 43.45 | 02 05 05.2 | -57.1 | 52.1 | 14.4 | 3 | ||||
| 2 | 08 12 43.63 | 02 03 27.8 | -54.4 | -45.3 | 14.7 | 3 | ||||
| 3 | 08 12 43.65 | 02 04 12.5 | -54.2 | -0.6 | 18.6 | 3 | ||||
| 4 | 08 12 43.80 | 02 04 44.9 | -51.8 | 31.8 | 17.5 | 19.0 | 1 | 3 | 3 | |
| 5 | 08 12 43.91 | 02 03 35.3 | -50.2 | -37.8 | 15.6 | 3 | ||||
| 6 | 08 12 44.01 | 02 04 04.4 | -48.8 | -8.7 | 17.2 | 18.5 | 1 | 4 | 1(0.3478) | |
| 7 | 08 12 44.15 | 02 04 59.7 | -46.6 | 46.6 | 16.6 | 3 | ||||
| 8 | 08 12 44.61 | 02 03 44.7 | -39.7 | -28.4 | 17.6 | 20.0 | 1 | 5 | 3 | |
| 9 | 08 12 44.89 | 02 04 28.7 | -35.6 | 15.6 | 16.3 | 3 | ||||
| 10 | 08 12 45.10 | 02 03 16.9 | -32.4 | -56.2 | 18.1 | 3 | ||||
| 11 | 08 12 45.38 | 02 03 45.1 | -28.3 | -28.0 | 17.8 | 17.3 | 20.0 | 1 | 6 | 1(0.30) |
| 12 | 08 12 45.40 | 02 03 21.9 | -28.0 | -51.2 | 18.6 | 3 | ||||
| 13 | 08 12 45.57 | 02 04 45.4 | -25.3 | 32.3 | 17.7 | 3 | ||||
| 14 | 08 12 46.65 | 02 04 24.2 | -9.1 | 11.1 | 19.0 | 18.0 | 3 | |||
| 15 | 08 12 46.98 | 02 04 58.4 | -4.2 | 45.3 | 15.2 | 3 | ||||
| 16 | 08 12 47.00 | 02 04 41.7 | -3.9 | 28.6 | 16.3 | 15.9 | 3 | |||
| 17 | 08 12 47.08 | 02 04 22.6 | -2.7 | 9.5 | 18.8 | 17.7 | 20.3 | 1 | 9 | 2 |
| 18 | 08 12 47.12 | 02 03 14.1 | -2.0 | -59.0 | 15.6 | 3 | ||||
| 19 | 08 12 47.14 | 02 04 03.0 | -1.8 | -10.1 | 17.6 | 16.6 | 20.2 | 1 | 10 | 1(0.4030) |
| 20 | 08 12 47.82 | 02 04 20.1 | 8.4 | 7.0 | 18.5 | 17.4 | 3 | |||
| 21 | 08 12 48.47 | 02 04 55.0 | 18.0 | 41.9 | 18.7 | 3 | ||||
| 22 | 08 12 48.54 | 02 05 04.7 | 19.2 | 51.6 | 17.7 | 20.0 | 1 | 12 | 1(0.4038) | |
| 23 | 08 12 48.97 | 02 05 12.6 | 25.6 | 59.5 | 17.4 | 3 | ||||
| 24 | 08 12 49.56 | 02 04 36.0 | 34.5 | 22.9 | 18.6 | 19.7 | 1 | 14 | 3 | |
| 25 | 08 12 50.04 | 02 04 19.0 | 41.6 | 5.9 | 17.7 | 16.7 | 20.2 | 1 | 15 | 1(0.3599) |
| 26 | 08 12 50.20 | 02 04 19.7 | 44.1 | 6.6 | 17.6 | 17.4 | 2 | |||
| 27 | 08 12 51.33 | 02 03 41.9 | 61.0 | -31.2 | 18.1 | 3 | ||||
| 28 | 08 12 51.63 | 02 04 17.5 | 65.5 | 4.4 | 16.8 | 3 | ||||
| PKS 0837-120 | 08 37 27.95 | -12 03 54.2 | 0.0 | 0.0 | 15.0 | 13.4 | 16.4 | 2 | 90 | QSO |
| 1 | 08 37 23.49 | -12 03 06.7 | -65.4 | 47.5 | 14.6 | 16.2 | 2 | 54 | 3 | |
| 2 | 08 37 23.59 | -12 04 21.9 | -63.9 | -27.7 | 14.9 | 16.2 | 2 | 55 | 3 | |
| 3 | 08 37 23.66 | -12 04 29.3 | -63.0 | -35.1 | 18.5 | 20.4 | 2 | 56 | 2 | |
| 4 | 08 37 24.15 | -12 04 30.1 | -55.7 | -35.9 | 19.0 | 20.4 | 2 | 59 | 3 | |
| 5 | 08 37 24.34 | -12 03 19.3 | -53.0 | 34.9 | 17.0 | 18.9 | 2 | 61 | 1(0.2677) | |
| 6 | 08 37 24.38 | -12 03 39.7 | -52.3 | 14.5 | 14.9 | 16.0 | 2 | 64 | 3 | |
| 7 | 08 37 24.65 | -12 02 00.1 | -48.3 | 54.1 | 18.8 | 20.5 | 2 | 65 | 3 | |
| 8 | 08 37 25.19 | -12 03 51.8 | -40.5 | 2.4 | 16.8 | 16.0 | 20.1 | 2 | 67 | 3 |
| 9 | 08 37 25.41 | -12 02 43.0 | -37.3 | 71.2 | 15.9 | 17.3 | 2 | 69 | 3 | |
| 10 | 08 37 26.03 | -12 03 54.8 | -28.1 | -0.6 | 17.6 | 16.5 | 19.7 | 2 | 76 | 3(0.1966) |
| 11 | 08 37 26.39 | -12 04 08.4 | -22.9 | -14.2 | 18.4 | 17.1 | 20.2 | 2 | 79 | 3 |
| 12 | 08 37 26.69 | -12 04 00.7 | -18.5 | -6.5 | 18.3 | 17.1 | 20.4 | 2 | 81 | 3 |
| 13 | 08 37 26.89 | -12 03 46.5 | -15.6 | 7.7 | 17.2 | 16.8 | 20.3 | 2 | 83 | 3 |
| 14 | 08 37 26.93 | -12 04 48.4 | -15.0 | -54.2 | 18.1 | 2 | ||||
| 15 | 08 37 27.01 | -12 03 02.7 | -13.7 | -2.6 | 19.4 | 20.8 | 2 | 85 | 3 | |
| 16 | 08 37 27.02 | -12 04 56.8 | -13.7 | -8.5 | 20.1 | 2.44 | 2 | 86 | 3 | |
| 17 | 08 37 27.47 | -12 04 01.8 | -7.1 | -7.6 | 20.1 | 17.7 | 21.6 | 2 | 89 | 1 |
| 18 | 08 37 28.08 | -12 02 54.6 | 2.7 | 60.2 | 16.3 | 17.4 | 2 | 91 | 3 | |
| 19 | 08 37 28.14 | -12 04 54.0 | 1.9 | -60.4 | 19.0 | 23.7 | 2 | 92 | 0c | |
| 20 | 08 37 28.49 | -12 03 46.2 | 8.0 | 8.0 | 17.7 | 17.1 | 20.2 | 2 | 96 | 2 |
| 21 | 08 37 28.53 | -12 03 35.8 | 8.5 | 18.4 | 19.3 | 20.2 | 2 | 95 | 3 | |
| 22 | 08 37 29.45 | -12 03 43.3 | 22.0 | 10.9 | 19.1 | 18.1 | 20.5 | 2 | 101 | 3 |
| 23 | 08 37 29.55 | -12 03 33.9 | 23.4 | 20.3 | 18.6 | 17.2 | 20.5 | 2 | 102 | 1 |
| 24 | 08 37 30.18 | -12 03 49.6 | 32.6 | 4.6 | 16.4 | 16.0 | 17.6 | 2 | 107 | 3 |
a 1: Ellingson et al. (1991a); 2: Ellingson et al. (1989); 3: Ellingson et al. (1991b); 4: Yee et al. (1986); 5: Hintzen (1984); 6: Green & Yee (1984); 7: Ellingson et al. (1994); 8: Kirhakos et al. (1994); 9: Ellingson & Yee (1994); 10: Robinson & Wampler (1972).
b Types are 1=galaxy, 2=probable galaxy, 3=star. In parentheses we give either available redshifts or other references for photometry in the form (reference, object number in that reference, z when available)
c Cosmic ray or noise event in ref. 2.
Table 2. (Cont.)
| object | (1950) | (1950) | ref | nr. | type() | |||||
| 25 | 08 37 30.96 | -12 03 14.9 | 44.1 | 39.3 | 16.1 | 17.4 | 2 | 114 | 3 | |
| 26 | 08 37 31.18 | -12 04 20.9 | 47.4 | -26.7 | 19.0 | 21.3 | 2 | 116 | 3 | |
| 27 | 08 37 31.31 | -12 04 09.3 | 49.3 | -15.1 | 14.3 | 15.3 | 2 | 117 | 3 | |
| 28 | 08 37 31.35 | -12 03 43.2 | 49.9 | 11.0 | 11.9 | 13.9 | 2 | 120 | 3 | |
| 29 | 08 37 31.35 | -12 04 48.0 | 49.9 | -53.8 | 17.8 | 2 | 118 | 2(0.1969) | ||
| 30 | 08 37 31.43 | -12 03 09.3 | 51.0 | 44.9 | 18.1 | 19.7 | 2 | 119 | 1 | |
| 31 | 08 37 31.44 | -12 05 04.0 | 51.1 | -69.8 | 17.8 | 19.6 | 2 | 122 | 1(0.1994) | |
| 32 | 08 37 31.70 | -12 03 18.0 | 54.9 | 36.2 | 16.9 | 19.7 | 2 | 125 | 3 | |
| 33 | 08 37 31.76 | -12 04 04.4 | 55.9 | -10.2 | 16.8 | 17.6 | 2 | 127 | 3 | |
| 34 | 08 37 31.81 | -12 03 31.3 | 56.5 | 22.9 | 18.1 | 20.6 | 2 | 126 | 1 | |
| 35 | 08 37 32.14 | -12 04 22.9 | 61.5 | -28.7 | 18.0 | 19.3 | 2 | 129 | 1(0.2068) | |
| 36 | 08 37 32.30 | -12 03 13.0 | 63.8 | 41.2 | 18.8 | 20.4 | 2 | 130 | 1(0.1815) | |
| 37 | 08 37 32.39 | -12 03 38.4 | 65.1 | 15.8 | 16.2 | 17.5 | 2 | 132 | 3(0.0828) | |
| 3C 215.0 | 09 03 44.16 | 16 58 15.7 | 0.0 | 0.0 | 16.5 | 18.6 | 3 | 77 | QSO (ref.5 #1) | |
| 1 | 09 03 40.11 | 16 58 38.6 | -58.0 | 22.9 | 17.6 | 19.6 | 3 | 20 | 1(ref.9 #256,0.4125) | |
| 2 | 09 03 40.32 | 16 57 15.7 | -55.1 | -59.9 | 18.5 | 20.3 | 3 | 23 | 3 | |
| 3 | 09 03 40.44 | 16 57 33.2 | -53.4 | -42.5 | 19.4 | 21.7 | 3 | 25 | 2 | |
| 4 | 09 03 41.48 | 16 57 25.4 | -38.4 | -50.3 | 18.1 | 20.9 | 3 | 38 | 1(ref.9 #289,0.4093) | |
| 5 | 09 03 41.65 | 16 58 03.9 | -36.0 | -11.8 | 16.2 | 18.4 | 3 | 42 | 1(ref.9 #300,0.2695) | |
| 6 | 09 03 42.35 | 16 58 10.0 | -26.0 | -5.6 | 17.8 | 20.1 | 3 | 50 | 1(ref.5 #17) | |
| 7 | 09 03 42.95 | 16 59 03.0 | -17.3 | 47.3 | 17.8 | 20.0 | 3 | 60 | 1(ref.9 #355,0.2682) | |
| 8 | 09 03 42.96 | 16 57 07.7 | -17.2 | -68.0 | 17.0 | 18.3 | 3 | 58 | 3 | |
| 9 | 09 03 43.32 | 16 57 26.6 | -12.1 | -49.1 | 17.2 | 19.6 | 3 | 63 | 1(ref.9 #362,0.4389) | |
| 10 | 09 03 43.64 | 16 57 59.0 | -7.5 | -16.7 | 19.1 | 21.9 | 3 | 66 | 1(ref.5 #7) | |
| 11 | 09 03 43.92 | 16 57 51.8 | -3.4 | -23.9 | 17.9 | 19.9 | 3 | 72 | 1(ref.5 #6, ref.9 #390,0.4268) | |
| 12 | 09 03 44.21 | 16 58 04.4 | 0.8 | -11.3 | 19.3 | 21.3 | 3 | 78 | 3(ref.5 #5) | |
| 13 | 09 03 44.42 | 16 57 10.7 | 3.7 | -65.0 | 17.1 | 19.5 | 3 | 80 | 1(ref.9 #407, 0.2318) | |
| 14 | 09 03 44.62 | 16 58 03.6 | 6.5 | -12.1 | 18.0 | 20.1 | 3 | 85 | 1(ref.5 #4, ref.9 #422,0.4106) | |
| 15 | 09 03 44.81 | 16 58 09.4 | 9.4 | -6.3 | 16.0 | 17.3 | 3 | 91 | 3(ref.5 #2) | |
| 16 | 09 03 45.33 | 16 57 15.7 | 16.8 | -60.0 | 18.9 | 20.9 | 3 | 97 | 3 | |
| A | 09 03 44.47 | 16 58 33.9 | 4.5 | 18.2 | 20.5 | 22.7 | 3 | 83 | 3(ref.5 #13) | |
| B | 09 03 45.04 | 16 58 15.6 | 12.6 | -0.1 | 20.8 | 22.5 | 3 | 94 | 1(ref.5 #11) | |
| C | 09 03 44.54 | 16 58 12.6 | 5.5 | -3.1 | 22.3 | ? | ||||
| IRAS 09149-6206 | 09 14 59.10 | -62 06 54.0 | 0.0 | 0.0 | 11.6 | 9.8 | QSO | |||
| 1 | 09 14 45.85 | -62 06 54.2 | -92.9 | -0.2 | 14.6 | 2 | ||||
| 2 | 09 14 46.80 | -62 06 48.4 | -86.3 | 5.6 | 15.3 | 3 | ||||
| 3 | 09 14 46.92 | -62 05 38.3 | -85.5 | 75.7 | 15.7 | 3 | ||||
| 4 | 09 14 47.51 | -62 07 24.8 | -81.3 | -30.7 | 11.6 | 2 | ||||
| 5 | 09 14 48.21 | -62 08 15.1 | -76.3 | -81.1 | 16.0 | 3 | ||||
| 6 | 09 14 48.76 | -62 07 03.7 | -72.5 | -9.7 | 11.8 | 2 | ||||
| 7 | 09 14 49.54 | -62 07 24.2 | -67.1 | -30.2 | 15.3 | 3 | ||||
| 8 | 09 14 49.70 | -62 06 06.3 | -66.0 | 47.7 | 14.8 | 3 | ||||
| 9 | 09 14 49.71 | -62 07 31.9 | -65.9 | -37.9 | 15.4 | 3 | ||||
| 10 | 09 14 49.79 | -62 07 39.0 | -65.3 | -45.0 | 16.4 | 3 | ||||
| 11 | 09 14 49.80 | -62 07 58.9 | -65.2 | -64.9 | 17.2 | 3 | ||||
| 12 | 09 14 50.69 | -62 08 02.9 | -59.0 | -68.9 | 16.2 | 3 | ||||
| 13 | 09 14 50.82 | -62 06 22.4 | -58.1 | 31.6 | 15.4 | 3 | ||||
| 14 | 09 14 52.99 | -62 05 49.9 | -42.9 | 64.1 | 15.1 | 3 | ||||
| 15 | 09 14 53.24 | -62 05 32.3 | -41.2 | 81.7 | 16.5 | 3 | ||||
| 16 | 09 14 53.25 | -62 07 48.8 | -41.0 | -54.8 | 11.8 | 3 | ||||
| 17 | 09 14 53.33 | -62 06 05.6 | -40.5 | 48.4 | 17.0 | 3 | ||||
| 18 | 09 14 53.61 | -62 05 25.8 | -38.5 | 88.2 | 16.3 | 3 | ||||
| 19 | 09 14 53.97 | -62 08 10.7 | -36.0 | -76.7 | 14.5 | 3 | ||||
| 20 | 09 14 54.26 | -62 05 25.8 | -34.0 | 88.2 | 15.9 | 3 | ||||
| 21 | 09 14 54.33 | -62 06 12.6 | -33.5 | 41.4 | 15.1 | 14.9 | 3 | |||
| 22 | 09 14 54.36 | -62 07 52.4 | -33.2 | -58.4 | 12.4 | 2 | ||||
| 23 | 09 14 54.46 | -62 05 30.8 | -32.6 | 83.2 | 17.5 | 3 | ||||
| 24 | 09 14 54.66 | -62 06 07.5 | -31.1 | 46.6 | 16.9 | 3 | ||||
| 25 | 09 14 54.74 | -62 07 15.9 | -30.6 | -21.9 | 16.9 | 3 | ||||
| 26 | 09 14 54.86 | -62 07 03.5 | -29.8 | -9.4 | 17.4 | 16.7 | 3 | |||
| 27 | 09 14 55.35 | -62 07 34.3 | -26.3 | -40.3 | 16.6 | 3 | ||||
| 28 | 09 14 55.58 | -62 06 03.6 | -24.7 | 50.4 | 17.2 | 3 | ||||
| 29 | 09 14 56.23 | -62 08 08.3 | -20.1 | -74.3 | 16.1 | 3 | ||||
| 30 | 09 14 56.77 | -62 07 36.3 | -16.3 | -42.3 | 17.5 | 3 | ||||
| 31 | 09 14 56.81 | -62 07 21.2 | -16.0 | -27.2 | 16.8 | 15.4 | 3 | |||
| 32 | 09 14 56.82 | -62 06 49.4 | -16.0 | 4.6 | 17.0 | 16.7 | 3 | |||
| 33 | 09 14 56.83 | -62 05 46.2 | -15.9 | 67.9 | 17.0 | 3 | ||||
| 34 | 09 14 57.19 | -62 07 51.4 | -13.4 | -57.4 | 15.7 | 3 |
Table 2. (Cont.)
| object | (1950) | (1950) | ref | nr. | type() | |||||
| 35 | 09 14 57.50 | -62 06 31.8 | -11.3 | 22.2 | 17.4 | 3 | ||||
| 36 | 09 14 57.62 | -62 05 42.7 | -10.4 | 71.3 | 15.7 | 3 | ||||
| 37 | 09 14 58.16 | -62 07 44.9 | -6.6 | -50.9 | 17.3 | 3 | ||||
| 38 | 09 14 58.38 | -62 05 26.5 | -5.0 | 87.5 | 13.9 | 3 | ||||
| 39 | 09 14 58.95 | -62 07 54.1 | -1.1 | -60.1 | 16.9 | 3 | ||||
| 40 | 09 14 59.10 | -62 05 49.5 | 0.0 | 64.5 | 17.3 | 3 | ||||
| 41 | 09 15 00.25 | -62 06 54.2 | 8.1 | -0.2 | 16.1 | 16.3 | 3 | |||
| 42 | 09 15 00.76 | -62 07 37.7 | 11.6 | -43.7 | 16.9 | 3 | ||||
| 43 | 09 15 01.80 | -62 07 42.5 | 18.9 | -48.5 | 16.7 | 3 | ||||
| 44 | 09 15 02.16 | -62 07 04.2 | 21.5 | -10.2 | 17.5 | 16.8 | 3 | |||
| 45 | 09 15 02.27 | -62 06 54.1 | 22.2 | -0.1 | 16.0 | 16.2 | 3 | |||
| 46 | 09 15 02.39 | -62 06 01.3 | 23.1 | 52.7 | 17.2 | 3 | ||||
| 47 | 09 15 02.51 | -62 06 43.7 | 23.9 | 10.3 | 18.1 | 3 | ||||
| 48 | 09 15 02.51 | -62 07 49.0 | 23.9 | -55.0 | 18.2 | 3 | ||||
| 49 | 09 15 02.66 | -62 07 44.4 | 25.0 | -50.4 | 17.2 | 3 | ||||
| 50 | 09 15 02.74 | -62 06 35.9 | 25.5 | 18.1 | 14.9 | 14.7 | 3 | |||
| 51 | 09 15 02.79 | -62 05 51.9 | 25.9 | 62.1 | 17.0 | 3 | ||||
| 52 | 09 15 03.26 | -62 05 45.7 | 29.2 | 68.3 | 14.8 | 3 | ||||
| 53 | 09 15 03.38 | -62 07 08.7 | 30.0 | -14.7 | 17.4 | 16.6 | 3 | |||
| 54 | 09 15 03.65 | -62 07 31.8 | 31.9 | -37.8 | 16.5 | 3 | ||||
| 55 | 09 15 03.74 | -62 06 22.5 | 32.6 | 31.5 | 17.8 | 17.2 | 3 | |||
| 56 | 09 15 04.09 | -62 07 11.0 | 35.0 | -17.0 | 17.7 | 3 | ||||
| 57 | 09 15 04.14 | -62 07 48.8 | 35.4 | -54.8 | 15.9 | 3 | ||||
| 58 | 09 15 04.43 | -62 05 47.6 | 37.4 | 66.4 | 17.2 | 3 | ||||
| 59 | 09 15 04.48 | -62 06 03.3 | 37.8 | 50.7 | 17.4 | 3 | ||||
| 60 | 09 15 04.54 | -62 06 18.6 | 38.2 | 35.4 | 17.8 | 3 | ||||
| 61 | 09 15 04.81 | -62 07 08.9 | 40.0 | -14.8 | 17.6 | 3 | ||||
| 62 | 09 15 05.02 | -62 06 02.7 | 41.5 | 51.3 | 16.9 | 3 | ||||
| 63 | 09 15 05.11 | -62 06 37.3 | 42.2 | 16.7 | 15.5 | 15.1 | 3 | |||
| 64 | 09 15 05.49 | -62 07 20.5 | 44.8 | -26.5 | 16.1 | 15.6 | 3 | |||
| 65 | 09 15 05.80 | -62 08 04.3 | 47.0 | -70.3 | 16.0 | 3 | ||||
| 66 | 09 15 05.81 | -62 06 47.0 | 47.0 | 7.0 | 13.8 | 13.3 | 2 | |||
| 67 | 09 15 06.03 | -62 07 22.2 | 48.6 | -28.2 | 15.8 | 3 | ||||
| 68 | 09 15 06.65 | -62 05 42.4 | 53.0 | 71.6 | 17.4 | 3 | ||||
| 69 | 09 15 06.86 | -62 05 52.2 | 54.4 | 61.8 | 15.4 | 2 | ||||
| 70 | 09 15 06.99 | -62 05 37.5 | 55.4 | 76.5 | 16.8 | 3 | ||||
| 71 | 09 15 07.16 | -62 06 29.6 | 56.6 | 24.4 | 13.8 | 2 | ||||
| 72 | 09 15 07.56 | -62 06 06.8 | 59.4 | 47.2 | 15.7 | 3 | ||||
| 73 | 09 15 08.02 | -62 06 40.9 | 62.6 | 13.1 | 17.0 | 3 | ||||
| 74 | 09 15 08.35 | -62 06 54.2 | 64.9 | -0.2 | 17.0 | 3 | ||||
| 75 | 09 15 08.44 | -62 07 21.3 | 65.5 | -27.3 | 13.6 | 1 | ||||
| 76 | 09 15 08.71 | -62 07 48.5 | 67.4 | -54.5 | 16.0 | 3 | ||||
| 77 | 09 15 09.12 | -62 07 03.5 | 70.2 | -9.5 | 15.7 | 3 | ||||
| 78 | 09 15 09.19 | -62 07 24.2 | 70.8 | -30.2 | 14.4 | 2 | ||||
| 79 | 09 15 09.28 | -62 05 20.8 | 71.5 | 93.2 | 13.4 | 2 | ||||
| PKS 1011-282 | 10 11 12.20 | -28 16 31.9 | 0.0 | 0.0 | 15.2 | QSO | ||||
| 1 | 10 11 03.95 | -28 15 35.4 | -109.0 | 56.5 | 15.8 | 3 | ||||
| 2 | 10 11 05.01 | -28 16 07.3 | -95.0 | 24.6 | 18.1 | 3 | ||||
| 3 | 10 11 07.99 | -28 16 02.3 | -55.6 | 29.6 | 18.8 | 3 | ||||
| 4 | 10 11 08.50 | -28 15 25.4 | -48.8 | 66.5 | 18.2 | 3 | ||||
| 5 | 10 11 08.54 | -28 16 19.7 | -48.4 | 12.2 | 16.8 | 3 | ||||
| 6 | 10 11 09.31 | -28 17 54.3 | -38.1 | -82.4 | 18.2 | 3 | ||||
| 7 | 10 11 09.93 | -28 16 37.5 | -30.0 | -5.6 | 17.4 | 3 | ||||
| 8 | 10 11 09.96 | -28 15 43.0 | -29.6 | 48.9 | 16.1 | 3 | ||||
| 9 | 10 11 10.02 | -28 16 07.6 | -28.8 | 24.3 | 18.8 | 2 | ||||
| 10 | 10 11 10.26 | -28 16 24.6 | -25.6 | 7.3 | 16.4 | 1 | ||||
| 11 | 10 11 10.98 | -28 17 52.2 | -16.1 | -80.3 | 18.1 | 3 | ||||
| 12 | 10 11 11.24 | -28 15 47.8 | -12.6 | 44.1 | 19.0 | 3 | ||||
| 13 | 10 11 11.33 | -28 16 11.4 | -11.5 | 20.5 | 19.5 | 3 | ||||
| 14 | 10 11 11.91 | -28 16 15.1 | -3.9 | 16.8 | 17.8 | 3 | ||||
| 15 | 10 11 12.21 | -28 15 58.2 | 0.2 | 46.1 | 19.1 | 3 | ||||
| 16 | 10 11 12.22 | -28 15 45.8 | 0.2 | 33.7 | 19.0 | 3 | ||||
| 17 | 10 11 12.25 | -28 16 09.7 | 0.7 | 22.2 | 19.6 | 3 | ||||
| 18 | 10 11 12.46 | -28 16 19.7 | 3.5 | 12.2 | 19.2 | 3 | ||||
| 19 | 10 11 14.12 | -28 16 48.9 | 25.4 | -17.0 | 17.6 | 2 | ||||
| 20 | 10 11 14.65 | -28 15 53.4 | 32.4 | 38.5 | 16.8 | 2 | ||||
| 21 | 10 11 14.67 | -28 17 25.6 | 32.7 | -53.7 | 18.5 | 3 |
Table 2. (Cont.)
| object | (1950) | (1950) | ref | nr. | type() | |||||
| 22 | 10 11 14.87 | -28 16 48.1 | 35.2 | -16.2 | 16.3 | 3 | ||||
| 23 | 10 11 15.19 | -28 15 24.8 | 39.5 | 67.1 | 17.0 | 3 | ||||
| 24 | 10 11 16.38 | -28 16 40.5 | 55.2 | -8.6 | 17.9 | 3 | ||||
| 3C 275.1 | 12 41 27.58 | 16 39 18.0 | 0.0 | 0.0 | 17.0 | 15.7 | 18.3 | 3 | 32 | QSO |
| 1 | 12 41 26.18 | 16 39 11.4 | -20.1 | -6.6 | 19.1 | 18.1 | 21.8 | 3 | 21 | 1 |
| 2 | 12 41 26.49 | 16 38 52.9 | -15.6 | -25.1 | 18.2 | 16.9 | 20.3 | 3 | 24 | 1(ref.9 #333,0.4646) |
| 3 | 12 41 26.54 | 16 40 09.5 | -14.9 | 51.5 | 18.6 | 20.2 | 3 | 25 | 1(ref.9 #342,0.4664) | |
| 4 | 12 41 27.19 | 16 39 22.4 | -5.6 | 4.4 | 18.7 | 18.2 | 20.2 | 3 | 26 | 1(ref.9 #354,0.3374) |
| 5 | 12 41 27.46 | 16 39 51.2 | -1.7 | 33.2 | 19.5 | 21.4 | 3 | 28 | 1 | |
| 6 | 12 41 27.76 | 16 39 13.3 | 2.7 | -4.7 | 19.2 | 17.8 | 19.8 | 3 | 34 | 2(ref.9 #381,0.5570) |
| 7 | 12 41 27.94 | 16 40 10.6 | 5.2 | 52.6 | 14.7 | 15.8 | 3 | 35 | 3 | |
| 8 | 12 41 28.08 | 16 39 02.4 | 7.2 | -15.6 | 18.9 | 17.9 | 23.1 | 3 | 37 | 1(ref.9 #393,0.1680) |
| 9 | 12 41 28.25 | 16 39 17.6 | 9.7 | -0.4 | 20.5 | 18.2 | 19.8 | 3 | 41 | 3 |
| 10 | 12 41 28.64 | 16 39 26.4 | 15.3 | 8.4 | 18.1 | 17.1 | 21.9 | 3 | 42 | 1(ref.9 #425,0.1987) |
| 11 | 12 41 29.08 | 16 40 06.0 | 21.6 | 48.0 | 16.5 | 18.2 | 3 | 48 | 1 | |
| 12 | 12 41 29.30 | 16 39 13.7 | 24.7 | -4.3 | 19.8 | 18.2 | 21.2 | 3 | 49 | 1 |
| 13 | 12 41 29.41 | 16 38 50.9 | 26.3 | -27.1 | 19.2 | 21.0 | 3 | 52 | 1(ref.9 #457,0.4936) | |
| 14 | 12 41 29.80 | 16 38 40.1 | 31.9 | -37.9 | 18.5 | 20.5 | 3 | 56 | 1(ref.9 #472,0.2566) | |
| 15 | 12 41 31.70 | 16 39 53.2 | 59.3 | 35.2 | 18.7 | 20.7 | 3 | 67 | 1(ref.9 #541,0.4924) | |
| PKS 1302-102 | 13 02 55.85 | -10 17 16.4 | 0.0 | 0.0 | 13.9 | 15.1 | QSO | |||
| 1 | 13 02 51.50 | -10 17 41.6 | -64.2 | -25.2 | 14.0 | 15.2 | 6 | 17 | 3 | |
| 2 | 13 02 51.65 | -10 17 20.5 | -61.9 | -4.1 | 14.2 | 15.4 | 6 | 19 | 3 | |
| 3 | 13 02 55.01 | -10 17 54.4 | -12.3 | -38.0 | 17.2 | 19.0 | 6 | 13 | 1 | |
| 4 | 13 02 55.32 | -10 18 10.6 | -7.8 | -54.2 | 18.8 | 3 | ||||
| 5 | 13 02 55.97 | -10 16 05.3 | 1.8 | 71.1 | 18.0 | 20.23 | 6 | 1 | 3 | |
| 6 | 13 02 56.38 | -10 15 38.8 | 7.8 | 97.6 | 12.1 | 3 | ||||
| 7 | 13 02 57.41 | -10 17 03.9 | 23.1 | 12.5 | 18.2 | 20.4 | 6 | 5 | 1 | |
| 8 | 13 02 58.11 | -10 17 21.8 | 33.4 | -5.4 | 17.9 | 19.5 | 6 | 8 | 1 | |
| 9 | 13 03 00.33 | -10 16 37.4 | 66.1 | 39.0 | 18.0 | 19.5 | 6 | 4 | 3 | |
| 10 | 13 03 00.77 | -10 16 43.7 | 72.7 | 32.7 | 18.5 | 21.4 | 6 | 6 | 3 | |
| 11 | 13 03 01.33 | -10 16 52.5 | 80.9 | -40.7 | 11.1 | 14.5 | 6 | 9 | 3 | |
| 12 | 13 03 01.33 | -10 17 57.1 | 80.9 | 23.9 | 17.9 | 2 | ||||
| 3C 281 | 13 05 22.54 | 06 58 14.4 | 0.0 | 0.0 | 16.5 | 15.5 | 17.5 | 4 | 127 | QSO |
| 1 | 13 05 21.19 | 06 59 04.2 | -20.2 | 49.8 | 19.0 | 21.7 | 4 | 116 | 1 | |
| 2 | 13 05 21.57 | 06 58 40.1 | -14.5 | 25.7 | 19.6 | 22.1 | 4 | 119 | 1 | |
| 3 | 13 05 21.67 | 06 58 08.0 | -13.0 | -6.4 | 20.0 | 21.3 | 4 | 120 | 1 | |
| 4 | 13 05 22.05 | 06 58 29.0 | -7.3 | 14.6 | 18.3 | 17.2 | 21.0 | 4 | 122 | 1 (ref.6 #17) |
| 5 | 13 05 22.06 | 06 57 35.3 | -7.1 | -39.1 | 18.7 | 21.8 | 4 | 124 | 2 | |
| 6 | 13 05 22.08 | 06 58 20.1 | -6.9 | 5.7 | 19.2 | 18.3 | 21.1 | 4 | 123 | 2 |
| 7 | 13 05 22.70 | 06 58 35.2 | 2.3 | 20.8 | 18.9 | 17.8 | 21.6 | 4 | 128 | 2 (ref.6 #1) |
| 8 | 13 05 23.27 | 06 57 21.3 | 10.8 | -53.1 | 19.0 | 3 | ||||
| 9 | 13 05 23.39 | 06 58 06.4 | 12.6 | -8.0 | 19.7 | 18.4 | 22.2 | 4 | 131 | 3 |
| 10 | 13 05 24.01 | 06 58 30.9 | 21.9 | 16.5 | 19.4 | 18.5 | 22.1 | 4 | 135 | 1 |
| 11 | 13 05 24.43 | 06 58 48.5 | 28.1 | 34.1 | 17.3 | 17.0 | 18.4 | 4 | 138 | 3 (ref.6 #2) |
| 12 | 13 05 24.99 | 06 59 06.5 | 36.5 | 52.1 | 18.5 | 1 | ||||
| 13 | 13 05 25.31 | 06 58 08.1 | 41.2 | -6.3 | 18.6 | 17.8 | 21.3 | 4 | 139 | 3 (ref.6 #4) |
| 14 | 13 05 25.32 | 06 58 02.4 | 41.4 | -12.0 | 19.4 | 17.7 | 22.0 | 4 | 140 | 1 |
| 4C 20.33 | 14 22 37.56 | 20 13 57.4 | 0.0 | 0.0 | 16.0 | QSO | ||||
| 1 | 14 22 33.10 | 20 13 08.6 | -62.8 | -48.8 | 16.6 | 3 | ||||
| 2 | 14 22 33.28 | 20 14 30.3 | -60.3 | 32.9 | 18.1 | 2 | ||||
| 3 | 14 22 35.46 | 20 13 24.1 | -29.5 | -33.3 | 18.7 | 2 | ||||
| 4 | 14 22 36.66 | 20 13 15.9 | -12.6 | -41.5 | 20.1 | 3 | ||||
| 5 | 14 22 36.67 | 20 14 21.2 | -12.5 | 23.8 | 13.5 | 2 | ||||
| 6 | 14 22 37.19 | 20 14 35.4 | -5.2 | 38.0 | 18.8 | 2 | ||||
| 7 | 14 22 37.86 | 20 14 07.4 | 4.2 | 10.0 | 19.4 | 2 | ||||
| 8 | 14 22 38.18 | 20 14 56.6 | 8.8 | 59.2 | 16.8 | 3 | ||||
| 9 | 14 22 38.84 | 20 14 37.4 | 18.0 | 40.0 | 18.5 | 1 | ||||
| 10 | 14 22 38.99 | 20 14 33.2 | 20.1 | 35.8 | 18.5 | 2 | ||||
| 11 | 14 22 39.11 | 20 13 32.2 | 21.8 | -25.2 | 19.5 | 2 | ||||
| 12 | 14 22 39.97 | 20 13 12.4 | 34.0 | -45.0 | 18.2 | 1 | ||||
| 13 | 14 22 41.15 | 20 14 05.4 | 50.6 | 8.0 | 18.5 | 3 | ||||
| 14 | 14 22 41.30 | 20 13 16.2 | 52.6 | -41.2 | 18.0 | 3 | ||||
| 15 | 14 22 41.30 | 20 14 20.8 | 52.6 | 23.4 | 19.8 | 2 | ||||
| 16 | 14 22 41.66 | 20 13 12.4 | 57.7 | -45.0 | 18.0 | 1 | ||||
| 17 | 14 22 41.93 | 20 14 14.8 | 61.5 | 17.4 | 15.1 | 3 |
Table 2. (Cont.)
| object | (1950) | (1950) | ref | nr. | type() | |||||
| 18 | 14 22 41.96 | 20 15 04.4 | 61.9 | 67.0 | 16.6 | 3 | ||||
| 19 | 14 22 42.44 | 20 14 43.7 | 68.7 | 46.3 | 16.9 | 3 | ||||
| 20 | 14 22 42.57 | 20 13 37.3 | 70.4 | -20.1 | 17.6 | 3 | ||||
| 4C 11.50 | 15 48 21.20 | 11 29 47.0 | 0.0 | 0.0 | 17.4 | 15.7 | 17.9 | 4 | 138 | QSO |
| 1 | 15 48 16.96 | 11 29 38.1 | -62.3 | -8.9 | 17.2 | 19.1 | 4 | 103 | 1 | |
| 2 | 15 48 17.07 | 11 29 59.2 | -60.7 | 12.2 | 18.8 | 21.0 | 4 | 104 | 1 | |
| 3 | 15 48 17.45 | 11 29 42.8 | -55.1 | -4.2 | 17.3 | 19.6 | 4 | 106 | 1 | |
| 4 | 15 48 19.14 | 11 30 19.9 | -30.3 | 32.9 | 19.4 | 21.9 | 4 | 118 | 3 | |
| 5 | 15 48 19.16 | 11 29 24.5 | -29.9 | -22.5 | 19.2 | 22.6 | 4 | 120 | 1 | |
| 6 | 15 48 19.19 | 11 30 14.4 | -29.6 | 27.4 | 19.2 | 20.2 | 4 | 121 | 1 | |
| 7 | 15 48 20.53 | 11 29 45.1 | -9.9 | -1.9 | 16.9 | 16.5 | 19.7 | 4 | 138 | 1(ref.1 #3, 0.4323) |
| 8 | 15 48 21.53 | 11 29 46.2 | 4.9 | -0.8 | 18.1 | 17.4 | 18.8 | 4 | 147 | 3 |
| 9 | 15 48 22.78 | 11 29 14.5 | 23.3 | -32.5 | 18.5 | 17.2 | 20.3 | 4 | 154 | 1(ref.1 #4, 0.4331) |
| 10 | 15 48 23.06 | 11 30 02.1 | 27.3 | 15.1 | 19.3 | 21.1 | 4 | 155 | 1 | |
| 11 | 15 48 23.26 | 11 28 55.1 | 30.3 | -51.9 | 17.8 | 3 | ||||
| 12 | 15 48 23.37 | 11 30 18.6 | 31.9 | 31.6 | 18.6 | 17.1 | 21.1 | 4 | 157 | 1 |
| 13 | 15 48 23.61 | 11 29 53.9 | 35.5 | 6.9 | 19.0 | 21.4 | 4 | 160 | 3 | |
| 14 | 15 48 24.88 | 11 30 11.3 | 54.1 | 24.3 | 18.4 | 19.7 | 4 | 166 | 3 | |
| A | 15 48 22.25 | 11 29 45.2 | 15.5 | -1.8 | 19.9 | – | 4 | 149 | 2 | |
| Mrk 877 | 16 17 56.60 | 17 31 35.0 | 0.0 | 0.0 | 14.2 | QSO | ||||
| 1 | 16 17 51.81 | 17 31 48.7 | -68.5 | 13.7 | 17.1 | 3 | ||||
| 2 | 16 17 54.17 | 17 30 42.5 | -34.7 | -52.5 | 18.7 | 2 | ||||
| 3 | 16 17 54.26 | 17 32 30.2 | -33.5 | 55.2 | 19.1 | 3 | ||||
| 4 | 16 17 54.51 | 17 30 53.5 | -29.9 | -41.5 | 17.7 | 1 | ||||
| 5 | 16 17 54.52 | 17 32 05.6 | -29.6 | 30.6 | 17.2 | 3 | ||||
| 6 | 16 17 54.76 | 17 32 39.9 | -26.3 | 65.0 | 16.4 | 3 | ||||
| 7 | 16 17 55.12 | 17 31 58.9 | -21.1 | 23.9 | 19.2 | 3 | ||||
| 8 | 16 17 56.01 | 17 30 36.2 | -8.3 | -58.8 | 17.6 | 3 | ||||
| 9 | 16 17 56.17 | 17 31 12.3 | -6.0 | -22.7 | 16.3 | 1 | ||||
| 10 | 16 17 57.31 | 17 31 52.0 | 10.2 | 17.0 | 19.2 | 3 | ||||
| 11 | 16 17 57.55 | 17 31 02.4 | 13.5 | -32.6 | 19.2 | 3 | ||||
| 12 | 16 17 57.79 | 17 30 51.2 | 17.0 | -43.8 | 17.3 | 2 | ||||
| 13 | 16 17 57.94 | 17 31 30.5 | 19.3 | -4.5 | 15.8 | 1 | ||||
| 14 | 16 17 58.19 | 17 30 37.5 | 22.8 | -57.5 | 15.1 | 3 | ||||
| 15 | 16 17 58.27 | 17 32 17.3 | 23.8 | 42.3 | 19.8 | 3 | ||||
| 16 | 16 17 59.37 | 17 30 58.2 | 39.7 | -36.8 | 17.9 | 3 | ||||
| 17 | 16 17 59.39 | 17 32 08.3 | 39.8 | 33.3 | 17.6 | 1 | ||||
| 18 | 16 17 59.62 | 17 32 00.1 | 43.2 | 25.1 | 18.5 | 3 | ||||
| 19 | 16 17 59.89 | 17 32 11.1 | 47.1 | 36.1 | 18.4 | 2 | ||||
| 20 | 16 17 59.95 | 17 30 55.3 | 48.0 | -39.7 | 16.9 | 3 | ||||
| 21 | 16 18 00.41 | 17 31 32.7 | 54.5 | -2.3 | 18.8 | 3 | ||||
| 22 | 16 18 02.28 | 17 31 19.6 | 81.2 | -15.4 | 18.0 | 3 | ||||
| 3C 334.0 | 16 18 07.40 | 17 43 30.5 | 0.0 | 0.0 | 15.7 | 17.4 | 4 | 128 | QSO(ref.5 #1) | |
| 1 | 16 18 03.83 | 17 43 23.4 | -51.1 | -7.1 | 20.0 | 20.9 | 4 | 108 | 3 (ref.6 #13) | |
| 2 | 16 18 04.75 | 17 44 21.1 | -37.8 | 50.6 | 15.9 | 3 | ||||
| 3 | 16 18 05.62 | 17 43 03.5 | -25.4 | -27.0 | 19.1 | 21.5 | 4 | 114 | 3 (ref.5 #9) | |
| 4 | 16 18 06.50 | 17 44 00.5 | -12.9 | 30.0 | 18.7 | 21.1 | 4 | 118 | 1 | |
| 5 | 16 18 07.23 | 17 43 40.3 | -2.3 | 9.8 | 20.2 | 22.2 | 4 | 126 | 1 (ref.5 #19) | |
| 6 | 16 18 07.43 | 17 43 23.2 | 0.5 | -7.3 | 19.1 | 21.6 | 4 | 129 | 1 (ref6 #10)(ref.5 #2) | |
| 7 | 16 18 07.97 | 17 42 58.0 | 8.1 | -32.5 | 19.1 | 21.8 | 4 | 133 | 2 (ref6 #8)(ref.5 #4) | |
| 8 | 16 18 08.57 | 17 43 43.5 | 16.7 | 13.0 | 18.6 | 21.1 | 4 | 138 | 1 (ref6 #3)(ref.5 #17) | |
| 9 | 16 18 08.79 | 17 44 06.2 | 19.9 | 35.7 | 18.8 | 20.0 | 4 | 140 | 1 | |
| 10 | 16 18 09.72 | 17 43 16.2 | 33.2 | -14.3 | 17.6 | 19.8 | 4 | 144 | 3 (ref.6 #6) | |
| 11 | 16 18 09.84 | 17 43 45.5 | 34.8 | 15.0 | 18.5 | 20.7 | 4 | 146 | 1 (ref.6 #4) | |
| A | 16 18 08.30 | 17 43 17.2 | 12.9 | -13.3 | 21.6 | 22.5 | 4 | 135 | 1 (ref.5 #3) |
Table 2. (Cont.)
| object | (1950) | (1950) | ref | nr. | type() | |||||
| MC 1745+163 | 17 45 55.75 | 16 20 11.5 | 0.0 | 0.0 | 16.2 | 15.6 | QSO | |||
| 1 | 17 45 51.95 | 16 19 31.3 | -54.7 | -40.2 | 18.7 | 3 | ||||
| 2 | 17 45 51.98 | 16 20 42.9 | -54.2 | 31.4 | 17.9 | 3 | ||||
| 3 | 17 45 52.03 | 16 19 09.5 | -53.6 | -62.0 | 16.3 | 3 | ||||
| 4 | 17 45 52.42 | 16 20 49.4 | -47.9 | 37.9 | 18.9 | 3 | ||||
| 5 | 17 45 52.44 | 16 19 44.7 | -47.7 | -26.8 | 13.3 | 13.9 | 3 | |||
| 6 | 17 45 52.57 | 16 19 15.0 | -45.8 | -56.5 | 18.5 | 3 | ||||
| 7 | 17 45 52.91 | 16 20 39.0 | -41.0 | 27.5 | 19.3 | 3 | ||||
| 8 | 17 45 52.94 | 16 20 15.9 | -40.4 | 4.4 | 14.7 | 15.4 | 3 | |||
| 9 | 17 45 52.95 | 16 19 35.2 | -40.4 | -36.3 | 17.2 | 17.1 | 3 | |||
| 10 | 17 45 53.29 | 16 20 44.8 | -35.4 | 33.3 | 15.7 | 16.3 | 3 | |||
| 11 | 17 45 53.52 | 16 19 10.4 | -32.0 | -61.1 | 19.2 | 3 | ||||
| 12 | 17 45 53.52 | 16 20 15.4 | -32.0 | 3.9 | 12.9 | 13.3 | 3 | |||
| 13 | 17 45 53.54 | 16 19 28.3 | -31.7 | -43.2 | 18.9 | 3 | ||||
| 14 | 17 45 54.10 | 16 19 13.0 | -23.8 | -58.5 | 16.0 | 3 | ||||
| 15 | 17 45 54.22 | 16 19 08.9 | -22.0 | -62.6 | 16.9 | 3 | ||||
| 16 | 17 45 54.33 | 16 20 06.4 | -20.5 | -5.1 | 13.6 | 14.1 | 2 | |||
| 17 | 17 45 54.35 | 16 20 14.5 | -20.0 | 3.0 | 18.0 | 19.1 | 3 | |||
| 18 | 17 45 54.36 | 16 19 23.3 | -19.9 | -48.2 | 17.5 | 3 | ||||
| 19 | 17 45 54.45 | 16 19 30.5 | -18.7 | -41.0 | 19.2 | 3 | ||||
| 20 | 17 45 54.74 | 16 21 22.3 | -14.6 | 70.8 | 17.5 | 3 | ||||
| 21 | 17 45 54.97 | 16 20 23.1 | -11.3 | 11.6 | 19.0 | 3 | ||||
| 22 | 17 45 55.36 | 16 19 23.0 | -5.5 | -48.5 | 19.0 | 3 | ||||
| 23 | 17 45 55.37 | 16 20 22.9 | -5.4 | 11.4 | 20.1 | 3 | ||||
| 24 | 17 45 55.38 | 16 21 12.4 | -5.3 | 60.9 | 16.4 | 3 | ||||
| 25 | 17 45 55.47 | 16 20 34.7 | -4.0 | 23.2 | 18.9 | 3 | ||||
| 26 | 17 45 55.65 | 16 19 15.0 | -1.5 | -56.5 | 16.2 | 3 | ||||
| 27 | 17 45 55.78 | 16 19 55.3 | 0.5 | -16.2 | 17.6 | 18.7 | 3 | |||
| 28 | 17 45 55.80 | 16 20 22.9 | 0.8 | 11.4 | 19.8 | 3 | ||||
| 29 | 17 45 55.82 | 16 19 18.5 | 1.1 | -53.0 | 15.9 | 3 | ||||
| 30 | 17 45 56.44 | 16 21 17.7 | 10.0 | 66.2 | 18.3 | 3 | ||||
| 31 | 17 45 56.57 | 16 20 59.0 | 11.8 | 47.5 | 18.2 | 3 | ||||
| 32 | 17 45 56.90 | 16 20 14.7 | 16.5 | 3.2 | 18.7 | 3 | ||||
| 33 | 17 45 57.30 | 16 19 50.7 | 22.3 | -20.8 | 17.4 | 17.7 | 3 | |||
| 34 | 17 45 57.38 | 16 20 04.3 | 23.4 | -7.2 | 16.1 | 16.3 | 3 | |||
| 35 | 17 45 57.69 | 16 20 27.0 | 27.9 | 15.5 | 16.5 | 17.3 | 3 | |||
| 36 | 17 45 57.82 | 16 19 44.6 | 29.7 | -26.9 | 18.0 | 18.3 | 3 | |||
| 37 | 17 45 58.04 | 16 20 15.2 | 32.9 | 3.7 | 18.9 | 3 | ||||
| 38 | 17 45 58.16 | 16 19 26.5 | 34.7 | -45.0 | 17.1 | 3 | ||||
| 39 | 17 45 58.36 | 16 20 25.8 | 37.6 | 14.3 | 17.9 | 17.7 | 3 | |||
| 40 | 17 45 58.54 | 16 19 26.8 | 40.3 | -44.7 | 17.8 | 3 | ||||
| 41 | 17 45 58.56 | 16 19 26.7 | 40.5 | -44.7 | 17.9 | 3 | ||||
| 42 | 17 45 59.11 | 16 19 12.1 | 48.5 | -59.4 | 18.5 | 3 | ||||
| 43 | 17 45 59.30 | 16 19 47.0 | 51.1 | -24.5 | 18.6 | 3 | ||||
| 44 | 17 45 59.45 | 16 19 21.4 | 53.3 | -50.1 | 18.9 | 3 | ||||
| 45 | 17 45 59.89 | 16 20 52.8 | 59.6 | 41.3 | 18.9 | 3 | ||||
| 46 | 17 46 00.16 | 16 20 08.3 | 63.4 | -3.2 | 15.7 | 3 | ||||
| 47 | 17 46 00.18 | 16 20 51.0 | 63.9 | 39.5 | 17.2 | 3 | ||||
| 48 | 17 46 00.55 | 16 21 00.5 | 69.1 | 49.0 | 15.8 | 3 | ||||
| 49 | 17 46 00.56 | 16 20 59.9 | 69.2 | 48.4 | 15.7 | 3 | ||||
| 50 | 17 46 00.70 | 16 20 36.6 | 71.3 | 25.1 | 17.1 | 3 | ||||
| 4C 11.72 | 22 51 40.55 | 11 20 38.7 | 0.0 | 0.0 | 14.4 | 12.7 | 15.8g | 7 | QSO | |
| 1 | 22 51 37.11 | 11 20 46.6 | -50.6 | 7.9 | 18.8 | 2 | ||||
| 2 | 22 51 37.12 | 11 21 14.7 | -50.4 | 36.0 | 20.0 | 3 | ||||
| 3 | 22 51 37.63 | 11 20 58.9 | -42.9 | 20.2 | 18.1 | 1 | ||||
| 4 | 22 51 38.07 | 11 20 56.8 | -36.5 | 18.1 | 17.7 | 16.6 | 21.1g | 8 | 8 | 1(ref.10 #2,0.3287) |
| 5 | 22 51 38.64 | 11 20 33.4 | -28.1 | -5.3 | 17.4 | 16.2 | 20.7g | 8 | 16 | 1(ref.10 #1,0.3240) |
| 6 | 22 51 38.80 | 11 20 39.2 | -25.7 | 0.5 | 18.7 | 18.5 | 20.8 | 7 | 3 | 1(ref8 #15) |
| 7 | 22 51 39.49 | 11 20 29.3 | -15.6 | -9.4 | 17.6 | 17.3 | 21.1 | 7 | 2 | 1(ref8 #18) |
| 8 | 22 51 39.73 | 11 19 48.3 | -12.0 | -50.4 | 18.1 | 21.2g | 8 | 22 | 1 | |
| 9 | 22 51 39.78 | 11 20 38.2 | -11.4 | -0.5 | 19.4 | 18.1 | 21.4 | 7 | 1 | 1 |
| 10 | 22 51 41.66 | 11 20 55.8 | 16.3 | 17.1 | 19.4 | 21.1g | 8 | 10 | 1 | |
| 11 | 22 51 43.77 | 11 20 46.1 | 47.4 | 7.4 | 16.1 | 2 |
g g magnitudes from ref. 8
| object | / | / | M | M | ||
|---|---|---|---|---|---|---|
| (%) | (%) | |||||
| A 0401-350A | 16.0 | 66 | -24.8 | |||
| PKS 0812+020 | 15.8 | 80 | -26.5 | |||
| PKS 0837-120 | 16.2 | 33 | 13.7 | 76 | -24.4 | -26.9 |
| 3C 215 | 18.1 | 23 | -24.3 | |||
| IRAS 09149-6206 | 12.2 | 59 | 10.4 | 60 | -25.5 | -27.4 |
| PKS 1011-282 | 16.7 | 26 | -24.5 | |||
| 3C 275.1 | 17.3 | 80 | -25.9 | |||
| PKS 1302-102 | 14.9 | 40 | -26.6 | |||
| 3C 281 | 17.5 | 40 | 15.8 | 73 | -25.8 | -27.5 |
| 4C 20.33 | 16.3 | 73 | -28.1 | |||
| 4C 11.50 | 17.8 | 71 | -24.7 | |||
| Mrk 877 | 15.0 | 50 | -24.3 | |||
| 3C 334 | 16.3 | 57 | -26.8 | |||
| MC 1745+163 | 17.9 | 21 | 16.2 | 58 | -24.3 | -26.2 |
| 4C 11.72 | 15.6 | 34 | -26.2 |
To calculate absolute magnitudes we have used H0= 50
km s-1 Mpc-1 and q0=0