HST Images and Spectra of the Remnant of SN 1885 in M31
Abstract
Near UV HST images of the remnant of SN 1885 (S And) in M31 show a diameter absorption disk silhouetted against M31’s central bulge, at SN 1885’s historically reported position. The disk’s size corresponds to a linear diameter of at a distance of 725 kpc, implying an average expansion velocity of over 110 years. Low-dispersion FOS spectra over – reveal that the absorption arises principally from Ca II H & K (equivalent width ), with weaker absorption features of Ca I and Fe I . The flux at Ca II line center indicates a foreground starlight fraction of 0.21, which places SNR 1885 some to the near side of the midpoint of the M31 bulge, comparable to its projected distance from the nucleus. The absorption line profiles suggest an approximately spherically symmetric, bell-shaped density distribution of supernova ejecta freely expanding at up to . We estimate Ca I, Ca II, and Fe I masses of , , and respectively. If the ionization state of iron is similar to the observed ionization state of calcium, , then the mass of Fe II is , consistent with that expected for either normal or subluminous SN Ia.
Subject headings:
galaxies: individual (M31) — ISM: supernova remnants — stars: supernovae: individual (SN 1885) — ultraviolet: galaxies — ultraviolet: ISM1. Introduction
SN 1885 (S Andromedae) attained a peak magnitude of 5.85 in August 1885, and remains the only supernova (SN) recorded in the Andromeda galaxy, M31. Descriptions of its optical spectrum indicate a lack of hydrogen and overall agreement with typical SN Ia, except for the notable absence of Si II absorption (de Vaucouleurs & Corwin (1985), hereafter dVC). At M31’s distance of (; van den Bergh (1991); Ostriker & Gnedin (1997) and references therein), and assuming 0.23 mag extinction, SN 1885 had a peak brightness of (van den Bergh (1994)), making it subluminous compared to normal SN Ia (Branch & Miller (1993)). SN 1885 also exhibited an exceptionally fast initial decline (2 mag in 12.5 days), and was substantially redder near maximum () than standard SN Ia events (dVC; Graham (1988); Chevalier & Plait (1988); van den Bergh (1994)). These properties place SN 1885 at the subluminous end of the range of Type Ia supernovae, similar to SN 1986G and SN 1991bg (Filippenko et al. (1992); Leibundgut et al. (1993); Hamuy et al. (1996)).
The remnant of SN 1885 (SNR 1885) was detected in 1988 by Fesen, Hamilton & Saken (1989; hereafter FHS), who used a near-UV filter ( = ; FWHM = ) to image the remnant as an absorption spot silhouetted against M31’s central bulge. FHS attributed the absorption to the resonance line of Fe I , consistent with the expected presence of a large mass of iron in a SN Ia.
In this paper, we present Hubble Space Telescope (HST) imaging and spectral data, which both resolve the SNR 1885 absorption silhouette, and show that Ca II H & K, not Fe I , account for most of the remnant’s near-UV absorption.
2. Observations
2.1. Images
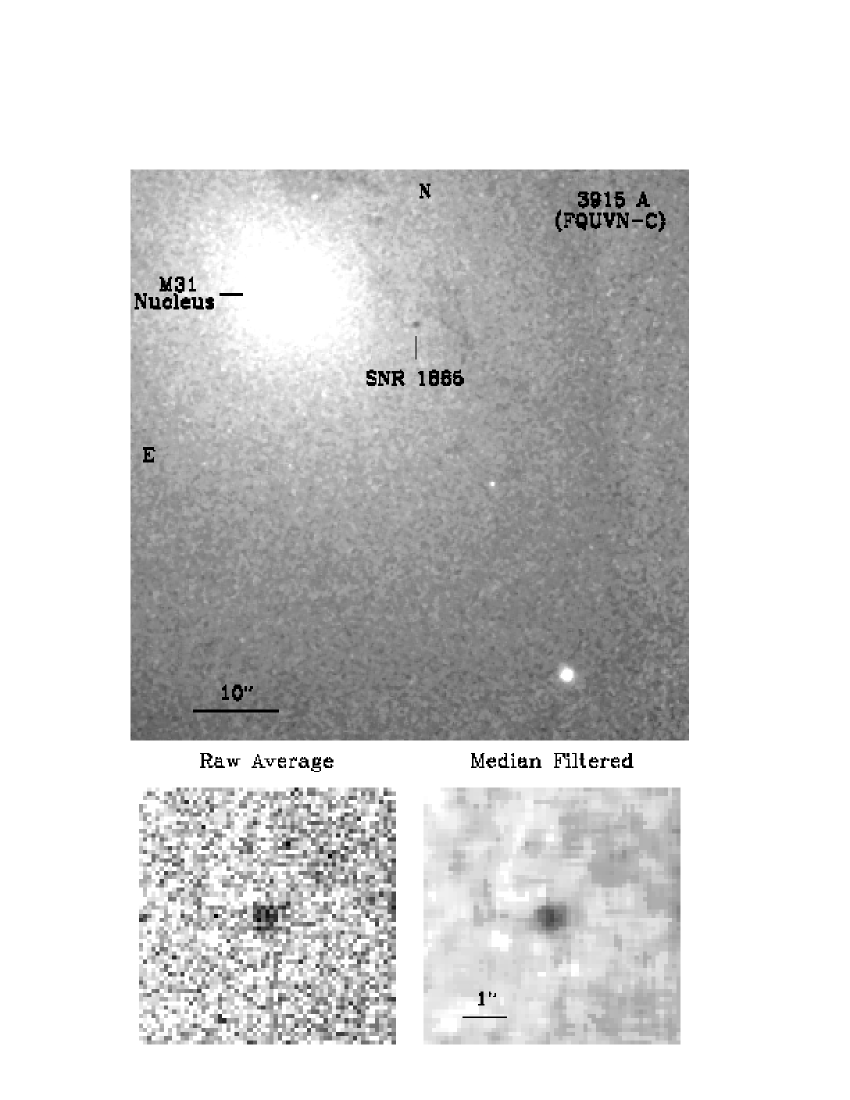
Motivated by the ground-based detection of SNR 1885, we obtained HST “on” and “off” Fe I absorption images using two of the WFPC2 Quad redshifted [O II] 3726, filters. On 1995 August 7, two sets of exposures, centered near the location of SNR 1885, were taken with the FQUVN-C filter (; “off”), and two sets of exposures with the FQUVN-D filter (; “on”). Each set was shifted 5 pixels in both and directions on the CCD, and then unshifted and coadded to remove cosmic ray hits and hot pixels.
While the “on-band” images showed surprisingly little absorption, the supposed “off-band” images revealed a dark spot at the site of SN 1885 (see Fig. 1, top). The remnant’s prominence in the image immediately suggested that Ca II 3934, (K & H), not Fe I , was the cause of the absorption both here and in FHS’s ground-based images.
The dark spot contained an average 1.0 counts per pixel in each exposure, while adjacent regions of the bulge contained 2.2 counts per pixel. These low counts result from the faintness of M31’s bulge below , coupled with WFPC2’s pixel size.
From the stacked frames we measured a SNR diameter of , with no evidence for non-circularity (see Fig. 1, bottom panels). This angular size corresponds to a linear diameter of at M31’s distance of , which in turn implies an average expansion velocity of over (1885–1995). This velocity is essentially the same as that seen in the absorption spectrum of Ca II (see below), indicating that the ejecta are freely expanding. The velocity is also similar to the velocities seen in Ca II absorption in SN Ia spectra at early times (Leibundgut et al. (1993)).
The coordinates of the SNR 1885 spot measured from the WFPC2 images are , . This places SNR 1885 at west and south of M31’s nucleus, in good agreement with the offset distances of W and S measured from historical plates (dVC).
| Parameter | Value, with Error |
|---|---|
| Fe I mass | |
| Ca II mass | |
| Ca I mass | |
| Fe I central density | |
| Ca II central density | |
| Ca I central density | |
| Maximum expansion velocity | |
| Foreground starlight fraction | |
| Aperture offset from center |
2.2. FOS Spectra
Low-dispersion spectra of the SNR 1885 absorption spot were obtained on 1995 November 14 using the G400H grating on HST’s Faint Object Spectrograph (FOS), covering 3240–. Total exposure time on target was . However, because of an offset star positioning error, the spectrograph’s 043 diameter aperture missed SNR 1885’s 070 disk following a blind offset slew.
The observations were re-attempted on 1996 December 30, with integration time of , resulting in a successful detection of the absorption spectrum of SNR 1885. High counts from a few hot detector channels were removed from 7 of the 31 accumulation data groups, and replaced with interpolated averages of adjacent pixel values.
To provide a template background spectrum of starlight, FOS spectra of the M31 bulge close to the bright nucleus were also taken through a 086 aperture, a exposure in 1995, and in 1996.
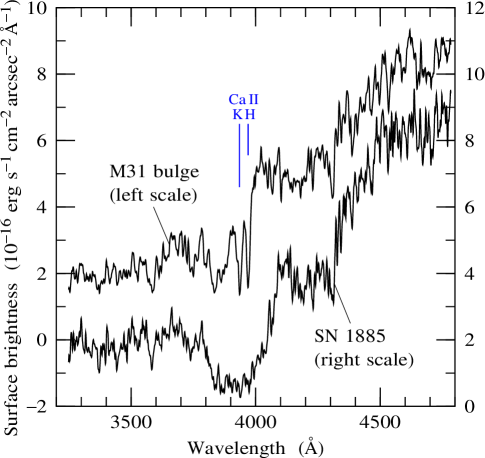
Figure 3 shows the FOS spectra of the M31 bulge, and of the SNR 1885 absorption spot. Wavelengths of all spectra have been transformed to the rest frame of M31 by correcting for M31’s blueshift, plus an additional blueshift that appears consistently in all spectra and which we attribute to an FOS calibration error.
Comparison of the two bright bulge spectra with the fainter ones obtained near SNR 1885’s location (i.e. with the missed 1995 spectra) reveals that the brighter bulge spectra are a tinge redder, but otherwise not significantly different. To produce the bulge spectrum shown in Figure 3, we blued the brighter spectra to the same color as the fainter SNR 1885 ones, by multipling by , before coadding all four spectra.
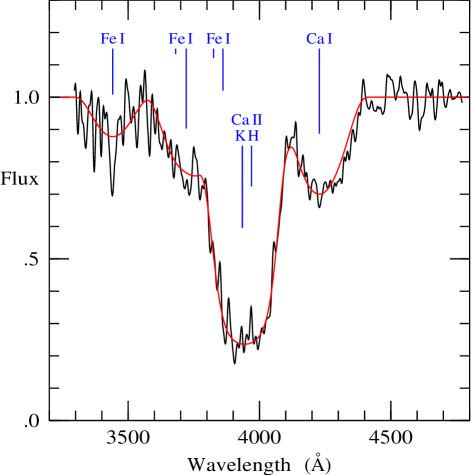
Dividing the spectrum of the SNR 1885 absorption spot by that of the bulge effectively removes stellar features, leaving a clean spectrum of the remnant, as shown in Figure 3. The SNR 1885 spectrum shows a broad, strong absorption feature centered at (equivalent width 215 Å), which is undoubtedly Ca II 3934, (K & H). This absorption feature is flanked on its red side by a similarly broad but weaker feature centered at , and on its blue side by a broad depression around . We identify the absorption feature to the red as the strong resonance line of Ca I (oscillator strength ; Morton (1991)), even though the observed line center is redshifted by , and the depression to the blue as Fe I , the strongest Fe I resonance line () in the 3200– region. No plausible and consistent alternative identifications (such as Cr I) were found for these features.
| Model | Fe | Ca | ref |
|---|---|---|---|
| () | () | ||
| Subluminous SN Ia | |||
| PDD1caa PDD1c is an updated version of model PDD5 of Höflich, Khokhlov & Wheeler (1995). | 0.12 | 0.017 | H98 |
| HeD6 | 0.18 | 0.011 | HK96, H98 |
| Model 1 | 0.29 | 0.022 | WW94 |
| Normal SN Ia | |||
| NCD6A | 0.56 | 0.0083 | W97 |
| WDD2 | 0.70 | 0.035 | N97 |
| DD21c | 0.73 | 0.040 | HWT98 |
| W7 | 0.77 | 0.041 | NTY84 |
References. — (H98) Höflich 1998, private communication; (HK96) Höflich & Khokhlov 1996; (HWT98) Höflich, Wheeler & Thielemann 1998; (N97) Nomoto et al. 1997; (NTY84) Nomoto, Thielemann, & Yokoi 1984; (WW94) Woosley & Weaver 1994; (W97) Woosley 1997.
3. Analysis
3.1. Model Fitting
The HST image and spectrum of SNR 1885 provide information about the mass and density distribution of the supernova ejecta. The spherical symmetry of the absorption image, along with the approximate central symmetry of the Ca II and Ca I absorption line profiles (setting aside for the moment the redshift of Ca I), suggest that the intrinsic density distribution is approximately spherically symmetric. Further, all three ion species Ca II, Ca I, and Fe I appear to have comparably broad absorption profiles, suggesting that their density distributions may be similar. We therefore adopt the simplifying assumptions (a) that the density distribution is spherically symmetric, and (b) that the density distribution is the same for all three ion species.
The likelihood that the strong Ca II H and K absorption is partially saturated at its center, and the unknown level of starlight to the foreground of SNR 1885, make interpretation of the central parts of the Ca II feature ambiguous. The Ca I feature is clearer in this respect, since its breadth and shallowness suggest that it is optically thin, and foreground starlight makes only a relatively small contribution. The shape of the Ca I absorption profile indicates that the intrinsic density distribution is centrally concentrated. Trial fits to the Ca I profile assuming the FOS aperture was precisely centered on the remnant indicate an approximately quadratic density distribution, with maximum velocity .
Applying the same quadratic density distribution to the Ca II feature leads to a maximum velocity some or so larger. This could mean that the Ca II is more extended than Ca I, or it could mean that the Ca density distribution has wings. Both possibilities are plausible; we adopt the latter.
The Ca I and Ca II absorption profiles together fit nicely to a bell-shaped intrinsic density distribution, a quartic
| (1) |
and the same distribution works well also for Fe I. Again, in arriving at this density distribution, we assumed that the FOS aperture was accurately centered on the remnant.
Figure 3 shows the best fit model assuming the bell-shaped density distribution of equation (1), and Table 1 gives the fitted parameters of the model. We choose to quote errors on the parameters, in part to allow for uncertainty in the choice of model.
Much of the quoted uncertainties listed in Table 1 derive from uncertainties in two quantities, the fraction of starlight to the foreground of SNR 1885, and the offset of the FOS aperture from the precise center of the remnant. Increasing the fraction of foreground starlight from its best fit value of 0.21 increases the quantity of Ca II required to maintain the observed depth of the absorption, making the central parts of the Ca II profile more optically thick, and flattening the bottom of the profile. Similarly, mis-centering the FOS aperture within the remnant increases the amount of Fe I, Ca II, and Ca I required to maintain the observed depth of absorption.
The foreground starlight fraction can be used to infer the line-of-sight distance between SNR 1885 and the midpoint of the bulge of M31, given a model of the 3-dimensional distribution of starlight in M31. The surface brightness profile of the bulge measured from the WFPC2 image shows a cusp-like core within radius, but outside this the surface brightness fits a modified Hubble law (cf. Binney & Tremaine (1987), p. 230). For a foreground starlight fraction of , and at M31’s distance, this modified Hubble model places SNR 1885 at to the near side of the bulge midpoint, comparable to its transverse distance of from the center of M31.
3.2. Masses
The dominant element in SNe Ia is thought to be iron. As discussed in §3.4 below, the photoionization lifetime of Fe I in SNR 1885 is rather short. This, along with the observed ionization state of calcium, suggests that iron in SNR 1885 is probably mostly Fe II at the present time. The fact that the ejecta are still freely expanding out to indicates that to date they have swept up little interstellar gas, so there is little shocked gas emitting the hard UV and x-ray radiation capable of photoionizing iron or calcium to doubly-ionized or higher ionization stages (cf. Hamilton & Fesen 1988). Thus, there is probably little iron or calcium in ionization stages higher than singly-ionized.
The mass of Fe II can be estimated from where is the ionization state of iron relative to that of calcium. This yields
| (2) |
Since Fe I has a somewhat higher ionization potential than Ca I ( vs. ), the ionization state of Fe is likely to be somewhat lower than that of Ca, that is, is expected to be a number somewhat less than 1.
For comparison, Table 2.2 lists the mass of iron and calcium predicted in a selection of model SNe Ia taken from recent literature. A mass of iron in SNR 1885 is more consistent with models of subluminous than normal SN Ia. However, the large uncertainty in the estimate means that a higher Fe mass, consistent with a normal SN Ia, cannot be ruled out. The mass of calcium in SNR 1885 (Table 1) is also more consistent, on the whole, with the lower calcium masses predicted by subluminous SN Ia models.
3.3. Predicted UV spectrum
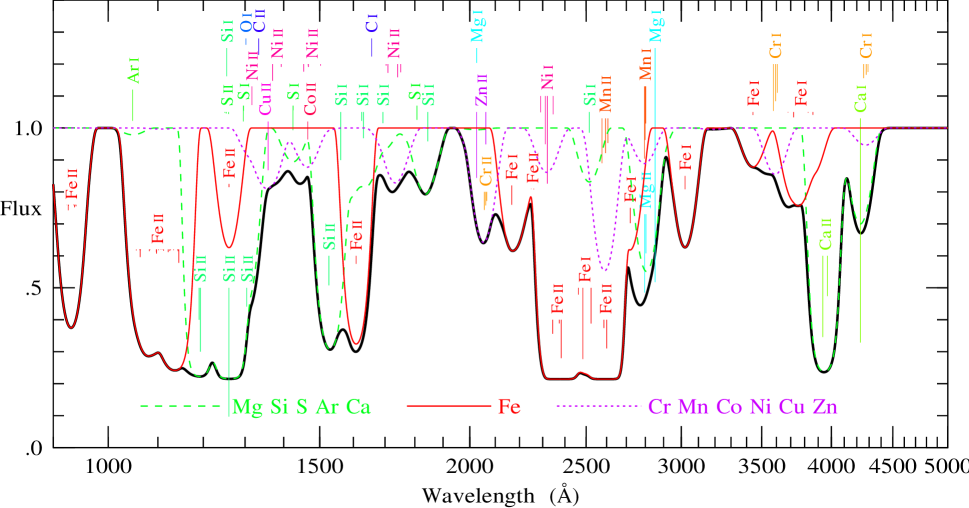
Figure 4 shows the UV-optical absorption spectrum of SNR 1885 predicted by the model of §3.1. The optical part of the spectrum is (aside from the Cr I lines; see below) the same as the best fit spectrum shown in Figure 3. The predicted spectrum includes absorption from all expected non-negligible resonance lines with wavelengths above , a total of 122 lines, extracted from the list of Morton (1991). The model includes neutral and singly-ionized species of C, O, Mg, Al, Si, S, Ar, Ca, and iron-group elements with ionic charges from 22 to 30, namely Ti, V, Cr, Mn, Fe, Co, Ni, Cu, and Zn. The abundances of the optically observed ions Ca I, Ca II, and Fe I were fixed at their best fit values. Abundances of other elements, relative to Fe, were taken from the normal SN Ia model DD21c of Höflich, Wheeler & Thielemann (1998). The ratio of neutrals to singly-ionized ions was set at 1:10 in all cases except Ca.
The model spectrum does not include continuum opacity. Aside from possible dust, probably the only important current source of continuum opacity is Fe I. The photoionization cross-section of Fe I (Lombardi, Smith & Parkinson 1978; Hansen et al. 1977) averages about between threshold () and Lyman (), with a broad peak from many resonances between and . At an Fe I column density of through the center of the remnant, this implies an average continuum optical depth of about . This continuum opacity is not included in the spectrum shown in Figure 4, in part because the available cross-section data, referenced above, are not precise enough for the purpose.
The predicted UV spectrum shows broad, deep chasms of absorption dominated by Fe II and Si II. The strongest of these lines are optically thick and heavily blended, so the weaker Fe II and Si II lines will be important in constraining abundances reliably from future observations.
Other notable features of the model spectrum include the following: The clearest line of Fe I is , and of Si I is . The least contaminated view of Ni II is the complex around , the strongest lines there being Ni II and , . Lines of Co II and Cu II appear in the window around , somewhat blended with S I and several lines of Ni II. There is a fairly isolated feature consisting of Cr II and Zn II 2026, . The strongest lines of C and O, namely C I , C II , and O1 I , are marked in Figure 4, but produce very little absorption at the adopted abundances. Lines of Ti and V are included in the model, but produce negligible absorption.
The model predicts three times more Cr I than the observed upper limit from Cr I 3579, 3594, and Cr I 4255, 4275, . We have chosen to include Cr I at the predicted level in Figure 4, in part to emphasize the fact that the observed optical spectrum already places an interesting upper limit on the strength of Cr I lines. The relative weakness of Cr I is not much of a puzzle, since the photoionization lifetime of Cr I is even shorter than that of Ca I or Fe I (cf. §3.4), so the abundance of Cr I relative to Cr II could well be less than the 1:10 ratio assumed in the model.
The predicted UV spectrum of SNR 1885 is stunningly rich. Unfortunately, the low surface brightness of UV starlight from the bulge of M31 means that the S/N ratio attainable with the Space Telescope Imaging Spectrograph (STIS) on HST is marginal, even in a fairly long exposure.
3.4. Photoionization
Ejecta in SNR 1885 should be partially photoionized by UV starlight from the M31 bulge. Figure 4 indicates that the ejecta are likely to be optically thick at some UV wavelengths, and optically thin at others. For simplicity, we consider what happens if the ejecta are optically thin at all wavelengths.
In the limit where the ejecta are optically thin, and in the approximation that starlight from the bulge is spherically symmetric about the center of M31, the flux seen by SNR 1885 at wavelength , integrated over all directions, is related to the dereddened surface brightness at transverse distance from the nucleus of M31, as observed by us on Earth, by
| (3) |
where is the 3-dimensional distance between SNR 1885 and the nucleus.
Equation (3) permits an estimate of the lifetime of ions in SNR 1885 exposed to photoionization by UV starlight, in the optically thin limit. We measured the surface brightness from the WFPC2 image, averaged in circular annuli about the center of M31, and we assumed that the surface brightness distribution is the same at all wavelengths. We then took the UV spectrum of the bulge from the IUE data of Burstein (1988) down to , and from the HUT data of Ferguson & Davidsen (1993) down to , dereddened using the Cardelli et al. (1989) extinction curve with color excess (Ferguson & Davidsen (1993)) and . We normalized the surface brightnesses to the bulge spectrum shown in Figure 3. Finally, we integrated over photoionization cross-sections from Verner et al. (1996), to derive photoionization lifetimes , given by .
The result is that the lifetimes of Ca I and Fe I ions in SNR 1885 exposed to UV starlight from the bulge of M31 are, in the optically thin limit, and respectively. Quoted uncertainties here include only those arising from () uncertainty in the 3-dimensional distance of SNR 1885 from the nucleus of M31, not uncertainties in the extinction, the photoionization spectrum or surface brightness distribution, or in photoionization cross-sections, which could plausibly lead to an additional factor of two uncertainty.
Recombination is negligible. While expansion acts as an efficient refrigerator, the competition between adiabatic cooling and photoionization heating probably leads to T K. At any temperature exceeding , the sum of radiative and dielectronic recombination rates is no more than for either Ca I or Fe I (Arnaud & Rothenflug 1985). The electron density at the densest point, the center of the remnant, is probably no more than , assuming that Fe II is the most abundant ion and that Fe II/Fe I is no more than . These estimates imply that recombination times exceed , two orders of magnitude longer than the age of the remnant.
The photoionization times of for Ca I and for Fe I are for optically thin ejecta, whereas Figure 4 shows that the ejecta are likely to be optically thick in broad bands of the ultraviolet. A rough estimate based on the results of Figure 4 suggests that the photoionization times should be increased by a factor of perhaps 2 to allow for optical depth effects, implying photoionization times .
Such short photoionization lifetimes offer a natural explanation of the fact that calcium in SNR 1885 is observed to be mostly singly-ionized, . Other elements in the ejecta can similarly be expected to be mostly singly-ionized, as assumed in the model spectrum of Figure 4.
At the same time, the photoionization lifetimes of Ca I and Fe I are short enough as to raise the question of why one sees these ions at all? One plausible explanation is that the ejecta are in the process of making a transition from being optically thick to optically thin to photoionizing radiation, and that the ejecta are currently undergoing a period of rapid photoionization out of the neutral state. We pointed out in §3.3 that the continuum optical depth of Fe I through the center of the remnant is currently of order in the UV at wavelengths shorter than the ionization threshold of Fe I. We have also argued that there is currently about 10 times as much Fe II as Fe I. If all of this iron were Fe I rather than Fe II, then the continuum optical depth of the Fe I would be increased to about unity. Consequently the Fe I would then be in effect self-shielded, inhibiting its photoionization. Since column densities in the expanding ejecta are decreasing with time as , optical depths would have been higher in the past, thus providing better self-shielding. Thus the picture that emerges is that the ejecta may be currently in the process of thinning out sufficiently to undergoing a period of rapid photoionization out of the neutral state. Hamilton & Fesen (1991) previously arrived at the same conclusion.
It remains to be seen whether this picture can account quantitatively for the fact that Ca I as well as Fe I remain observable in spite of their rather short current photoionization lifetimes. Whatever the case, this self-shielding scenario makes a definite observational prediction, that there should be an observable reduction in absorption from Ca I and Fe I over a timescale of a decade or two.
3.5. The puzzle of redshifted Ca I
A final problem, possibly related to the problem of the short photoionization lifetime of Ca I, is that the observed Ca I absorption feature appears redshifted by , as is evident in Figure 3. There is also a hint of an abrupt blue edge at on the Ca I feature, blueward of (vacuum) line center. The possible blue edge is unlikely to be caused by a shock front (cf. Hamilton et al. (1997)) since no corresponding blue edge is observed on the Ca II feature.
On the other hand, the redshift of the Ca I line profile could be caused by photoionization, with the abrupt blue edge a possible sign of a photoionization front. Hamilton & Fesen (1991) argued that the remnant of SN 1885 should be receiving a one-sided tan, being photoionized more on the side facing the nucleus of M31. This would predict that Ca I should if anything appear blueshifted, and any photoionization front should be on the red side, opposite to what is observed.
The possibility that the apparent redshift is caused by Cr I 4255, 4275, absorption is excluded by the absence of the stronger Cr I 3579, 3594, lines (cf. Figs. 3 and 4).
We can offer no compelling solution to this puzzle. The observed symmetry of the Ca II line suggests that the supernova ejecta as a whole are not grossly aspherical. Perhaps however the Ca I is concentrated into optically thick lumps, distributed unevenly through the remnant, with our FOS aperture detecting more red than blueshifted clumps. Perhaps an interstellar dust cloud happens to intervene between SNR 1885 and the M31 nucleus, allowing photoionization to proceed more rapidly on the near, blueshifted, side. J. M. Shull (1998, private communication) suggests the possibility that Ca is locked into grains, and Ca I is being liberated by photo-evaporation preferentially on the side nearer the nucleus.
4. Conclusions
HST FOS spectra of the remnant of the apparently subluminous Type Ia supernova of 1885 (S And) in M31 reveal the presence of broad absorption lines of Ca II 3934, (K & H), Ca I , and Fe I 3720 Å. The absorption line profiles indicate a bell-shaped distribution of supernova ejecta expanding at up to km s-1.
HST WFPC2 images of the remnant show an absorption spot in diameter, corresponding to a free expansion velocity of at the distance of M31. The agreement between the expansion velocities inferred from spectrum and image demonstrates that the ejecta are freely expanding. The presence of low ionization species in the ejecta, Ca I, Ca II, and Fe I, is consistent with the notion that the ejecta are freely expanding and unshocked.
The flux at Ca II line center indicates a foreground starlight fraction of , which places SNR 1885 some to the near side of the midpoint of the M31 bulge, comparable to its projected distance from the nucleus.
The presence of Ca I and Ca II lines is consistent both with the appearance of calcium lines in the spectra of SN Ia near maximum light (Leibundgut et al. (1993); Filippenko 1997), and with the predictions of SN Ia models. The masses of Ca I, Ca II, and Fe I inferred from the absorption spectrum of SNR 1885 are , , and respectively (Table 1). If the ionization state of iron is similar to that of calcium, then the mass of Fe II is . These low masses are more consistent with SN 1885 having been a subluminous event (Table 2.2), as suggested by the historical record, but the large uncertainties do not exclude a normal SN Ia.
We estimate that the lifetimes of Ca I and Fe I against photoionization by UV starlight from the bulge of M31 are only . We have argued that the ejecta are in the process of making a transition from being optically thick to optically thin to photoionizing radiation, and that the ejecta are currently undergoing a period of rapid photoionization out of the neutral state. If this is correct, then there should be an observable reduction in the strength of the Ca I and Fe I absorption lines over a timescale of a decade or two.
We have pointed out, but are unable to explain in a natural way, an apparent redward displacement of the Ca I absorption feature from its expected line center.
The model inferred from the optical spectrum of SNR 1885, coupled with abundances expected in SN Ia, predicts a rich UV spectrum of absorption lines. If a UV spectrum with adequate signal-to-noise ratio could be obtained, then in principle it would be possible to infer the masses of Mg, Si, Cr, Co, Ni, Cu, and Zn, in addition to Ca and Fe. Unfortunately the faintness of the bulge of M31 in the UV means that the S/N ratio currently attainable with STIS on HST is marginal.
Subluminous events like SN 1885, once thought to be anomalous, have recently become better understood as part of a wider range of Type Ia supernovae (Graham (1988); Hamuy et al. (1996)). Unusually red and faint SNe Ia like SN 1991bg have been interpreted as originating from lower mass progenitors (Chevalier & Plait (1988); Filippenko et al. (1992); Leibundgut et al. (1993); Nugent et al. (1997)). Future observations of SNR 1885 in absorption offer a potentially powerful tool for understanding not only SN 1885 itself, but also the class of subluminous SNe Ia in general.
References
- Anders & Grevesse (1989) Anders, G., & Grevesse, N. 1989, Geochimica et Cosmochimica Acta, 53, 197
- Arnaud & Rothenflug (1985) Arnaud, M., & Rothenflug, R. 1985, A&AS, 60, 457
- Binney & Tremaine (1987) Binney, J., & Tremaine, S. 1987, Galactic Dynamics, (Princeton University Press)
- Branch & Miller (1993) Branch, D., & Miller, D. L. 1993, ApJ, 405, L5
- Burstein et al (1988) Burstein, D., Bertola, F., Buson, L. M., Faber, S. M., & Lauer, T. R. 1988, ApJ, 328, 440
- Cardelli et al (1989) Cardelli, J. A., Clayton, G. C., & Mathis, J. S. 1989, ApJ, 345, 245
- Chevalier & Plait (1988) Chevalier, R. A., & Plait, P. C. 1988, ApJ, 331, L109
- de Vaucouleurs & Corwin (1985) de Vaucouleurs, G., & Corwin, H. G. Jr. 1985, ApJ, 295, 287 (dVC)
- Ferguson & Davidsen (1993) Ferguson, H. C., & Davidsen, A. F. 1993, ApJ, 408, 92
- Fesen, Hamilton, & Saken (1989) Fesen, R. A., Hamilton, A. J. S., & Saken, J. M. 1989, ApJ, 341, L55 (FHS)
- Filippenko et al. (1992) Filippenko, A. V., et al. 1992, AJ, 104, 1543
- Filippenko (1997) Filippenko, A. V. 1997, ARA&A, 35, 309
- Graham (1988) Graham, J. R. 1988, ApJ, 326, L51
- Hamilton & Fesen (1988) Hamilton, A. J. S., & Fesen, R. A. 1988, ApJ, 327, 178
- Hamilton & Fesen (1991) Hamilton, A. J. S., & Fesen, R. A. 1991, in Supernovae, 10th Santa Cruz Summer Workshop in Astronomy and Astrophysics, ed. S. E. Woosley (Berlin: Springer-Verlag) 656
- Hamilton et al. (1997) Hamilton, A. J. S., Fesen, R. A., Wu, C.-C., Crenshaw, D. M., & Sarazin, C. L. 1997, ApJ, 482, 838
- Hamuy et al. (1996) Hamuy, M., Phillips, M. M., Suntzeff, N. B., Schommer, R. A., Maza, J., Smith, R. C., Lira, P., & Aviles, R. 1996, AJ, 112, 2438
- Hannaford et al. (1992) Hannaford, P., Lowe, R. M., Grevesse, N., Noels, A. 1992, A&A, 259, 301
- Hansen et al. (1977) Hansen, J. E., Ziegenbein, B., Lincke, R., & Kelly, H. P. 1977, J. Phys. B., 10, 37
- Höflich & Khokhlov (1996) Höflich P., & Khokhlov, A. 1996, ApJ, 457, 500
- Höflich, Wheeler & Thielemann (1998) Höflich, P., Wheeler, J. C., & Thielemann, F.-K. 1998, ApJ, 495, 617).
- Leibundgut et al. (1993) Leibundgut, B., et al. 1993, AJ, 105, 301
- Lombardi, Smith & Parkinson (1978) Lombardi, G. G., Smith, P. L., & Parkinson, W. H. 1978, Phys. Rev. A, 18, 2131
- Morton (1991) Morton, D. C. 1991, ApJS, 77 119
- Nomoto, Thielemann, & Yokoi (1984) Nomoto, K., Thielemann, F.-K., & Yokoi, K. 1984, ApJ, 286, 644
- Nomoto et al. (1997) Nomoto, K., Iwamoto, K., Nakasato, N., Thielemann, F.-K., Brachwitz, F., Tsujimoto, T., Kubo, Y., & Kishimoto, N. Nuclear Physics A, 621, 467c
- Nugent et al. (1997) Nugent, P., Baron, E., Branch, D., Fisher, A., & Hauschildt, P. H. 1997, ApJ, 485, 812
- Ostriker & Gnedin (1997) Ostriker, J. P., & Gnedin, O. Y. 1997, ApJ, 487, 667
- van den Bergh (1991) van den Bergh, S. 1991, PASP, 103, 1053
- van den Bergh (1994) van den Bergh, S. 1994, ApJ, 424, 345
- Verner et al (1996) Verner, D. A., Ferland, G. J., Korista, K. T., & Yakovlev, D. G. 1996, ApJ, 465, 487
- Woosley (1997) Woosley, S. E. 1997, ApJ, 476, 801
- Woosley & Weaver (1994) Woosley, S. E., & Weaver, T. A. 1994, ApJ, 423, 371