13CO( = 1 – 0) DEPRESSION IN LUMINOUS STARBURST MERGERS
Abstract
It is known that the class of luminous starburst galaxies tends to have higher CO(=1–0)CO(=1–0) integrated line intensity ratios () than normal spiral galaxies (). Since most previous studies investigated only , it remains uncertain whether the luminous starburst galaxies are overabundant in 12CO or underabundant in 13CO. Here we propose a new observational test to examine this problem. Our new test is to compare far-infrared luminosities [(FIR)] with those of 12CO and 13CO [(12CO) and (13CO), respectively]. It is shown that there is a very tight correlation between (12CO) and (FIR), as found in many previous studies. However, we find that the 13CO luminosities of the high- galaxies are lower by a factor of three on the average than those expected from the correlation for the remaining galaxies with ordinary values. Therefore, we conclude that the observed high values for the luminous starburst galaxies are attributed to their lower 13CO line intensities.
1 INTRODUCTION
It is known that the class of luminous starburst galaxies with (FIR) tends to have higher CO(=1–0)CO(=1–0) integrated line intensity ratios than normal spiral galaxies (Aalto et al. 1991, 1995, 1997; Casoli et al. 1991; Casoli, Dupraz, & Combes 1992a, 1992b; Hurt & Turner 1991; Turner & Hurt 1992; Garay, Mardones, & Mirabel 1993; Henkel & Mauersberger 1993; Henkel et al. 1998). It was often considered that the higher values observed in these galaxies are attributed to the inflow of disk gas with high 12CC abundance ratios, possibly combined with a 12C enhancement caused by nucleosynthesis in massive stars (e.g., Henkel et al. 1998). However, since most previous studies investigated only the ratios, it is uncertain whether or not these luminous starburst galaxies are overluminous in 12CO or underluminous in 13CO (Casoli et al. 1992a). In this Letter, comparing the luminosities of 12CO(=1–0), 13CO(=1–0) (hereafter 12CO and 13CO, respectively), and FIR emission for a sample of starburst and normal galaxies for which all the data are available in literature, we show that the observed higher values are mainly attributed to a lower intensity in 13CO with respect to 12CO. We discuss possible physical mechanisms which can explain the 13CO(=1–0) depression in luminous starburst galaxies.
2 DATA AND RESULTS
We have compiled 12CO and 13CO intensities from the literature (Wiklind & Henkel 1990; Aalto et al. 1991, 1995; Becker & Freudling 1991; Sage & Isbell 1991; Casoli et al. 1992b; Garay et al. 1993; Henkel, Whiteoak, & Mauersberger 1994). Our sample consists of 51 galaxies including ultraluminous infrared galaxies such as Arp 220. These data are used to estimate the CO luminosities; (CO) is defined as (CO)(CO) K km s-1 pc2 where is the observed area in units of pc2 and (CO) K km s-1 where is the observed antenna temperature corrected for atmospheric extinction and is the main beam efficiency.
The FIR data are compiled from the IRAS Faint Source Catalog (Moshir et al. 1992). The FIR luminosities are estimated using (FIR) (ergs s-1) where (60) and (100) are the IRAS 60 m and 100 m fluxes in units of Jy and is the distance of galaxies in units of cm (Helou, Soifer, & Rowan-Robinson 1985). Distances of nearby galaxies are taken from the Nearby Galaxies Catalog (Tully 1988); distances of other galaxies are estimated using a Hubble constant = 75 km s-1 Mpc-1 with (radial velocity corrected to the Galactic Center: de Vaucouleurs et al. 1991). The compiled data are given in Table 1. Though our sample is not statistically complete, it is the largest sample compiled so far.
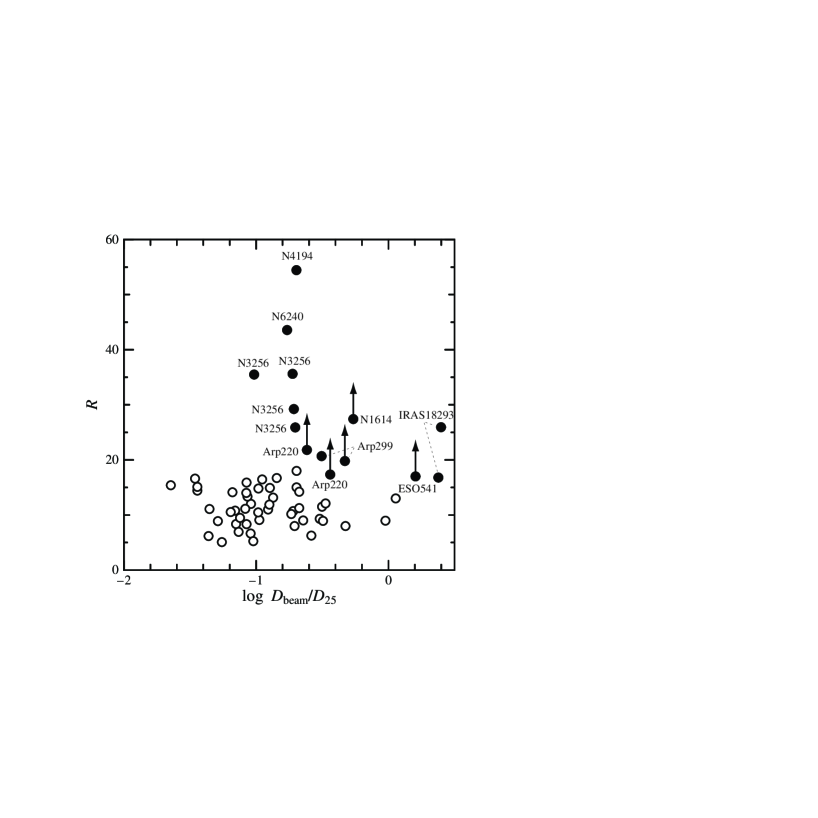
As shown in Table 1, there are several galaxies which have . Hereafter we refer to these sources as high- galaxies (NGC 1614, NGC 3256, NGC 4194, NGC 6240, Arp 220, and Arp 299). ESO 541–IG 23 [= Arp 236, (lower limit)] and possibly IRAS 182933413 (: Garay et al. 1993; : Aalto et al. 1995) are also high- galaxies. In total, there are eight high- galaxies in our sample. Except for the uncertain case of IRAS 182933413, all these high- galaxies are mergers. For the remaining 43 galaxies, we obtain an average ratio, . The values are consistent with previous estimates of (Aalto et al. 1991) and (Sage & Isbell 1991) for normal galaxies.
First, we examine whether or not there is a beam size effect on because the CO line observations did not cover the whole area of the individual galaxies. Ratios of beam size ( = half power beam width) to optical diameter at 25 mag arcsec-2 (: de Vaucouleurs et al. 1991) are given in the third column of Table 1. In Figure 1, is plotted as a function of . We find no clear correlation, indicating that the difference in cannot be attributed to the beam-size effect.
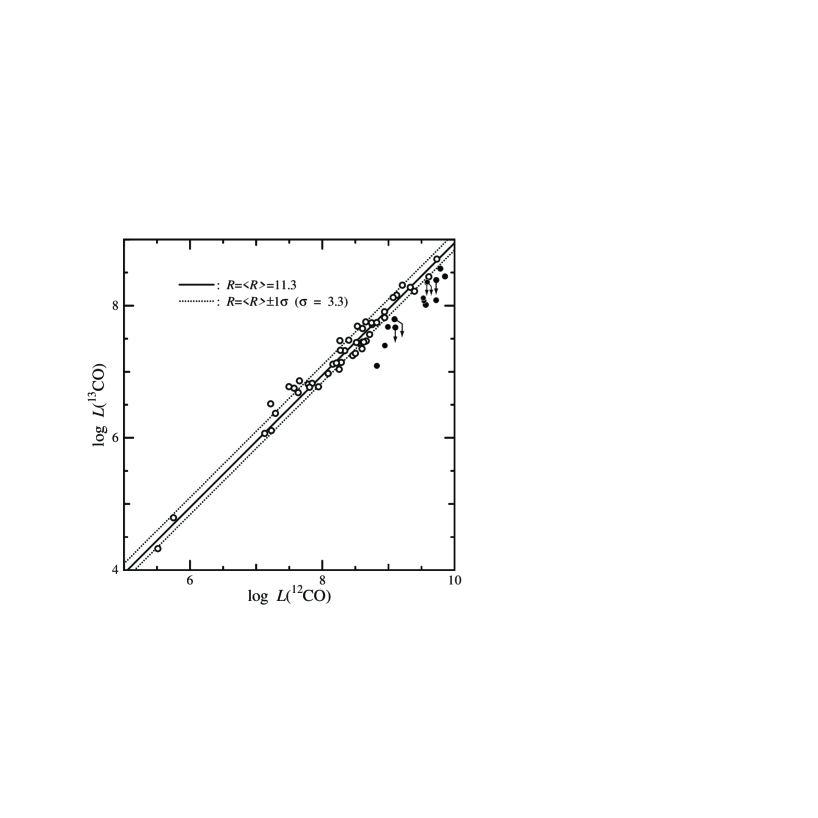
In Figure 2, we compare (12CO) with (13CO). A tight correlation is found for galaxies with (12CO) K km s-1 pc2. This almost linear correlation can be expressed as log (13CO)() log (12CO)(). However, more luminous galaxies do not follow the same correlation, i.e., some of the luminous galaxies have lower 13CO luminosities with respect to 12CO.
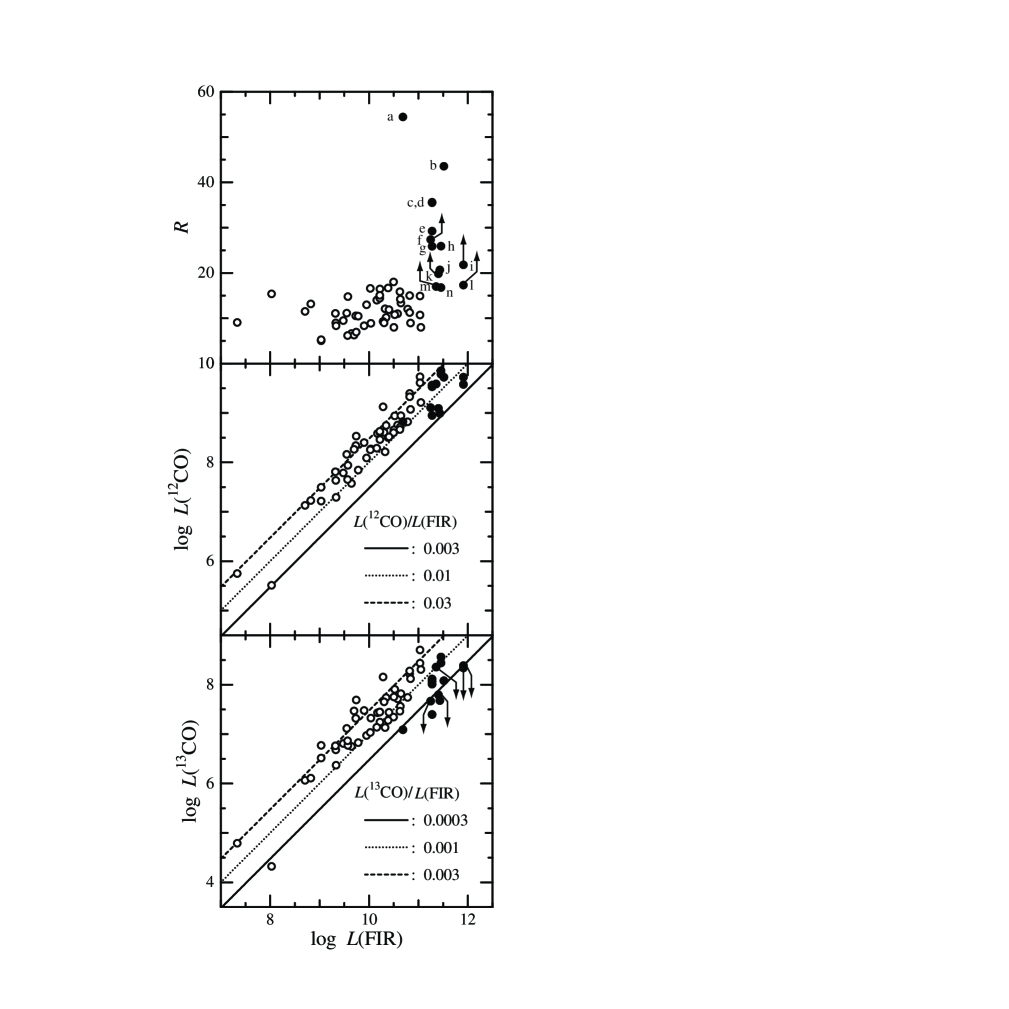
In Figure 3, we compare (FIR) with both (12CO) and (13CO). It is shown that (12CO) is well correlated with (FIR); its correlation coefficient is 0.94. The average CO)/(FIR) for the high- galaxies, 0.0130.007, is similar to that for the normal ones, 0.0230.013. This correlation has been noted in many previous studies (e.g., Young & Scoville 1991 and references therein). In fact, Figure 3 shows that the correlation is established within a factor of three dispersion except for one galaxy (NGC 55) which is a nearby Magellanic-type irregular galaxy (Becker & Freudling 1991). On the other hand, the correlation between (FIR) and (13CO) appears to be significantly poorer (the correlation coefficient is 0.86) than that between (FIR) and (12CO). The correlation is poorer because the high- luminous starburst galaxies have lower 13CO luminosities than expected for galaxies with ordinary values; note that the average value of CO)/(FIR) is 0.00051 0.00034 for the high- galaxies while that for the normal galaxies is 0.0023 0.0017. Thus, we conclude that the higher in the luminous starburst mergers is mostly due not to enhanced 12CO emission but to depressed 13CO line intensities. An average value for the high- galaxies is . Since lower-limit data are used in this estimate, we obtain a 13CO depression factor , given for the normal galaxies. Any physical mechanism must explain the intrinsic weakness of 13CO( = 1 – 0) emission by a factor of in the luminous starburst mergers.
3 DISCUSSION
Here we investigate possible mechanisms that can explain the intrinsic weakness of 13CO( = 1 – 0) emission by a factor of in the luminous starburst mergers. High values may be caused by (see also Sakamoto et al. 1997): 1) low gas densities, 2) high gas kinetic temperatures, 3) large nuclear velocity gradients that keep CO column densities small at a given velocity, 4) small CO/H2 abundance ratios, 5) more efficient excitation of 13CO molecules toward upper levels (e.g., ) with respect to 12CO ones, or 6) large 12CO/13CO abundance ratios. The first four mechanisms lead to lower opacity of the CO lines. The first mechanism also introduces non-LTE excitation, resulting in high values. Since it is known that the luminous starburst mergers have a huge amount of dense gas (; Solomon et al. 1992; Scoville, Yun, & Bryant 1997), the first idea (lower gas densities) seems to be unlikely. Starburst galaxies often have both high gas kinetic temperatures and particularly large velocity gradients (Turner, Martin, & Ho 1990; Aalto et al. 1991, 1995; Devereux et al. 1994). However, if these mechanisms were responsible for the higher values, we would find a 12CO excess with respect to 13CO. Therefore the second and third idea are also ruled out. The smaller CO/H2 abundance ratio (i.e., lower metallicity) seems also to be unlikely for the luminous starburst mergers because the enhanced star-formation activity occurs in their nuclear regions where metal abundances are generally high (e.g., Storchi-Bergmann et al. 1996). It is known that 12CO(=3–2)/12CO(=1–0) ratios of starburst galaxies are often found to be higher than in normal galaxies (e.g., Devereux et al. 1994 and references therein). If 13CO molecules in starburst mergers were excited more efficiently toward upper levels with respect to 12CO, we would observe high- values in higher rotational transitions. However, there is no such evidence (Taniguchi, Ohyama, & Sanders 1998). Therefore, the remaining possibility is that the 12CO/13CO abundance ratios are systematically higher than those in normal galaxies. According to our result (Fig. 3), this should be achieved by a 13CO underabundance with respect to 12CO in the starburst mergers.
We would like to thank Dave Sanders, Naomasa Nakai, Toshihiro Handa, Sumio Ishizuki, Naomi Hirano, and Satoki Matsushita for useful comments. We would also like to thank the referee, Christian Henkel, for his many useful comments and suggestions which improved this paper significantly. Y.O. was supported by the Grant-in-Aid for JSPS Fellows by the Ministry of Education, Science, Sports and Culture. This work was supported in part by the Ministry of Education, Science, Sports and Culture in Japan under Grant Nos. 07055044, 10044052, and 10304013.
References
- (1) Aalto, S., Black, J. H., Johansson, L. E. B., & Booth, R. S. 1991, A&A, 249, 323
- (2) Aalto, S., Booth, R. S., Black, J. H., & Johansson, L. E. B. 1995, A&A, 300, 369
- (3) Aalto, S., Radford, S. J. E., Scoville, N. Z., & Sargent, A. I. 1997, ApJ, 475, L107
- (4) Becker, R., & Freudling, W. 1991, A&A, 251, 454
- (5) Casoli, F., Dupraz, C., & Combes, F. 1992a, A&A, 264, 49
- (6) Casoli, F., Dupraz, C., & Combes, F. 1992b, A&A, 264, 55
- (7) Casoli, F., Dupraz, C., Combes, F., & Kazès, I. 1991, A&A, 251, 1
- (8) de Vaucouleurs, G., de Vaucouleurs, A., Corwin, H. G. Jr., Buta, R. J., Paturel, G., & Fouqué, P. 1991, Third Reference Catalogue of Bright Galaxies (Springer-Verlag)
- (9) Devereux, N., Taniguchi, Y., Sanders, D. B., Nakai, N., & Young, J. S. 1994, AJ, 107, 2006
- (10) Freeman, K. C., Karlsson, B., Lynga, G., Burrell, J. F., van Woerden, H., & Goss, R. 1977, A&A, 55, 445
- (11) Garay, G., Mardones, D., & Mirabel, I. F. 1993, A&A, 277, 405
- (12) Helou, G. I., Soifer, B. T., & Rowan-Robinson, M. 1985, ApJ, 298, L7
- (13) Henkel, C., Chin, Y.-N., Mauersberger, R., & Whiteoak, J. B. 1998, A&A, 329, 443
- (14) Henkel, C., & Mauersberger, R. 1993, A&A, 274, 730
- (15) Henkel, C., Whiteoak, J. B., & Mauersberger, R. 1994, A&A, 284, 17
- (16) Hurt, R. L., & Turner, J. L. 1991, ApJ, 377, 434
- (17) Lonsdale, C. J., Helou, G., Good, J. C., & Rice, W. 1989, Cataloged Galaxies and Quasars Observed in the IRAS Survey, Version 2, JPL D-1932 (Pasadena: JPL)
- (18) Moshir, M., et al. 1992, Explanatory Supplement to the IRAS Faint Source Survey, Version 2, JPL-D-10015 8/92 (Pasadena: JPL)
- (19) Rice, W., Lonsdale, C. J., Soifer, B. T., Neugebauer, G., Kopan, E. L., Lloyd, L. A., de Jong, T., & Habing, H. J. 1988, ApJS, 68, 91
- (20) Sage, L. J., & Isbell, D. W. 1991, A&A, 247, 320
- (21) Sakamoto, S., Handa, T., Sofue, Y., Honma, M., & Sorai, K. 1997, ApJ, 475, 134
- (22) Sanders, D. B., Egami, E., Lipari, S., Mirabel, I. F., & Soifer, B. T. 1995, AJ, 110, 1993
- (23) Scoville, N. Z., Yun, M. S., & Bryant, P. M. 1997, ApJ, 484, 702
- (24) Solomon, P. M., Downes, D., & Radford, S. J. E. 1992, ApJ, 387, L55
- (25) Storchi-Bergmann, T., Rodriguez-Ardila, A., Schmitt, H. R., Wilson, A. S., & Baldwin, J. A. 1996, ApJ, 472, 83
- (26) Strauss, M. A., Huchra, J. P., Davis, M., Yahil, A., Fisher, K. B., & Tonry, J. 1992, ApJS, 83, 29
- (27) Taniguchi, Y., Ohyama, Y., & Sanders, D. B. 1998, in preparation
- (28) Tully, R. B. 1988, Nearby Galaxies Catalog (Cambridge University Press)
- (29) Turner, J. L., & Hurt, R. L. 1992, ApJ, 384, 72
- (30) Turner, J. L., Martin, R. N., & Ho, P. T. P. 1990, ApJ, 351, 418
- (31) Wiklind, T., & Henkel, C. 1990, A&A, 227, 394
- (32) Young, J. S., & Scoville, N. Z. 1991, ARA&A, 29, 581
| Name | (12CO) | (13CO) | (FIR) | Ref.aa1: Becker & Freudling (1991), 2: Aalto et al. (1995), 3: Sage & Isbell (1991), 4: Wiklind & Henkel (1990), 5: Aalto et al. (1991), 6: Casoli et al. (1992b), 7: Garay et al. (1993), 8: Henkel et al. (1994) | |||
|---|---|---|---|---|---|---|---|
| (Mpc) | / | (K km s-1 pc2) | (K km s-1 pc2) | () | |||
| N55 | 1 | 0.023 | 5.51 | 4.33 | 15.4 | 8.03 | 1 |
| N134 | 19 | 0.084 | 8.29 | 7.14 | 14.0 | 10.16 | 2 |
| N253 | 3 | 0.034 | 8.26 | 7.04 | 16.6 | 10.03 | 3 |
| N404 | 2 | 0.106 | 5.75 | 4.79 | 9.1 | 7.33 | 4 |
| N520 | 28 | 0.123 | 8.76 | 7.71 | 11.0 | 10.58 | 5 |
| N628 | 10 | 0.091 | 7.57 | 6.75 | 6.6 | 9.64bbRice et al. (1988) | 3 |
| N660 | 12 | 0.066 | 8.58 | 7.43 | 14.1 | 10.17 | 5 |
| N828 | 73ccEstimated using a Hubble constant = 75 km s-1 Mpc-1 with given in de Vaucouleurs et al. (1991). | 0.191 | 9.73 | 8.70 | 10.7 | 11.03 | 5 |
| 0.127 | 9.61 | 8.44 | 14.9 | 6 | |||
| N891 | 10 | 0.070 | 8.40 | 7.48 | 8.4 | 9.90 | 3 |
| N986 | 23 | 0.184 | 8.75 | 7.74 | 10.2 | 10.35 | 5 |
| N1058 | 9 | 0.315 | 7.13 | 6.07 | 11.5 | 8.70 | 3 |
| N1614 | 62ccEstimated using a Hubble constant = 75 km s-1 Mpc-1 with given in de Vaucouleurs et al. (1991). | 0.544 | 9.11 | 7.67 | 27.4 | 11.25 | 5 |
| N1808 | 11 | 0.111 | 8.46 | 7.25 | 16.5 | 10.22 | 5 |
| N2146 | 17 | 0.091 | 8.82 | 7.74 | 12.0 | 10.78 | 5 |
| N2276 | 37 | 0.195 | 8.66 | 7.75 | 8.0 | 10.50 | 2 |
| N2369 | 44ccEstimated using a Hubble constant = 75 km s-1 Mpc-1 with given in de Vaucouleurs et al. (1991). | 0.202 | 9.39 | 8.22 | 15.0 | 10.82 | 2 |
| 0.211 | 9.33 | 8.28 | 11.3 | 7 | |||
| N2903 | 6 | 0.075 | 7.79 | 6.81 | 9.5 | 9.48 | 3 |
| N3034 | 5 | 0.085 | 8.67 | 7.47 | 15.9 | 10.62 | 3 |
| N3079 | 20 | 0.069 | 8.94 | 7.91 | 10.8 | 10.52 | 5 |
| N3256 | 37 | 0.189 | 9.57 | 8.01 | 35.6 | 11.28 | 5 |
| 0.193 | 9.54 | 8.07 | 29.2 | 1 | |||
| 0.096 | 8.95 | 7.40 | 35.5 | 6 | |||
| 0.197 | 9.53 | 8.12 | 25.9 | 7 | |||
| N3627 | 7 | 0.104 | 7.94 | 6.77 | 14.8 | 9.57 | 3 |
| N3628 | 8 | 0.064 | 8.34 | 7.32 | 10.5 | 9.73 | 3 |
| N4038/9 | 25 | 0.086ddSum of of both N4038 and N4039 is used. | 8.94 | 7.82 | 13.3 | 10.64 | 5 |
| N4194 | 39 | 0.201 | 8.83 | 7.09 | 54.4 | 10.69 | 6 |
| N4414 | 10 | 0.262 | 8.27 | 7.47 | 6.3 | 9.70 | 3 |
| N4736 | 4 | 0.085 | 7.29 | 6.37 | 8.3 | 9.33bbRice et al. (1988) | 3 |
| N4826 | 4 | 0.055 | 7.22 | 6.51 | 5.1 | 9.03 | 5 |
| 0.095 | 7.50 | 6.77 | 5.3 | 3 | |||
| N4945 | 5 | 0.036 | 8.61 | 7.45 | 14.4 | 10.22 | 8 |
| 0.036 | 8.63 | 7.45 | 15.1 | 5 | |||
| N5033 | 19 | 0.051 | 8.27 | 7.32 | 8.9 | 10.04 | 5 |
| N5055 | 7 | 0.044 | 7.65 | 6.86 | 6.2 | 9.57 | 5 |
| N5218 | 39ccEstimated using a Hubble constant = 75 km s-1 Mpc-1 with given in de Vaucouleurs et al. (1991). | 0.302 | 9.13 | 8.16 | 9.3 | 10.28 | 5 |
| N5457 | 5 | 0.074 | 8.53eeData in all regions (nuclus and four disk regions) are taken togegher (see Sage & Isbell 1991). | 7.69eeData in all regions (nuclus and four disk regions) are taken togegher (see Sage & Isbell 1991). | 6.9eeData in all regions (nuclus and four disk regions) are taken togegher (see Sage & Isbell 1991). | 9.74bbRice et al. (1988) | 3 |
| N6215 | 21 | 0.335 | 8.21 | 7.13 | 12.1 | 10.33ffSanders et al. (1995) | 2 |
| N6221 | 19 | 0.202 | 8.60 | 7.35 | 18.0 | 10.49ffSanders et al. (1995) | 2 |
| N6240 | 98ccEstimated using a Hubble constant = 75 km s-1 Mpc-1 with given in de Vaucouleurs et al. (1991). | 0.172 | 9.72 | 8.08 | 43.6 | 11.52 | 6 |
| N6503 | 6 | 0.134 | 7.23 | 6.11 | 13.2 | 8.82 | 3 |
| N6810 | 25 | 0.227 | 8.61 | 7.65 | 9.0 | 10.31 | 2 |
| N6946 | 6 | 0.083 | 8.16 | 7.12 | 11.1 | 9.55 | 3 |
| N7130 | 65ccEstimated using a Hubble constant = 75 km s-1 Mpc-1 with given in de Vaucouleurs et al. (1991). | 0.473 | 9.21 | 8.31 | 8.0 | 11.05 | 5 |
| N7552 | 20 | 0.212 | 8.72 | 7.56 | 14.2 | 10.63 | 2 |
| N7582 | 18 | 0.143 | 8.50 | 7.28 | 16.7 | 10.39 | 2 |
| IC342 | 4 | 0.044 | 7.81 | 6.76 | 11.1 | 9.32 | 3 |
| IC2554 | 17 | 1.136 | 8.09 | 6.97 | 13.0 | 9.95ffSanders et al. (1995) | 2 |
| U2855 | 20 | 0.126 | 8.52 | 7.44 | 11.9 | 10.40 | 2 |
| Circinus | 4ggFreeman et al. (1977) | 0.104 | 7.85 | 6.83 | 10.5 | 9.78hhLonsdale et al. (1989) | 5 |
| Maffei2 | 3 | 0.950 | 7.64 | 6.68 | 9.0 | 9.33hhLonsdale et al. (1989) | 3 |
| Arp220 | 74ccEstimated using a Hubble constant = 75 km s-1 Mpc-1 with given in de Vaucouleurs et al. (1991). | 0.363 | 9.58 | 8.34 | 17.3 | 11.91 | 5 |
| 0.242 | 9.72 | 8.39 | 21.8 | 6 | |||
| Arp299 | 42ccEstimated using a Hubble constant = 75 km s-1 Mpc-1 with given in de Vaucouleurs et al. (1991). | 0.468 | 9.09 | 7.80 | 19.8 | 11.41 | 5 |
| 0.312 | 8.99 | 7.68 | 20.7 | 6 | |||
| IRAS18293iiIRAS18293 = IRAS 18293-3413 and IRAS22132 = IRAS 22132-3705 | 73jjStrauss et al. (1992) | 2.389kkOptical diameter is taken from NED. | 9.79 | 8.56 | 16.8 | 11.46 | 2 |
| 2.500kkOptical diameter is taken from NED. | 9.86 | 8.44 | 25.9 | 7 | |||
| IRAS22132iiIRAS18293 = IRAS 18293-3413 and IRAS22132 = IRAS 22132-3705 | 46ccEstimated using a Hubble constant = 75 km s-1 Mpc-1 with given in de Vaucouleurs et al. (1991). | 0.320 | 9.07 | 8.12 | 8.9 | 10.84 | 7 |
| ESO541-IG23 | 81ccEstimated using a Hubble constant = 75 km s-1 Mpc-1 with given in de Vaucouleurs et al. (1991). | 1.604 | 9.59 | 8.36 | 17.0 | 11.36 | 2 |