On the Origins of Starburst and Post-Starburst Galaxies in Nearby Clusters11affiliation: Based on observations with the NASA/ESA Hubble Space Telescope obtained at the Space Telescope Science Institute, which is operated by AURA, Inc., under NASA contract NAS 5-26555.
Abstract
HST WFPC2 images in B (F450W) and I (F814W) have been obtained for three starburst (SB) and two post-starburst (PSB) galaxies in the Coma cluster, and for three such galaxies in the cluster DC2048-52. V (F555W) and I images for an additional PSB galaxy in Coma have been extracted from the HST archive. Seven of these galaxies were previously classified as E/S0 on the basis of ground-based images, one as Sa, and the other as an irregular.
The HST images reveal these SB/PSB galaxies to be heterogeneous in morphology. Nevertheless a common theme is that many of them, especially the SB galaxies, tend to have centralized spiral structure that appears simply as a bright “bulge”on ground-based images. In addition, while some PSB galaxies exhibit distinct spiral structure, on the whole they have smoother morphologies than the SB galaxies. The morphologies and luminosity profiles are generally consistent with substantial starbursts in the form of centralized spiral structure (the SB galaxies) which fade into smoother morphologies (the PSB galaxies), with lingering spectroscopic evidence for past central starbursts. An important point is that the PSB galaxies retain disks, i.e, they have not evolved into spheroidal systems.
While the morphologies revealed in the HST images are heterogeneous, and thus may not fit well into a single picture, we see evidence in several cases that the morphologies and centralized star formation have been driven by external tidal perturbations. We discuss several physical mechanisms for inducing star formation in cluster galaxies with a view towards explaining the particular morphologies seen in the HST images.
1 Introduction
Numerous studies have convincingly established that at z0.3 rich clusters of galaxies have a higher fraction of photometrically blue galaxies than is found in present-epoch clusters of similar richness (e.g., Butcher & Oemler 1978, 1984; Couch & Newell 1984; MacClaren et al. 1988; Dressler & Gunn 1992; Rakos & Schombert 1995; Belloni et al. 1995). In addition, follow-up spectroscopy (e.g., Dressler & Gunn 1982, 1983, 1992; Lavery & Henry 1986; Henry & Lavery 1987; Couch & Sharples 1987; Soucail et al. 1988; Pickles & van der Kruit 1991) has revealed that many galaxies in distant clusters exhibit strong emission lines, indicating either ongoing star formation or starburst (SB) activity, while others show strong Balmer absorption lines with little or no emission, indicating either recently truncated star formation or poststarburst (PSB) activity. The fraction of the strong Balmer line galaxies which have experienced a major starburst as opposed to sudden truncation of star formation is a matter of current debate (cf. Barger et al. 1996; Balogh et al. 1997; Morris et al. 1998). Recently, morphological studies carried out with the Hubble Space Telescope have shown that a larger fraction of the star forming galaxies are classified as spiral, irregular, or interactions/mergers than in nearby clusters (Dressler et al. 1994a,1994b; Couch et al. 1994; Wirth et al. 1994; Couch et al. 1998), a result that confirms the ground-based imaging studies of Thompson (1988), Lavery & Henry (1988), and Lavery et al. (1992).
As mentioned above, at z=0 there are relatively few blue galaxies in rich clusters, i.e., with B-V0.2 mags bluer than the c-m sequence of the red galaxies in the cluster (e.g., Bower et al. 1992). Furthermore, in present-epoch clusters only a small fraction of galaxies are classified as spirals, at least within the morphological framework that has been developed from mostly isolated nearby spirals. In fact, even those cluster galaxies classified as spirals are usually found to be depleted in HI content (e.g., Haynes et al. 1984 and references therein; Giovanelli & Haynes 1985; Gavazzi 1989). Nevertheless, recent work has indicated that the differences in evolutionary processes between nearby and distant rich clusters may not be as extreme as previously considered. Moss & Whittle (1993) and Moss et al. (1995) found that a higher fraction of spirals in nearby clusters that are morphologically classified as early type spirals show elevated, and centrally concentrated, star formation levels than in a field sample. Gavazzi et al. (1995) also found evidence for elevated star formation rates in cluster spirals. In addition, Caldwell et al (1993, 1996) and Caldwell & Rose (1997, 1998) have shown that a substantial fraction of early-type galaxies (i.e., those morphologically classified as E or S0) in nearby rich clusters show signs of PSB or SB activity. Finally, Koopmann & Kenney (1998) have pointed out that in general spiral galaxies in clusters do not fit consistently within the morphological framework of isolated spirals. Specifically, many cluster spirals with low disk star formation rates that would indicate early-type spiral morphologies in fact have concentrations of light typical of late type spirals. Thus there may exist many late type spirals in clusters at low redshift which have such suppressed star formation rates in their disks (due to the gas depletion processes present in rich clusters), that they are lumped together with early type spirals.
In short, a perhaps more accurate picture of nearby clusters is that environmentally driven evolutionary processes in galaxies are still ongoing. These environmental processes may be qualitatively similar to those observed in distant clusters, although they are occurring at a reduced level in intensity and frequency. The reduced intensity in nearby clusters may be due in part to the depletion in HI reservoir in the general galaxy population since z=0.3, due to star formation or other removal processes. More generally, the reduction in intensity and frequency has been discussed within the context of a hierarchical clustering scenario for structure formation by Bower (1991) and Kauffmann (1995).
Given that evolutionary processes in cluster galaxies, perhaps similar in nature to those occurring in distant clusters, are indeed ongoing at the present epoch, then the proximity of nearby rich clusters, such as Coma, provides an excellent prospect for studying these processes in detail. In particular, the star formation bursts can be studied at high enough spatial resolution that their cause(s) might be revealed. For example, how centrally concentrated are the starbursts? Are there any young star clusters, such as are found in merging galaxies (e.g., NGC 1275, Holtzmann et al. 1992; NGC 7252, Miller et al. 1997). Are there morphological peculiarities associated with the starbursts that can be unambiguously linked to tidal disturbances or other external triggering mechanisms? And what are the morphological differences between SB and PSB galaxies? To that end, we have otained WFPC2 images with the Hubble Space Telescope (HST) of a number of SB and PSB galaxies in the Coma and DC2048-52 nearby rich clusters. The morphological characteristics of these galaxies, as revealed by WFPC2 imaging, forms the subject of this paper. The characteristics of the HST images are described in §2. In §3 the morphologies and inner luminosity and color profiles of the Coma and DC2048-52 SB/PSB galaxies are presented. In §4 we discuss which mechanism can best account for the SB/PSB activity and morphological disturbances revealed by the HST images.
2 Observational Data
Before describing the HST WFPC2 images, we briefly summarize how our sample of nine galaxies was selected. We originally obtained multi-fiber spectroscopy for many galaxies in Coma and DC2048-52 (and in three other clusters) which we believed to be early-type based on morphologies from ground-based images and/or colors (Caldwell et al. 1993; Caldwell & Rose 1997). For a substantial fraction (typically 15%) of these galaxies the spectra indicate either current or recent star formation. The nine galaxies chosen were then selected from among those with spectroscopic evidence for unusual star formation histories. Furthermore, they were chosen to cover a representative range of current and past star formation. Finally, while in Coma the SB/PSB galaxies are primarily located in the SW region of the cluster, in the case of DC2048-52 they are much more uniformly spread over the main cluster and the northern subcluster.
WFPC2 images were obtained in the B (F450W filter) and I (F814W filter) passbands with HST during Cycle 6 for four fields in the Coma cluster and three fields in DC2048-52. In each case a SB or PSB galaxy was centered in the PC frame, except in the case of one field in Coma, where both the PSB galaxy Dressler 99 and the SB galaxy Dressler 100 were included on a single PC frame. Two 600 second exposures were obtained for each galaxy in the F450W filter, and two 400 second exposures in the F814W filter. The images were processed using the standard HST pipeline routines. To remove cosmic rays, the pairs of exposures were coadded using the ‘gcombine’ routine in IRAF/STSDAS with the ‘crreject’ option. In addition, images of the PSB galaxy Dressler 216 in Coma were extracted from the HST archive. In this case, the galaxy is located on one of the WF chips, and the passbands are V (F555W) and I (F814). There are seven 900 second exposures in V and eight 900 second exposures in I. The same processing steps were used for these images.
Radial light profiles in both colors were extracted for these galaxies using a program that fits elliptical isophotes (Caldwell & Rose 1997). The elliptical isophotes were found on the I filter image; intensity data falling on these ellipses were then collected from the bluer image (B or V), after adjusting for a change in center. Calibrations for the F450W, F555W, and F814W frames were those provided in Holtzmann et al. (1995). Error estimates in the surface brightnesses, magnitudes, and colors were calculated from the photon statistics, the readout noise, and the error in determining the mean sky. Color profiles were found by subtracting the surface brightness profiles of the two filters. No attempt at matching the point-spread functions of the two filters was made. The mean color quoted in Table On the Origins of Starburst and Post-Starburst Galaxies in Nearby Clusters11affiliation: Based on observations with the NASA/ESA Hubble Space Telescope obtained at the Space Telescope Science Institute, which is operated by AURA, Inc., under NASA contract NAS 5-26555. refers to the integrated color within the radius where the I surface brightness falls to 23 mag arcsec-2. For reference, normal luminous elliptical galaxies have B-I2.3.
In addition to the HST images, ground-based images for eight of the nine galaxies have been obtained, either with the 1.2-m telescope of the F. L. Whipple Observatory for the Coma galaxies or with the CTIO 0.9-m telescope for the DC2048-52 galaxies. The characteristics of these ground-based images are given in Caldwell et al. (1993) and Caldwell & Rose (1997).
The HST and ground-based images are displayed in Figs. 1, 2, and 3. In Fig. 1 we have assembled those galaxies with clear signs of active star formation, while galaxies with relatively smooth morphologies, i.e., little or no sign of ongoing star formation, are shown in Fig. 2. Galaxies which appear to be weak late-type spirals are shown in Fig. 3. Each row in these Figures shows the HST images at low and high contrast in the first two panels, followed by the ground-based image in the third panel.
As mentioned earlier, the SB or PSB nature of the nine galaxies was originally determined from multi-fiber spectroscopy with either the Hydra spectrograph on the KPNO 4-m (for Coma) or the Argus spectrograph on the CTIO 4-m (for DC2048-52). The one exception is Dressler 61 in Coma, for which the PSB nature was determined from a spectrum obtained with the MMT. All of these observations are described in Caldwell et al. (1993) and Caldwell & Rose (1997). In addition, the SB or PSB nature was shown to be centrally concentrated, although spatially extended, from follow-up long-slit spectroscopy of Coma galaxies described in Caldwell & Rose (1996). For D61 in Coma, an additional spectrum was obtained with the 1.5-m telescope of the F. L. Whipple Observatory and FAST spectograph (Fabricant et al. 1998) at 1.5 Å/pixel and covering the wavelength region 3635-7585 Å. These spectroscopic observations are referred to in §3 below, where the properties of the nine SB/PSB galaxies are summarized.
3 Morphologies and Luminosity Profiles of Starburst and Poststarburst Galaxies
The morphologies and luminosity profiles of the SB and PSB galaxies for which we have HST images are quite diverse. As a result, we begin with an individual discussion of each galaxy, and in §4 draw general conclusions about the starburst nature of these galaxies. For convenience of organization, we begin with the SB galaxies of Fig. 1, then proceed to the PSB galaxies of Fig. 2, and finish with the weak late-type spirals of Fig. 3. The basic parameters for each galaxy discussed below are summarized in Table On the Origins of Starburst and Post-Starburst Galaxies in Nearby Clusters11affiliation: Based on observations with the NASA/ESA Hubble Space Telescope obtained at the Space Telescope Science Institute, which is operated by AURA, Inc., under NASA contract NAS 5-26555.. For the purposes of the following discussion, it may be useful to know that in Coma, which we assume to be 100 Mpc distant (corresponding to H∘= 70 km s-1 Mpc-1, and farther than the 86 Mpc we assumed in previous papers), 1˝ = 490 pc, and for DC2048-52 (at 200 Mpc), 1˝ = 980 pc. Hence the multi-fiber spectra, which cover 3˝ in diameter on the Coma cluster galaxies and 2˝ diameter on the galaxies in DC2048-52, provide integrated spectra of typically the central 2-3 kpc in diameter of these galaxies.
3.1 Starburst Galaxies
D15 in Coma:
The spectrum of Dressler 15 in Coma (hereafter referred to as Coma-D15)
reported in
Caldwell et al. (1993) and Caldwell et al. (1996) reveals strong emission lines
that are a mixture of an HII region spectrum and an AGN spectrum. The
emission is very centrally concentrated, but spatially resolved out to
about 2˝, and has a velocity
gradient with a full amplitude of 100 km s-1 . Thus
Coma-D15 is currently undergoing a central starburst and also harbors an AGN.
A nearby apparent “companion” galaxy is in fact a
background galaxy with redshift of z=0.127.
On the basis of ground-based images, Coma-D15 has been classified as an S0 galaxy (Dressler 1980, Caldwell et al. 1993, Andreon et al. 1996). The WFPC2 images in Fig. 1, however, reveal that the central bright “bulge” is resolved into a spiral disk, where the distance from the nucleus to the inner bright spiral arms is 1.5˝, or 0.75 kpc. The spirality extends to only 3˝ (1.5 kpc), which explains why it was missed on the ground-based images. This bright inner spiral structure is similar to that seen with HST of some other S0 galaxies, e.g. NGC 524 and NGC 3599 (Lauer et al. 1995), though the spiral in Coma-D15 is stronger, and better resembles that seen in the merger product galaxy NGC 7252 (Whitmore et al. 1993). In fact, the radial extent of the spiral arms in both galaxies is very similar ( kpc). There are however no large tidal tails in Coma-D15, as are seen in NGC 7252, nor is there a companion galaxy evident.
The radial luminosity profile of Coma-D15 is shown in Fig. 4. where the luminosity profiles in B and I are plotted versus radius () and . The B-I color profile is also plotted. The thin solid lines represent 1 errors for the B light and color profiles. An additional systematic error from the calibration may be present at the level of 5%, which has no effect on our results. The radial luminosity profile shows a strongly peaked light distribution inside the central 1˝ in radius, then a bright “bump” in the profile caused by the spiral arms, and then a basically exponential disk beyond a radius of 2˝. The radial color profile reveals a blue nucleus surrounded by a substantially redder (by 0.4 mag in B-I) disk, which then gives way to the blue spiral arms at 1.5˝.
D100 in Coma:
Dressler 100 in Coma (hereafter Coma-D100) is an apparent nearby companion to
Coma-D99 which has been classified as an irregular and an SBa from ground-based images
(Dressler 1980, Andreon et al. 1996, respectively).
Although Coma-D99 and Coma-D100 are projected to be only 17˝ (8.5 kpc) apart, they
have a large velocity difference of 4700 km s-1 . Thus, even if they are indeed
experiencing a close passage, they cannot be a strongly
interacting pair in the traditional sense of low encounter velocity
interacting/merging galaxies. The long-slit spectrum of Coma-D99 from
Caldwell et al. (1996) was oriented at a position angle of 121∘ E of N, in
order to pass through the center of Coma-D100 as well. This spectrum reveals
that Coma-D100 has an active star formation spectrum in the central
2˝ (1 kpc) in radius, i.e., [OIII]5007 and H
emission can be seen out to this radius; strong underlying Balmer absorption
can also be seen in
the higher order Balmer lines. At 3˝ radius, the spectrum is
characteristic of a PSB state, i.e., no emission is detected but strong Balmer
absorption lines are clearly evident.
We have applied the Ca II H + H versus H/Fe I age dating
technique that was developed in Leonardi & Rose (1996) and applied to other
Coma cluster PSB galaxies in Caldwell et al. (1996) and Caldwell & Rose (1998).
This technique, which decouples the mostly degenerate effects of PSB age from
burst strength (for a fading burst superposed on an underlying “old”
galaxy), relies on the high sensitivity of the relative strength of H
versus the Ca II H and K lines to the contribution from A stars.
Using this age dating method,
we find that the age of the outer PSB region of Coma-D100, summed
over both sides of the slit, is 0.25 Gyr post starburst (see Fig. 5).
Thus, while
star formation is still proceeding vigorously in the central 1 kpc of
Coma-D100, it has already subsided at a radius of 1.5 kpc. Such
is seen in other nearby SB galaxies such as NGC5253 (Caldwell & Phillips
1989).
Our WFPC2 images certainly support an unusual morphology for Coma-D100 (see
Fig. 1). A strong two-armed spiral pattern is visible as well as
highly
visible dust lanes. A bright nucleus is partially obscured by heavy dust
in the central 0.5˝ in radius. The two-armed spiral pattern is
visible out to 3˝ (1.5 kpc) in radius. A set of parallel dust lanes
project out on the east side of Coma-D100, extending out to 3.4˝.
Dust predominates on the west side in the central 0.5˝ in radius, but
is more prominent on the east side at larger radii. The dust shows up
prominently in
the color profiles, causing a redder color around 1-1.5˝ than the colors
inward and outward of that location.
Finally, from an MMT long-slit spectrum we measured a velocity difference of only 14 km s-1 between the NW and SE side of the slit at a distance of 3˝ from the nucleus, which is within the measurement errors of 20 km s-1 . Thus we can conclude that there is little rotation at the 121∘ position angle. This is smaller than we would expect to see for a disk galaxy measured 63∘ away from the galaxy’s major axis, though we hestitate to call it unusual.
D45 in Coma:
Dressler 45 in Coma (hereafter Coma-D45) was originally determined to be a
starburst galaxy in Caldwell et al. (1993), because of
its strong emission lines characteristic of an HII region spectrum as well as
enhanced Balmer absorption that is evident in the higher order Balmer lines.
The kinematics of the ionized gas was studied in Caldwell et al. (1996), where
an asymmetric rotation curve was discovered from long-slit MMT spectra at
four position angles. Coma-D45 was classified as Sa from ground-based images,
and an R band image presented in Caldwell et al. (1996) tended to confirm that
morphology, while revealing an asymmetric structure to the outer isophotes.
We must correct an error in the color reported in Caldwell et al. (1993).
The B-R color of Coma-D45 from the GMP paper was thought to be quite red,
unusual for an Sa galaxy (Figure 12 in Caldwell et al.
1993). A coding error was the cause of this statement: in fact GMP did not
report a color for Coma-D45. A similar problem occured for Coma-D15; there were
no
other such errors. The colors for both Coma-D45 and Coma-D15 are bluer than
previously reported, substantially so in the former case, as can be surmised
from
Table On the Origins of Starburst and Post-Starburst Galaxies in Nearby
Clusters11affiliation: Based on observations with the NASA/ESA Hubble Space
Telescope obtained at the Space Telescope Science Institute, which is
operated by AURA, Inc., under NASA contract NAS 5-26555..
The WFPC2 images of Coma-D45 reveal that the central “bulge” of this galaxy is actually a highly irregular structure, with several bright knots (presumably HII regions) forming a partial ring with a diameter of 1˝, or about 0.5 kpc. As can be seen in Fig. 1, the structure of Coma-D45 is irregular on all scales, including the fainter isophotes mentioned above in the ground-based images. The radial luminosity profile (Fig. 4) shows two exponentials of different scale lengths, with the break occurring at 2-3˝. The highly irregular morphology of Coma-D45 revealed in the WFPC2 images may clarify some of the asymmetric nature of the rotation curve reported in Caldwell et al. (1996), in that the kinematic center of the galaxy may be well displaced from the emission line peak intensity. In that case, the rotation curve can be seen as reasonably symmetric around a displaced center within the central 2˝ in radius. Outside of that radius, however, the gas appears to be counter-rotating.
3.2 Poststarburst Galaxies
D99 in Coma:
High S/N MMT spectroscopy of Dressler 99 in Coma (hereafter Coma-D99) shows
that it is a PSB
galaxy seen 1.0 Gyr after the starburst. The long-slit MMT
spectra showed
that the strong Balmer absorption lines are confined to the inner 1˝ in
radius. On ground-based images the galaxy has been classified as S0 or E/S0.
(Dressler 1980, Caldwell et al. 1993).
The WFPC2 images (see Fig. 2 for the poststarburst galaxies) show a smooth light distribution, with no indications of spiral structure. The bright nuclear “bulge”, which is 0.5˝, or 0.25 kpc, in radius, is surrounded by what appears to be a smooth lower surface brightness envelope. The radial luminosity profile (Fig. 6) confirms the bulge/disk character of the galaxy. The radial color profile reveals the central area (but outside of 0.2″) to be 0.3-0.5 mag bluer in B-I than the surrounding disk, thus confirming the earlier conclusions from ground-based imaging and spectroscopy that the starburst was highly concentrated in the center of Coma-D99. The inner few pixels (0.2˝) of the B image show some structure that may indicate the presence of an off-nuclear star cluster (this feature appears on both B images, and thus is not an artifact). Interestingly, the I image shows a more peaked nucleus than the B image, which is unresolved in a deconvolved image. A nuclear star cluster may be present, somewhat reddened, for the color of the nucleus alone (within 0.1˝) is B-I=1.6, substantially redder than the surrounding area.
Interestingly, the central surface brightness of Coma-D99 is quite low, at around B=18.3 mag arcsec-2, or an estimated V=17.6 mag arcsec-2. The expected value for a moderate luminosity E/S0 like Coma-D99 is much higher, around V=15 (as is found for an archival sample of E/S0’s observed with HST). Only high luminosity galaxies such as NGC 4889 tend to have similar central surface brightnesses. The fact that a nucleus shows up only in the I band may indicate that reddening is partly responsible for the low observed central B surface brightness, though high reddening is not indicated by the overall blue color of the central regions. The low observed central surface brightness must for the most part be real, and may be a clue to the mechanism for the starburst in this galaxy.
D216 in DC2048-52:
On the basis of ground-based images, Dressler 216 in DC2048 (hereafter
DC2048-D216) is classified as an S0. It was classified as PSB by Caldwell &
Rose (1997) on the basis of strong Balmer absorption lines and only a small
and uncertain amount of [OII]3727 emission. The WFPC2 images reveal
a very smooth and mostly symmetric morphology (see Fig. 2). The only
asymmetric structure is a slightly curved barlike (i.e., integral sign)
structure that starts outside the bright nucleus and can be traced out to
1.2˝ in radius (1.2 kpc). Beyond 1.2˝ in radius, the morphology
is smooth with no asymmetry.
The radial luminosity profile (Fig. 6) is that of a disk galaxy
with a bulge within 1″.
The color profile indicates that the
disk becomes slightly bluer towards the center, while the bulge may be yet
bluer, though the different resolutions in the B and I frames may be affecting
the color profile there.
There is a companion spiral to this galaxy, not shown in the figure, located about 11˝ away, but for which we have no redshift. This galaxy is normal in appearance, without any signs of tidal interactions, so we may presume it did not interact with DC2048-D216 and cause the latter’s starburst.
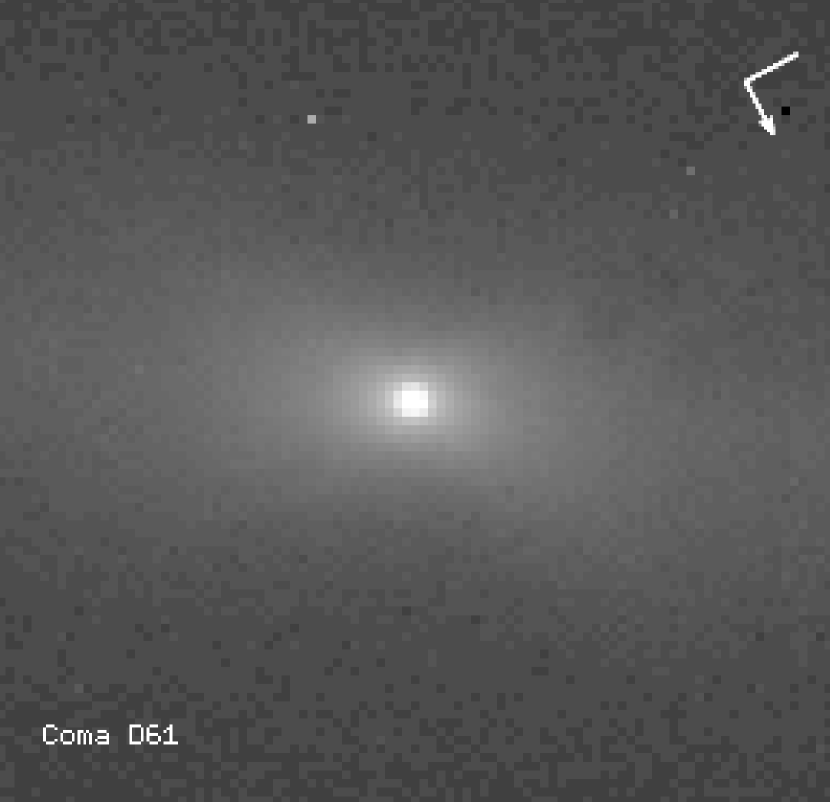
D61 in Coma:
High S/N spectroscopy of Dressler 61 in Coma (hereafter Coma-D61) with the MMT
reveals a very strong PSB spectrum, which is extended in radius out to at
least 3˝, and which has a small (4 Å equivalent width)
component of
[OII]3727 emission. From an integrated spectrum obtained with the
1.5-m telescope at Mt. Hopkins over the central 36˝ in diameter, and
covering H and [NII]6548,6584, we found that the
equivalent width of the combined [NII]6548 and 6584
emission is 7.5 Å. H absorption is seen to be exactly balanced
by emission. From the equivalent widths of the higher order Balmer absorption
lines (which are relatively free of emission) we estimate that the underlying
H absorption is 5 Å. Thus the ratio of [NII] to H
emission is slightly greater than 1, which is typical of LINER emission line
spectra, and definitely in excess of even the most metal-rich HII regions
(e.g., Baldwin et al. 1981; Veilleux & Osterbrock 1987).
Thus the weak emission spectrum is due to nuclear activity, and not to a
small rate of residual star formation, which strengthens the case that Coma-D61
is indeed a PSB galaxy.
Using the previously mentioned Leonardi & Rose (1996)
age dating technique, we have determined the PSB age of Coma-D61
to be 0.5 Gyr,
as can be seen in Fig. 5. This is a considerably shorter PSB time
than the typically 1 Gyr for other PSB galaxies in Coma to which we have
applied this technique.
From ground-based imaging Coma-D61 has been classified as S0. The WFPC2 images (Fig. 2) reveal it as an edge-on disk galaxy with a very bright nucleus. Two radial dust lanes are apparent about 1˝ to the east of the center. Coma-D61 has an unusual bulge: it is boxy or peanut-shaped, and additionally has an X morphology that is either part of the box shape, or superposed on that. A popular parameter to characterize the degree of boxiness is the A4 parameter, the cos (4) deviation from a perfect ellipse, normalized to the semimajor axis and local intensity gradient. A4 is about -0.02 in the bulge area on Coma-D61.
After deconvolving the image using the Lucy-Richardson technique (Lucy 1974; Richardson 1972), it is apparent that the nucleus is unresolved (see Fig. 7), with the surface brightness steeply falling from B=12.8 mag arcsec-2 to 16.1 within 0.09˝. It is not clear how much the AGN continuum adds to the central luminosity, but if the light comes purely from a nuclear star cluster, its luminosity is M within 3 pixels (0.14˝ or 66 pc), which represents about 7% of the galaxy’s total light. This luminosity is higher than any of the star clusters formed in the merging galaxies studied by Whitmore et al. (1997), or by Carlson et al. (1998), and is also higher than the nuclear star clusters found in normal early-type galaxies by Lauer et al. (1995). The color of the nucleus is B-I=1.20, about 0.2 mag bluer than that of the surrounding bulge.
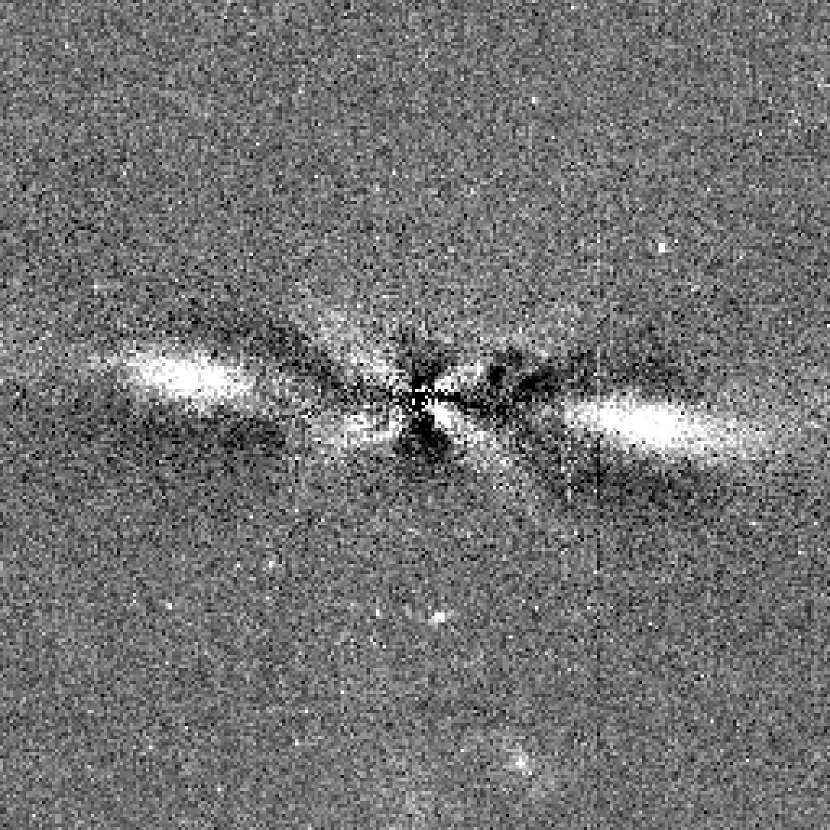
The X-shape is much more clearly seen in Fig. 8, where the overall axisymmetric component of the bulge light profile has been subtracted off, by fitting ellipses to the isophotes (the disk light was excluded from the fit). The X-shape can be traced out to at least 1.8˝ (0.9 kpc) outside the nucleus. The X is not affected by diffraction spikes from the bright nucleus because the opening angle of the X is 110o, not the 90expected from the orthogonal secondary support vanes. Moreover, the X is better aligned with the disk of Coma-D61 than it is with the known orientation of the diffraction spikes on WFPC2 images.
The disk is also unusual, in that it does not extend into the center. This feature may be what is referred to as a lens (Kormendy 1992), in that a shelf, or constant surface brightness area in the profile is present, at least in the unprocessed profile (Fig. 9). In the image in which the bulge has been removed, the profile along the major axis does not show a shelf for the disk, rather the area shows a rise and fall in surface brightness with radius. The maximum brightness occurs at the same radius on both sides of the nucleus, so the feature is most likely a ring rather than a spiral arm. This “ring” has about the same color as the bulge at that radius (B-I=1.5). On the other hand, the X feature appears to be somewhat bluer, with B-I=, though there is a strong systematic error in this value because of the difficulty in subtracting off the elliptical bulge in exactly the same way for the images in the different filters. Still, the blue color supports the idea that the stars contributing to the X-like distribution are young.
Finally, the MMT spectrum mentioned above was oriented along the major axis of Coma-D61, and even though the spectrum was not very deep, we have extracted both stellar and gas kinematics from it. The stars rotate with a velocity of about 65 km s-1 out to 3˝ (1.5 kpc) from the nucleus. Similarly, the gas shows a rotation of about 50 km s-1 . It would be interesting to pursue the kinematics of this object with a more detailed study.
D216 in Coma:
Multifiber spectroscopy of Dressler 216 in Coma (hereafter Coma-D216) indicates
a weak PSB nature for this galaxy, which has been classified as Sa by Dressler
(1980) from ground-based images.
The archival WFPC2 V (see Fig. 2) and I
band images
reveal a large bulge as expected for its classification,
and well-defined smooth spiral structure out to a radius of nearly 14˝(7 kpc). The radial luminosity profiles indicate that the disk component
only dominates outside a radius of 4˝ (see Fig. 6). In
addition, the bulge is
considerably redder than the disk, which appears to be consistent with its
weak PSB status.
A final comment regarding Coma-D216 is that the archival HST image of the bright “E+A” galaxy in A665 at z=0.18 studied by Franx (1993) bears a strong morphological resemblance to Coma-D216. An image of this galaxy is shown in Franx et al. (1997), revealing it to have spiral arms surrounding a large bulge.
3.3 Late-Type Spiral Disks
D148 in DC2048-52:
Multi-fiber spectroscopy of Dressler 148 in DC2048-52 (heferafter DC2048-D148)
revealed a PSB spectrum. However, the S/N in the region of [OII]3727
is sufficiently low that we cannot exclude a small equivalent width in that
emission line, hence a small amount of ongoing star formation. DC2048-D148
is classified as S0 on ground-based images. The WFPC2 images (see Fig. 3)
reveal a notably
different morphology. A central light cusp is surrounded by a low surface
brightness spiral structure out to a radius of 7˝, or 7 kpc.
Faint HII regions can be seen within a largely flocculent spiral arm pattern.
The radial luminosity profile is dominated by the central light cusp in the
inner 1˝ in radius, where an r1/4 law profile is evident
(see Fig. 10). For radii greater than 3˝, an exponential disk is the
primary contributor. The color is essentially constant in the central 1˝,
and then reddens by about 0.2 mag in B–I out to a radius of 4˝.
The mean B-I color is red for a late-type spiral, as is the case
for D192 below.
D192 in DC2048-52:
Multi-fiber spectroscopy of Dressler 192 in DC2048-52 (hereafter DC2048-D192)
reveals strong Balmer absorption lines with weak (4–5 Å equivalent width)
emission in [OII]3727. We do not have a spectrum in the red that can
distinguish whether this emission is due to a small amount of ongoing star
formation or to an AGN. DC2048-D192 was classified as PSB in Caldwell &
Rose (1997), due to the very strong Balmer absorption and only weak
[OII]3727 emission. However, the WFPC2 images indicate that star
formation is still ongoing in the central 1.25˝ (1.25 kpc)
in radius. As can be seen in Fig. 3 a central bright nuclear component is
surrounded by a relatively bright star forming region, which is punctuated by
HII regions and/or bright star clusters and dust lanes. A fainter asymmetric
spiral pattern can be traced out to 3.75˝, or 3.75 kpc in
radius. The luminosity profile for DC2048-D192 (Fig. 10) is dominated by an
exponential disk beyond 3˝, while a more centrally concentrated
component is the primary contributor at smaller radii. The radial color map
(Fig. 10) shows the nucleus to be slightly redder than the surrounding region,
except for a red area at a radius of 2˝ from the nucleus, at the
location of an apparent major dust lane in the image.
4 Discussion
At this point we can summarize our knowledge of the SB and PSB galaxies in nearby clusters as follows. From ground-based multi-fiber and long-slit spectroscopy we have found that some galaxies, which from ground-based images are classified as early-type galaxies, have signs of unusual star formation histories, both in terms of the star formation being elevated in the recent past and that star formation being centrally concentrated. The ground-based images indicate that all of these galaxies are disk galaxies. From the HST images, we find that the SB galaxies have spiral structure. In some cases (Coma-D15) the spiral structure is restricted to the inner couple of kpc, while in others (Coma-D45 and Coma-D100) it is global, but in all cases the star formation is centrally concentrated. Most of the PSB galaxies have smooth morphologies, perhaps because their time since the cessation of the starbursts is already 1 Gyr (Caldwell et al. 1996). However one PSB galaxy (Coma-D61) exhibits an X-shaped bulge, which is interesting since the starburst age of this galaxy is relatively young, at 0.5 Gyr. None of the observed galaxies show large collections of young star clusters such as are seen in some merger products (Holtzmann et al. 1992, Miller et al. 1997), which may be an indication that major mergers are not the mechanism involved here.
The two late-type spiral galaxies are a cause for uncertainty. These might be related to anemic galaxies, in which a starburst has not actually occured; rather, the normal disk star formation in such galaxies has been truncated. More detailed spectroscopy than is currently available is needed to sort out this problem.
Although only nine SB/PSB have been studied so far, it seems reasonable to propose an evolutionary sequence, for example, from Coma-D15 to Coma-D61 to Coma-D99. Thus the starburst which is centrally located but extended would eventually fade, resulting in a galaxy with smoother appearance, but with spectroscopic evidence for the past starburst. We caution that precursors might well have a large range in morphologies, and thus the resultants might also have a range in appearances. The central issue we now address is what these observed morphologies allow us to conclude about the source of the SB/PSB activity in nearby rich clusters.
The mechanisms that have been proposed to explain the rapid evolution in galaxies taking place in distant clusters tend to fall into two basic categories: external gravitational perturbation of some kind, (e.g., tidal interaction or merging) or a gas removal mechanism (e.g., ram pressure stripping or ablation). Ram pressure stripping is undoubtedly an important factor in the evolution of cluster galaxies, and probably plays a major role in the observed HI depletion of spiral disks (e.g., Gunn & Gott 1972; Cowie & Songaila 1977; Dressler 1985). However, given the central concentration of the star formation and the non-axisymmetric morphologies present in some cases, which are difficult to understand in terms of a “continuous” gas removal process, we naturally tend to consider the external gravitational perturbation mechanism as the more likely of the two possibilities as a source of the observed central star formation. Such a perturbation could arise from a single strong tidal interaction and/or merger from either an equal mass perturber or a minor mass galaxy. Alternatively, the tidal perturbation could be produced by the global cluster gravitational potential (Byrd & Valtonen 1990; Valluri 1993; Henriksen & Byrd 1996), or, in the case of “galaxy harassment”, from the combined effects of many discrete minor disturbances and of the global cluster potential (Moore et al. 1996, 1998).
4.1 Tidal Interaction/Mergers Between Equal Mass Galaxies
We first consider strong tidal interactions and/or mergers of equal mass galaxies. Observations of galaxies in distant clusters have revealed the signatures of major encounters/mergers in the form of long tidal tails in a substantial number of cases (e.g., Lavery & Henry 1988; Couch et al. 1998 and references therein). These signatures can be taken as evidence for such mergers, although not all the observed cases are clearly due to mergers (Couch et al. 1998). However, among the SB/PSB galaxies that we have imaged in nearby clusters, there are no signs of such major interactions/mergers; we find no cases where long tidal tails are evident, nor do we find signs of a major companion with similar radial velocity. In the three SB/PSB cases where nearby “companions” do appear to be present, two “companions” have in fact very different velocities. Coma-D99 and Coma-D100 have a radial velocity difference of 4700 km/sec and (2) the nearby “companion” to Coma-D15 is a background galaxy with z=0.127. In the third case, DC2048-D216, the “companion” has no measured redshift, but that galaxy itself is a normal looking late-type spiral, with no indication of tidal interactions. As well, DC2048-D216 has a smooth appearance indicating that a significant time has elapsed since the putative tidal iteraction would have occured. Thus we do not consider strong tidal interactions or mergers between equal mass galaxies to be the primary mechanism for inducing starbursts in the nearby rich clusters.
4.2 Minor Mergers
Mergers between a galaxy and a low-mass companion (hereafter referred to as a minor merger) provide a more promising prospect. Mihos & Hernquist (1994) and Hernquist & Mihos (1995) have carried out numerical simulations of minor mergers which include gas dynamics and star formation. A key result of their simulations is that gas in the main galaxy loses angular momentum due to torques exerted by non-axisymmetric disturbances in the stellar component which are generated by the tidal passage and infall of the satellite galaxy. As a result, a great deal of gas piles up in the central region of the main galaxy, leading to a burst of star formation there. The central concentration of the star formation and the magnitude and duration of the star formation burst depend on the bulge-to-disk ratio of the main galaxy. However, in general the star formation is concentrated within the central 1 kpc of the main galaxy, and the starburst lasts for typically 100 – 150 Myr (Mihos & Hernquist 1994). Some of their simulations bear a striking resemblance to D100 and D15 in Coma. Specifically, in Fig. 4 (for simulation of the gas) and Fig. 3 (for simulation of the stars) of Hernquist & Mihos (1995), at a time step of 43.2 the main galaxy looks very similar to D100. At time steps greater than 80, there is considerable resemblance to D15. In addition, both Whitmore & Bell (1988) and Mihos et al. (1995) have discussed X shapes in the bulges of galaxies and have proposed that they are produced by the disturbance created when a minor merger takes place. The Mihos et al. (1995) simulation of a minor merger viewed edge-on (see their Fig. 3) is a close match to our HST image of D61 in Coma. Finally, as can be seen from the edge-on views of minor merger simulations published in Fig. 3 of Hernquist & Mihos (1995), minor mergers heat the disk of the main galaxy, but do not lead to its disruption, which is in agreement with the fact that the PSB galaxies in Coma and DC2048-52 still exhibit surviving disks.
4.2.1 Frequency of Minor Mergers
Given that the minor merger simulations of Mihos & Hernquist are capable of generating the kind of morphological signatures and central star formation that characterize some of our HST images, we evaluated the possibility that minor mergers are the primary source of the star forming early-type galaxies in nearby clusters. Specifically, we are interested in reproducing the situation in the SW region of the Coma cluster, where many PSB galaxies were found by Caldwell et al. (1993), a spatial/kinematic subcluster has been clearly identified (Colless & Dunn 1996; Biviano et al. 1996), and a secondary peak in the cluster x-ray emission has been discovered (Watt et al. 1992; Briel et al. 1992; White et al. 1993). While there is much current debate concerning whether this subcluster, with its associated x-ray and starburst phenomena, is currently falling into the main Coma cluster or has already passed through (e.g., Burns et al. 1994; Colless & Dunn 1996), for the purposes of this discussion we will assume the latter case. Thus we speculate that the starbursts in the Coma PSB galaxies were triggered by minor mergers which occurred when the subcluster encountered the numerous small galaxies in the central part of the Coma cluster. We tested this hypothesis by running N-body simulations of colliding clusters of galaxies using the publicly available NEMO stellar dynamical software (Teuben 1995). The simulations are similar to those described in Caldwell & Rose (1997), in which the evolution of a subcluster falling into a main cluster is followed. As before, we are only concerned with the gravitational interactions of the particles, so the hydrodynamics of the ICM are not considered. A detailed description of the simulations, and of how we identified the minor merger events, is given in the Appendix. The results of the simulations, which are also described in the Appendix and summarized in Table A.1, show that the frequency of minor mergers is far too low to explain the large fraction of SB/PSB galaxies in the SW region of Coma.
4.3 Galaxy Harassment
As mentioned earlier, an alternative way to produce morphological disturbances in cluster galaxies through external gravitational influence is via the “galaxy harassment” mechanism of Moore et al. (1996, 1998). Here the combined effects of frequent impulsive perturbations from small galaxies in high-speed encounters and the changing global tidal field of the cluster produce similar disturbances to the minor merger scenario. Given that harassment is a continual process for any cluster galaxy, we can expect that the morphological and star formation signatures of the harassment process should be evident in those galaxies which still have disks containing significant amounts of HI. Thus galaxies in subclusters which are infalling for the first time into main clusters, and hence have not yet (completely) lost their gas supply in the hostile cluster environment, are good candidates to produce visible reaction to the harassment process. In fact, Fujita (1998) has recently shown from a simple model of pressure-enhanced star formation that galaxy harassment does indeed lead to elevated rates of star formation. In short, galaxy harassment could provide a natural explanation for the appearance of the many SB/PSB galaxies in the SW region of Coma, where the NGC 4839 subcluster appears to be interacting with the main cluster. Of course, one can also expect to see isolated examples of harassed galaxies, since any disk galaxy with a gas supply that is falling into the cluster can in principle go through the evolutionary stages that appear to be present among the SB and PSB galaxies in Coma and DC2048-52.
Several questions remain about the applicability of galaxy harassment to the SB/PSB galaxies in nearby clusters. This process has been used to primarily describe the evolution of the small galaxies in clusters, whereas the Coma and DC2048-52 galaxies that we have imaged are quite substantial, typically only a magnitude fainter than L*. It is important to evaluate the process for these more massive galaxies, with particular regard to the end state produced. Specifically, our HST images and ground-based images indicate that the PSB galaxies still have a prominent disk, thus observationally the disks do survive the perturbation. But do simulated harassed disks survive? As well, the HST images indicate that the morphologies of the SB/PSB galaxies are quite heterogeneous, indicating that a range in precursor morphologies are being processed into a still considerable range in resultant morphologies. It is important to simulate the effect of harassment on a reasonably wide range of input disk morphologies. The effect of harassment on a wide range of initial disk luminosity (mass) must be considered as well. In Caldwell & Rose (1998) we found two low-luminosity (B) Coma galaxies in a recent PSB state. They are clearly S0’s, as indicated by their light profiles, hence harassment must not in general lead to the destruction of disks in smaller galaxies if it is to explain these small galaxies in Coma. Finally, can harassment produce the X morphology that is so evident in Coma-D61?
5 Conclusions
To summarize, HST WFPC2 images of nine SB/PSB galaxies in the Coma and DC2048-52 nearby rich clusters have revealed that the morphologies of the galaxies are rather heterogeneous. However, the SB galaxies tend to have ongoing highly centralized star formation in a region typically 1-2 kpc in radius that appears as a bright “bulge” on ground-based images. In contrast, the PSB galaxies for the most part have substantially smoother morphologies than their SB counterparts, but with blue colors in their central 1-2 kpc in radius. These findings, coupled with the ground-based spectrosocpy reported in earlier papers, are generally consistent with a picture in which the SB galaxies are presently experiencing enhanced star formation in their central regions, and ultimately will fade into the the smoother morphologies represented by the PSB galaxies, with lingering evidence for past central starbursts. While the sample of nine galaxies is still small for drawing general conclusions about the mechanism that triggers the starbursts, in several galaxies we see evidence for an external tidal perturbation as the likely cause of the centralized starburst. Perhaps the “galaxy harassment” mechanism of Moore et al. (1996) is capable of providing such tidal perturbations.
The fact that some galaxies in nearby clusters appear to be normal S0’s or ellipticals on ground-based images, but with the increased spatial resolution of HST are revealed to have centrally concentrated recent or ongoing star formation, has implications for morphological studies of distant galaxies. In the typical z0.4 cluster for which HST images can now provide comparable physical resolution as ground-based images of Coma cluster galaxies, one may now question whether some galaxies classified as early-type from HST images actually harbor ongoing or recent starbursts in their central regions.
Finally, to establish a clearer picture of how a galaxy is excited into a starburst and then fades through the PSB phase into a “normal” early-type galaxy, we need to increase the sample of SB/PSB galaxies beyond the nine observed for this paper to several dozen. A larger sample is particularly necessary if we are to assess how evolution through the SB and PSB phase depends on the initial morphology of the precursor galaxy. Such information would establish an observational framework for testing the effects of tidal perturbations on galaxies within the dense cluster environment.
Appendix A APPENDIX
The numerical simulations used in §4.2.1 to assess the frequency of minor mergers in clusters were carried out using the routine “hackcode1”, which is the standard NEMO N-body integrator based on the Barnes & Hut (1989) hierarchial tree algorithm. The NEMO stellar dynamical software is publicly available on the World Wide Web. Because we would like to compare the simulations to our observations, it is important to know to what physical units the NEMO units correspond. The NEMO units are defined as follows: 1) the gravitational potential of each cluster is , 2) the kinetic energy is (therefore the cluster is virialized), 3) the total mass of the cluster is and 4) the gravitational constant is . Noting that where is the gravitational radius, we find that , and from the kinetic energy requirements, , where is the rms velocity dispersion of the galaxies. Observations of the x-ray gas (Fusco-Femiano & Hughes 1994) and of the galaxy distribution (Kent & Gunn 1982) show that the core radius of Coma is kpc and kpc respectively. Using the fact that for a Plummer model (which we adopt here for its mathematical convenience), and an estimated distance to the Coma cluster of 100 Mpc, we find an average on the order of 1 Mpc implying that a NEMO unit of distance is 500 kpc. The inferred 3-dimensional rms velocity dispersion for Coma is approximately 1700 km/s (Colless & Dunn 1996; Biviano et al 1996) implying that a NEMO unit of velocity is 2404 km/s. A unit of time in NEMO is defined as 0.4 crossing time, which, for the Coma cluster with a crossing time of 1 Gyr, corresponds to 0.4 Gyr.
In general, the simulations consisted of two clusters: a main cluster with 5000 particles and a less massive subcluster with 256 particles. The point of the simulations was to assess how large a fraction of the galaxies in the infalling subcluster would experience a minor merger with one of the small galaxies in the main cluster. The Mihos & Hernquist (1994) and Hernquist & Mihos (1995) simulations used a mass ratio between large galaxy and satellite galaxy of 10:1. While it is not entirely clear what is the minimum mass ratio that can still produce a large tidal effect on the larger galaxy, we adopted a ratio of 20:1 as a reasonable estimate. Consequently, our simulations are designed to look for minor mergers between “large” galaxies in the subcluster and “small” galaxies in the main cluster. Given that the typical PSB galaxy in the SW region of the Coma cluster has B = 16.5, we expect the typical minor merger to be with a main cluster galaxy with B = 19.75. From recent analyses of the Coma cluster luminosity function (Bernstein et al. 1995; Lobo et al. 1997; Secker et al. 1997) we estimate there to be approximately 1200 galaxies with B 19.75. Hence in simulating the Coma cluster with 5000 particles we overestimate the frequency of minor mergers by a factor of approximately 4. However, by using such a large number of particles in both cluster and subcluster we obtain better statistics on the merger frequency and then can adjust the merger rates accordingly.
In our simulations each cluster was constructed from a virialized Plummer model with a softening parameter for each particle of 0.05 NEMO units (equivalent to 25 kpc) to account for the extended mass distributions of the individual galaxies. The two structures were initially placed 4 distance units apart with a variety of purely radial subcluster infall velocities ranging from 1/4 parabolic to 1/16 parabolic. In most cases, the mass ratio of the two clusters was 4:1. The subcluster was constructed of only one type of particle each with a mass of x NEMO mass units, so that the total mass of the subcluster was 1. For the main cluster we used 5120 particles each with a mass of x, i.e., approximately 20 times less massive than the particles in the subcluster. Then to bring the total mass of the main cluster to four times larger than the subcluster, we inserted 100 particles each of mass x. All simulations were run for 10 time units (i.e. 4 Gyr total) with 15 increments per each 0.4 Gyr time unit. At times near 4.5, the subcluster is just passing through the center of the main cluster and at times near 9, the subcluster has almost halted and is about to fall back into the main cluster for the second time. Because we are only interested in the first passage of the subcluster, the simulations were not continued beyond this point. To increase the statistical reliability of the results, we ran each simulation four times, with different random initial positions and velocities for the individual particles within the two virialized Plummer models.
For each iteration, NEMO outputs the mass, the x-y-z spatial coordinates and the x-y-z velocity coordinates of each particle. The particle data is then analyzed to determine if a minor merger has taken place. The specific conditions under which galaxy mergers occur are still somewhat uncertain. Analytical work carried out under the impulsive approximation (e.g., Alladin 1965; Alladin et al. 1975; White 1982 and references therein) have indicated that tidal interactions will dissipate sufficient orbital energy to effect capture if the original encounter velocity between the two galaxies is slightly hyperbolic or less. More specifically, the energy dissipation from tidal interaction scales as:
| (A1) |
where and are the velocity and distance separation of the two galaxies at closest approach (Spitzer 1958; Alladin et al. 1975; White 1982). In more general terms, White (1982) concluded that if a pair of equal mass galaxies have a relative velocity and impact parameter at infinity given by and , and with relative velocity and distance at closest approach, then merging will occur for and , where and are the rms velocity dispersion and gravitational radius (as defined through the virial theorem) of each galaxy. The encounter parameters at infinity and at closest approach are related by and , where is the mass of each galaxy. For the specific case of a pair of galaxies with = 180 km s-1 and m = 10, the maximum relative velocity at infinity that can result in a merger is then = 255 km s-1 , and for a closest approach of = 25 kpc, the orbital kinetic energy term is approximately twice the gravitational potential energy term , since . Hence, it appears that as a general rule a merger will occur if the oribital kinetic energy at closest approach is less than twice the orbital potential energy. This is clearly a very crude approximation, given that the actual tidal encounter is dependent on the mass distribution within the galaxies and their internal kinematics (e.g., elliptical versus disk galaxy) and the angle of encounter.
Unfortunately, the above assumption of an impulsive encounter is actually invalid in the slow encounters that lead to a merger. However, numerical simulations (e.g., Toomre 1977; White 1982) have tended to confirm the general results obtained from the above analytic approximations. As a specific case, in the Hernquist & Mihos (1995) simulations a minor merger was achieved when the satellite galaxy was initially placed at 6 disk scale lengths from the large galaxy, or 20 – 25 kpc for a major disk galaxy like the Milky Way (e.g., Mihalas & Binney 1981). We therefore adopt as the first criterion for a minor merger that the two galaxies must come within 25 kpc (or 0.05 NEMO distance units) of each other. For our second criterion, i.e., that the galaxies must have a relatively slow encounter speed, we specify that the encounter velocity at closest approach must be low enough that the orbital kinetic energy of the main galaxy plus satellite be less than twice the gravitational potential energy, i.e., the constraint developed above from the impulsive approximation studies. Finally, since we are interested in the frequency of minor mergers, the third criterion is that the encounter must take place between an infalling subcluster member and a low mass particle in the main cluster.
The general results of the N-body simulations are that typically less than 2% of the subcluster galaxies experience a minor merger. Given that we overestimated the number of small galaxies in Coma by more than a factor of 4, we thus predict that only 0.5% of the galaxies in a merging subcluster would experience a minor merger. In contrast, 40% of the early-type galaxies in the SW region of Coma are either SB or PSB (Caldwell et al 1993). Furthermore, those mergers that do take place in our simulations are almost exclusively among particles in the subcluster that are stripped off during the subcluster passage and thus remain behind with the main cluster. As was discussed in Caldwell & Rose (1997), about 60% of the subcluster particles become bound to the main cluster during the subcluster passage. It is among these particles that the minor mergers occur in our simulations. Moreover, roughly 85% of the observed mergers take place between times 6 and 9, i.e., at late times. What is clearly happening is that some of the particles left behind in the main cluster eventually experience a minor merger, which has little to do with the initial pasage of the subcluster through the main cluster. This is not what is seen in the case of the SW region of Coma, where the SB/PSB galaxies are associated both spatially and kinematically (in the mean) with the subcluster. In addition, the age dating of the PSB galaxies indicates that they underwent starbursts within a fairly narrow time frame, thus implying that the starbursts were triggered in a well-defined event, such as passage of the subcluster through the main cluster.
To further test these results, we changed the merger distance criterion from 25 kpc to 50 kpc. While the number of minor mergers did increase with this change, the number only doubled to about 4%, with the mergers occuring in the same location (i.e., in the main cluster center) and at the same times. It may seem puzzling that the number of mergers did not quadruple when the distance was doubled, as might be expected since the cross sectional area goes as the square of the distance. However, one must consider the energy criterion as well. For a galaxy to satisfy both the distance and the energy requirements after the distance criterion is doubled, it must initially have a smaller velocity so that it still meets the energy condition at closest approach.
For completeness, we also tested the effects of changing the energy criterion so that the kinetic energy of the particles at closest approach must be less than 2.5 times the gravitational potential energy, as opposed to the factor of 2 previously considered. Even under these conditions, the number of minor mergers that occured was only near 3%. Likewise, there was no significant increase in the number of minor mergers when the infall parameters were changed. Thus, from our N-body simulations, it seems very unlikely that minor mergers are the main source of the star formation in the early type galaxies in nearby clusters. A summary of the results of the simulations is given in Table A.1.
References
- (1) Alladin, S. M. 1965, ApJ, 141, 768
- (2) Alladin, S. M., Potdar, A., & Sastry, K. S. 1975, in Dynamics of Stellar Systems, edited by A. Hayli, (Reidel, Dordrecht), 167
- (3) Andreon, S., Davoust, E., Michard, R., Nieto, J.-L., & Poulain, P. 1996, A&AS, 116, 429
- (4) Baldwin, J. A., Phillips, M. M., & Terlevich, R. 1981, PASP, 93, 5
- (5) Balogh, M. L., Morris, S. L., Yee, H. K. C., Carlberg, R. G., & Ellingson, R. 1997, ApJ, 488, L75
- (6) Barger, A. J., Aragón-Salamanca, A., Ellis, R. S., Couch, W. J., Smail, I., & Sharples, R. M. 1996, MNRAS, 279, 1
- (7) Barnes, J. E., & Hut, P. 1989, ApJS, 70, 389
- (8) Belloni, P., Bruzual, G., Thimm, G. -J., & Roser, H.-J. 1995, A&A, 297, 61
- (9) Bernstein, G. M., Nichol, R. C., Tyson, J. A., Ulmer, M. P., & Wittman, D. 1995, AJ, 110, 1507
- (10) Biviano, A., Durret, F., Gerbal, D., Le Fevre, O., Lobo, C., Mazure, A., & Slezak, E. 1996, A&A, 311, 95
- (11) Bower, R. G. 1991, MNRAS, 248, 332
- (12) Bower, R. G., Lucey, J. R., & Ellis, R. S. 1992, MNRAS, 254, 601
- (13) Briel, , U. G., Henry, J. P., & Bohringer, H. 1992, A&A, 259 , L31
- (14) Bruzual A. G., & Charlot, S. 1995, ApJ, in preparation
- (15) Burns, J. O., Roettiger, K., Ledlow, M., & Klypin, A. 1994, ApJ, 427, L87
- (16) Butcher, H. & Oemler, A. 1978, ApJ, 219, 18
- (17) Butcher, H. & Oemler, A. 1984, ApJ, 285, 426
- (18) Byrd, G., & Valtonen, M. 1990, ApJ, 350, 89
- (19) Caldwell, N., & Phillips, M. M. 1989, ApJ, 338, 789
- (20) Caldwell, N., & Rose, J. A. 1997, AJ, 113, 492
- (21) Caldwell, N., & Rose, J. A. 1998, AJ, 115, 1423
- (22) Caldwell, N., Rose, J. A., Franx, M., & Leonardi, A. 1996, AJ, 111, 78
- (23) Caldwell, N., Rose, J. A., Sharples, R. M., Ellis, R. S., & Bower, R. G. 1993, AJ, 106, 473
- (24) Carlson, M. N., et al. 1998, AJ, 115, 1778
- (25) Colless, M. & Dunn, A. 1996, ApJ, 458, 435
- (26) Couch, W. J., Barger, A. J., Smail, I., Ellis, R. S., & Sharples, R. M. 1998, ApJ, 497, 188
- (27) Couch, W., Ellis, R.S., Sharples, R.M., & Smail, I. 1994, ApJ, 430, 121
- (28) Couch, W. J. & Newell, E. B. 1984, ApJS, 56, 143
- (29) Couch, W. & Sharples, R.M. 1987, MNRAS, 229, 423
- (30) Cowie, L. L., & Songaila, A. 1977, Nature, 266, 501
- (31) Dressler, A. 1980, ApJS, 42, 565
- (32) Dressler, A. 1985, ARA&A, 22, 185
- (33) Dressler, A. & Gunn, J. E. 1982, ApJ, 263, 533
- (34) Dressler, A. & Gunn, J. E. 1983, ApJ, 270, 7
- (35) Dressler, A. & Gunn, J. E. 1992, ApJS, 78, 1
- (36) Dressler, A., Oemler, A., Butcher, H. R., & Gunn, J. E. 1994a, ApJ, 430, 107
- (37) Dressler, A., Oemler, A., Sparks, W. B., & Lucas, R. A. 1994b, ApJ, 435, L23
- (38) Fabricant, D., Cheilets, P., Caldwell, N., & Geary, J. 1998, PASP, 110, 79
- (39) Franx, M. 1993, ApJ, 407, L5
- (40) Franx, M., Kelson, D., van Dokkum, P. Illingworth, G., & Fabricant, D. 1997, in ASP Conference Series “The Second Stromlo Symposium: The Nature of Elliptical Galaxies”, eds. M. Arnaboldi, G. S. da Costa, & P. Saha, 116, p. 512
- (41) Fujita, Y. 1998, astro-ph/9807120
- (42) Fusco-Femiano, R., & Hughes, J. P. 1994, ApJ, 429, 545
- (43) Gavazzi, G. 1989, ApJ, 346, 59
- (44) Gavazzi, G., Randone, I., & Branchini, E. 1995, ApJ, 438, 590
- (45) Giovanelli, R., & Haynes, M. P. 1985, ApJ, 292, 404
- (46) Gunn, J. E., & Gott, J. R. 1972, ApJ, 176, 1
- (47) Haynes, M. P., Giovanelli, R., & Chincarini, G. L. 1984, ARA&A, 22, 445
- (48) Henriksen, M. J., & Byrd, G. 1996, ApJ, 459, 82
- (49) Henry, J. P., & Lavery, R. J. 1987, ApJ, 323, 473
- (50) Hernquist, L. & Mihos, J. C. 1995, ApJ, 448, 41
- (51) Holtzman, J. A., Faber, S. M., Shaya, E. J., Lauer, T. R., Grothe, J., Hunter, D. A., Baum, W. A., Ewald, S. P., Hester, J. F., Light, R. M., Lynds, C. R., O’Neil, E. J., jr., & Westphal, J. A. 1992, AJ, 103, 691
- (52) Kauffmann, G. 1995, MNRAS, 274, 153
- (53) Kent, S. M., & Gunn, J. E. 1982, AJ, 87, 945
- (54) Koopmann, R. A., & Kenney, J. D. P. 1998, ApJ, 497, L75
- (55) Kormendy, J. 1982, in Morphology and Dynamics of Galaxies, edited by L. Martinet & M. Mayor, (Geneva Observatory), 113
- (56) Lauer, T. R., Ajhar, E. A., Byun, Y.-I., Dressler, A., Faber, S. M., Grillmair, C., Kormendy, J., Richstone, D., & Tremaine, S. 1995, AJ, 110, 2622
- (57) Lavery, R. J., & Henry, J. P. 1986, ApJ, 304, L5
- (58) Lavery, R. J., & Henry, J. P. 1988, ApJ330, 596
- (59) Lavery, R. J., Pierce, M. J., & McClure, R. D. 1992, AJ, 104, 2067
- (60) Leonardi, A. J., & Rose, J. A. 1996, AJ, 111, 182
- (61) Lobo, C., Biviano, A., Durret, F., Gerbal, D., Le Fevre, O., Mazure, A., & Slezak, E. 1997, A&A, 317, 385
- (62) Lucy, L. B. 1974, AJ, 79, 745
- (63) MacLaren, I., Ellis, R. S., & Couch, W. J. 1988, MNRAS, 230, 249
- (64) Mihalas, D., & Binney, J. 1981, in Galactic Astronomy: Structure and Kinematics, Second Edition, (W. H. Freeman and Co., San Francisco), 326
- (65) Mihos, J. C., & Hernquist, L. 1994, ApJ, 425, L13
- (66) Mihos, J. C., Walker, I. R., Hernquist, L., de Oliveira, C. M., & Bolte, M. 1995, ApJ, 447, L87
- (67) Miller, B. W., Whitmore, B. C., Schweizer, F., & Fall, S. M. 1997, AJ, 114, 2381
- (68) Moore, B., Katz, N., Lake, G., Dressler, A., & Oemler, A. 1996, Nature, 379, 613
- (69) Moore, B., Lake, G., & Katz, N. 1998, ApJ, 495, 139
- (70) Morris, S. L., Hutchings, J. B., Carlberg, R. G., Yee, H. K. C., Ellingson, E., Balogh, M. L., Abraham, R. G., & Smecker-Hane, T. A. ApJ, In Press, astro-ph/9805216
- (71) Moss, C., & Whittle, M. 1993, ApJ, 407, L17
- (72) Moss, C., Whittle, M., Pesce, J. E., & Socas-Navarro, H. 1995, Astro Lett. and Communications, 31, 215
- (73) Pickles, A. J. & van der Kruit, P. C. 1991, A&AS, 91, 1
- (74) Rakos, K. D. & Schombert, J. M. 1995, ApJ, 439, 47
- (75) Richardson, W. H. 1972, JOSA, 62, 52
- (76) Secker, J., Harris, W. E., & Plummer, J. D. 1997, PASP, 109, 1377
- (77) Soucail, G., Mellier, Y., Fort, B., & Cailloux, M. 1988, A&AS, 73, 471
- (78) Spitzer, L. 1958, ApJ, 127, 17
- (79) Teuben, P. J. 1995, in Astronomical Data Analysis Software and Systems IV, edited by R. Shaw, H. E. Payne, & J. J. E. Hayes, PASP Conf. Ser. No. 77 (ASP, San Francisco), 398
- (80) Thompson, L. 1988, ApJ, 324, 112
- (81) Toomre, A. 1977, in Evolution of Galaxies and Stellar Populations, edited by R. B. Larson & B. M. Tinsley, (Yale University Observatory, New Haven), 401
- (82) Valluri, M. 1993, ApJ, 408, 57
- (83) Veilleux, S. & Osterbrock, D. E. 1987, ApJS, 63, 295
- (84) Watt, M. P., Ponman, T. J., Bertram, D. et al. 1992, MNRAS, 2 58, 738
- (85) White, S. D. M. 1982, in Morphology and Dynamics of Galaxies, edited by L. Martinet & M. Mayor, (Geneva Observatory), 291
- (86) White, S. D. M., Briel, U. G., & Henry, J. P. 1993, MNRAS, 2 61, L8
- (87) Whitmore, B. C., & Bell, M. 1988, ApJ, 324, 741
- (88) Whitmore, B. C., Schweizer, F., Leitherer, C., Borne, K, & Robert, C. 1993, AJ, 106, 1354
- (89) Whitmore, B. C., Miller, B. W., Schweizer, F., & Fall, S. M. 1997, AJ, 114, 1797
- (90) Wirth, G. D., Koo, D. C., & Kron, R. G. 1994, ApJ, 435, L105
- (91)


![[Uncaptioned image]](/html/astro-ph/9809241/assets/x8.png)
| T/U | No. Minor | % Minor | % Trapped in | % at | |
|---|---|---|---|---|---|
| Mergers | Mergers | Main Cluster | t6.0 | ||
| 25 kpc | 2.0 | 5.3 | 2.0 % | 85% | 88% |
| 50 kpc | 2.0 | 10.3 | 4.0% | 75% | 90% |
| 25 kpc | 2.5 | 8.4 | 3.3% | 85% | 81% |