Are the red dwarfs in cataclysmic variables main-sequence stars?
Abstract
We show that the secondaries in short-period cataclysmic variables with orbital periods hr are close to the solar-abundance main sequence defined by single field stars. In cataclysmic variables with hr, the earliest spectral types at a given period correspond to main sequence stars, while the majority of secondaries have later spectral types. Possible causes are nuclear evolution prior to mass transfer and lack of thermal equilibrium due to mass transfer. A comparison with evolutionary sequences obtained with up–to–date stellar models implies unusually high transfer rates and a large fraction of systems with evolved donors. There is no evidence for a secondary of low metallicity in any of the well-studied cataclysmic variables.
Key Words.:
cataclysmic variables - low-mass stars - M-stars1 Introduction
Fifteen years ago, Echeverría (1983) addressed the question whether the secondaries in cataclysmic variables (CVs) are main sequence (MS) stars. While he concluded that they have, in general, later spectral types than MS stars of the same mass, his study was limited by poor statistics, particularly below the period gap. Patterson (1984) concluded that the empirical zero-age main sequence (ZAMS) adequately described the secondary stars except for CVs with orbital periods hr. Similarly, Smith & Dhillon (1998) focus on systems with estimated secondary masses and radii and conclude that CV secondaries with hr are, as a group, indistinguishable from MS stars in detached binaries. On the other hand, Friend et al. (1990) found that the secondaries in a substantial number of CVs at shorter periods are too cool to pass credibly for ZAMS stars. In this paper, we point out that secondaries in CVs deviate noticeably from field MS stars for a certain range in orbital period and discuss these deviations in the framework of evolutionary models.
Roche geometry and Kepler’s laws define the orbital period of a CV which harbours a secondary of mass and radius as
| (1) |
where varies between 1.032 and 0.990 for mass ratios , and and are the masses of white dwarf and secondary star, respectively. For the secondaries in most CVs, and are ill-determined and the only well-determined quantity is the spectral type . Therefore the diagram of CVs is an excellent observational tool to study properties of CV secondaries. Unlike Smith & Dhillon (1998), we focus on this diagram.
In order to compare the secondaries in CVs with MS stars, we need an equivalent theoretical relationship for field stars, i.e. the period of a CV in which a given field star as a secondary would just fill its Roche lobe. In the present paper, we derive this relation, making use of the recent convergence of the theoretical and observational descriptions of the lower MS.
On the theoretical side, significant progress towards an accurate description of the mechanical and thermal properties of low-mass stars has been made by the use of improved internal physics and outer boundary conditions based on non-grey atmosphere models. Evolutionary calculations based on the interior models of Chabrier and Baraffe (1997), combined with recent NextGen atmosphere models and synthetic spectra of Hauschildt et al. (1998; see also Allard et al. 1997), have led to a much improved representation of the observed properties of M-dwarfs (Baraffe et al. 1995, 1997, 1998; henceforth summarized as BCAH). These models provide mass-colour and mass-magnitude relationships which can be directly compared to observed quantities. On the observational side, the application of the NextGen models to the analysis of low-resolution optical/IR spectra has improved to the point that an acceptable radius and temperature scale is in view (Leggett et al. 1996, henceforth L96).
2 The lower main sequence
Chabrier & Baraffe (1995) and Baraffe & Chabrier (1996) showed that the BCAH models closely reproduce the observed radii of the visual binaries CM Dra and YY Gem, and the mass-spectral-class relationship of very-low-mass stars. More recently, the models have been shown to reproduce the lower MS of globular clusters (BCAH97), observed mass-magnitude relationships in the V- and K-bands, and colour-magnitude diagrams in near-infrared colors (BCAH98). A detailed description of the input physics for the most recent low-mass star models used in our study can be found in Baraffe et al. (1998; see also references therein).
Figure 1 compares stellar radii determined quasi-observationally by L96 with model radii calculated by BCAH. This comparison is made on a luminosity scale with luminosity represented by the absolute magnitude in the K-band. is an observationally well-determined quantity for most nearby field stars and is well-reproduced by the theoretical models (see BCAH98). The solid curve represents the ZAMS for solar metallicity [M/H] = 0. The dotted curve is the 0.1 Gyr isochrone for [M/H] = 0. At this age, the less massive () stars are still in their pre-MS contraction phase. At a given , decreasing metallicity implies a reduction in radius by some 8% per dex in [M/H] ([M/H] = , long-dashed curve, [M/H] = , short-dashed curve). The data points represent the observationally determined radii of eight young disk stars (YD, ), four old disk stars (OD or O/H, ), and four halo stars (H, ) (L96). Four of these stars are binaries (Gl65AB, 129, 206, and 268). We assume they have two identical components and include the mean values in Fig. 1. The 12 YD/OD stars and one H star have radii very close to those predicted for [M/H] = 0 which is in line with the lack of a one-to-one relation between kinematic population class and metallicity (e.g. Leggett 1992, henceforth L92). The average ratio of the observed over the theoretical radii for the eight YD stars alone is , for the 12 YD/OD stars it is . On the average, the radii of these stars with bona fide near-solar metallicity agree with the ZAMS model radii for stars of the same luminosity within 2%. Individual stars deviate by up to 6% in both directions, but they are all within 2 standard deviations of the [M/H] = 0 model. Two halo stars have radii as expected for their low metallicity (L96), confirming the spread in radius as a function of metallicity predicted by the BCAH models.
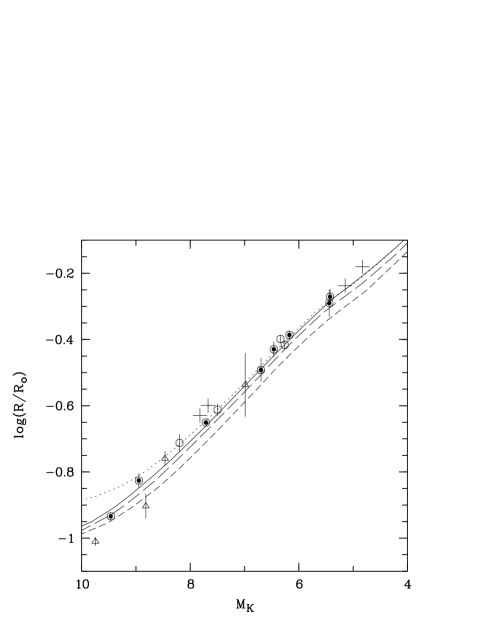
Also shown (as + ) are the radii of the binary components of YY Gem and CM Dra. The luminosity of YY Gem is based on the HIPPARCOS parallax, mas (Jahreiss, private communication), the one of CM Dra on the ground-based parallax, mas (van Altena et al. 1995). The CM Dra points indicate radii larger than expected from the [M/H] = 0 model by %, a discrepancy which would disappear for the larger distance suggested by Chabrier & Baraffe (1995).
It is interesting to compare these quasi-observationally derived radii of dwarf stars with those predicted by the Barnes-Evans relation (Barnes & Evans 1976) which is almost entirely based on giants and supergiants, but thought to be applicable to dwarfs, too (Lacy 1977). For nine stars in common between Lacy and L96, the average ratio of the radii (after conversion to the same parallax) is with individual values of the ratio ranging from 0.90 to 1.32. This systematic difference, however, seems to be present only over a restricted range in spectral type, notably early M, where the Barnes-Evans relation displays a break due to the transition between two power-law approximations. We consider the L96 radii to be more appropriate for dwarf stars and further discuss the difference to the Barnes-Evans radii in a forthcoming paper (Beuermann & Weichhold 1998).
Clemens et al. (1998) claim that substructure exists in the diagram which is not reproduced by the models. Such substructure is not evident from the ) relationship of Fig. 1 where it would be expected at . Moreover, Kolb et al. (1998) have shown that the hypothetical period distribution of CVs based on the mass–radius relationship derived by Clemens et al. (1998) does not match the observed distribution around the period gap.
Radii based on analyses with the NextGen stellar atmosphere models are available only for the few stars shown in Fig. 1. However, the Figure allows one to predict the radius of a star of about solar metallicity and of given luminosity by adopting the observationally confirmed theoretical ) relationship for [M/H] = 0 (solid line). The mean offset of the corresponding data points from the theoretical curve by 1–2% is easily accounted for by one or more of the following factors: (i) systematic errors in the observationally derived radii (%, L96); (ii) the mean error in the K-band fluxes used (%); and (iii) the uncertainties in the age and the metallicity of the observed objects.
In order to define the shape of the MS in sufficient detail, we supplement the sample of 12 YD/OD stars in L96 by 67 proven or presumed single YD/OD stars. This sample is defined in Appendix A 1 and A 3 and extends from the Sun down in luminosity to the transition from the stellar to the brown-dwarf regime (represented by GD165B). These stars are mostly from the list of single stars of Henry & McCarthy (1993, their Table 3) which are selected on the base of speckle interferometry. It is important to exclude unrecognized binaries since they would be mistaken for single stars of higher mass and radius and would blur the empirical MS as well as the corresponding diagram. Since we want to concentrate on stars of solar metallicity, we have included no further H stars beyond the three in the L96 subsample.
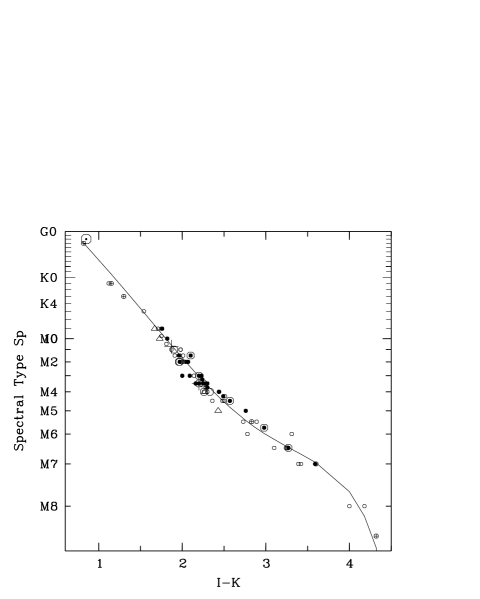
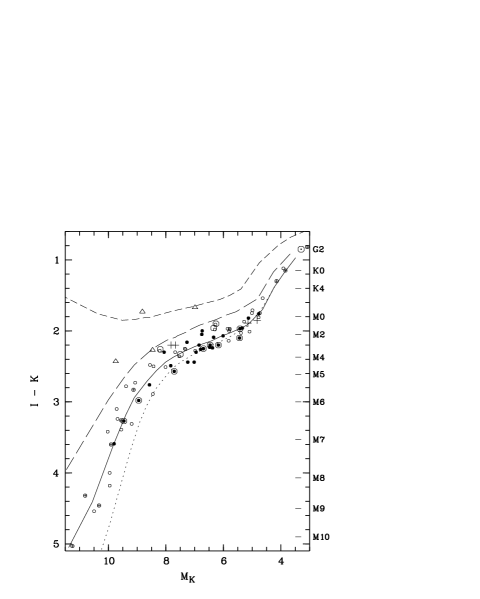
Figure 2 shows the colour-magnitude diagram111All I magnitudes refer to the Cousins system, K magnitudes to the CIT system. () – of the complete sample along with theoretical curves for the same BCAH models as in Fig. 1. These models reproduce the observed () diagram exceedingly well. For fixed age and colour, they predict a drop by roughly 1 mag in for a decrease in [M/H] by dex. For the observed sample of field M–stars of mixed age and composition, we expect the bright limit of the distribution to be populated by ZAMS stars with near-solar metallicity plus an admixture of pre-MS stars. For the spectral range = M0M5, the bright limit is, in fact, dominated by YD stars which typically have near-solar metallicity (e.g. L96). The lower part of the diagram is dominated by stars classified kinematically as OD, but at least some of these have spectroscopically determined [M/H] in the range of to (e.g. Jones et al. 1996, Schweitzer et al. 1996) and, hence, are approximately solar-like, too. The lack of stars falling near the 0.1 Gyr isochrone (dotted curve) indicates the scarcity of low-mass pre-MS stars in the sample.
The conversion from to used for the theoretical models (and indicated on the right-hand side of Fig. 2) is based on the ) relation for the YD/OD stars of our sample which is shown in Fig. 3 (solid curve). It is represented by the third-order polynomial
| (2) |
where the spectral types of M-, K-, and G-stars are given as a function of by M for , K for , and G for , respectively. For M-stars, this relation is very close to those of L96 and Kirkpatrick & McCarthy (1994). For stars earlier than K3, the relation may be less accurate and off by 1–2 subclasses.
3 The diagram for main–sequence field stars
The essential observational information on the main-sequence nature of the secondaries in CVs is contained in the diagram. It is important, therefore, to determine the locus of main–sequence field stars of different metallicity in such a diagram. For this purpose, we transform the data points and the BCAH model curves of Fig. 2 into the plane, using Eq.(1). The results are shown in Fig. 4. For the theoretical curves, the periods are readily determined from the model values for and , while the spectral types are derived from the model values of . As the latter may still be in error by up to mag for low mass stars, the error in the inferred can reach 1/2 spectral class. For the observed stars, on the other hand, is known, but and are generally not, with the exception of the binary components of CM Dra and YY Gem (Metcalfe et al. 1997; Leung & Schneider 1978). Quasi-observational values of are available for the L96 stars. For the remaining stars, we use the BCAH ZAMS model radii for solar abundances as a function of (Fig. 1, solid curve). Except for low-mass pre-MS stars and for some of the OD stars the implied error in is %. Masses are derived for all stars except CM Dra and YY Gem from the appropriate theoretical ) relationship, i.e. the [M/H] = 0 model for the L96 YD stars as well as the additional YD/OD stars, and the [M/H] = and models for the L96 OD stars and H stars, respectively. This is an acceptable approach since the ) relationship is in good agreement with the Henry and McCarthy (1993) binary data (cf. BCAH98). Note that the clustering of the data points near the model curve for ZAMS stars with [M/H] = 0 is to some extent artificial as a result of using the corresponding model values for and .
The model curves in Fig. 4 indicate the fundamental dependencies expected in the diagram. At a given period, MS stars with near-solar metallicities have the latest spectral types, whereas stars of lower metallicity display earlier spectral types. The effect is clearly noticeable already for a few 0.1 dex from solar metallicity. For solar abundances, the model predicts = 2.40 at hr which corresponds to M4. The brightest observed MS stars at this period have M4.5. The lower boundary to the distribution of MS stars in Fig. 4 is delineated by the L96 YD stars (encircled filled circles) and corresponds to the bright limit in Fig. 2. OD stars (open circles) and H stars (triangles) are seen to extend into the upper left part of the diagram.
As min is approached, drops rapidly, as expected from the severe drop in the mass-luminosity relationship below (M6) (cf. Baraffe and Chabrier 1996). The secondaries in real CVs become degenerate near (e.g. Paczyński & Sienkiewicz 1981). They never reach radii below which implies periods somewhat longer than predicted for MS stars of the same mass. Hence, in real CVs, the curve would drop even more rapidly reaching very late spectral types already near 80 min (see Sect. 4 below). Therefore, it is not surprising that only extremely few secondaries in CVs with min have so far been detected spectroscopically (Howell et al. 1998).
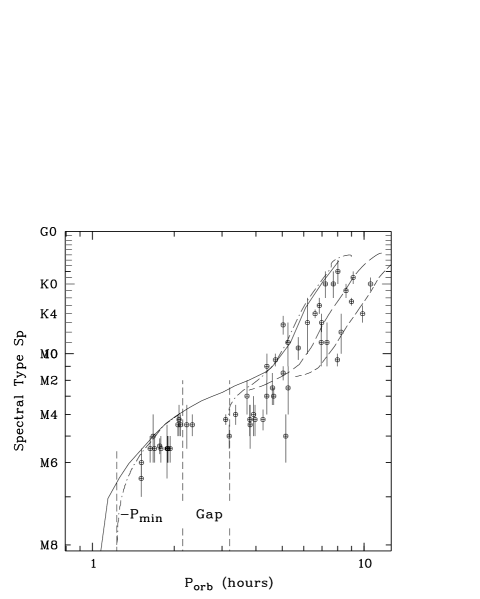
4 The diagram for CVs
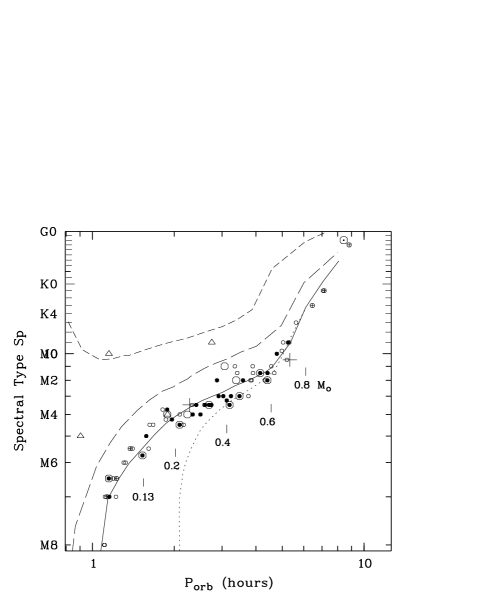
Ritter & Kolb (1998) have compiled the spectral types of 60 CVs with orbital period d. We have checked all original references and accept 50 classifications which are supported by optical/IR spectroscopy; we exclude classifications based on photometry only and a few which appear less compelling. Two classifications from more recent papers are added. See Appendix B for details and for a list of the adopted spectral types. The resulting diagram is shown in Fig. 5. Also shown is the location of ZAMS stars with [M/H]=0 from Fig. 4 (solid curve). No secondary star is found in the upper left “halo”part of Fig. 5, with two possible exceptions noted in the Appendix. With this caveat, there is currently no evidence for the existence of halo type CVs with metal-poor secondaries. Continuing the search for such stars is clearly important.
¿From a comparison of Figs. 4 and 5 we conclude that below the period gap ( hr) secondaries in CVs are indistinguishable from ZAMS stars within the observational and theoretical uncertainties, while above the gap they are mostly cooler than ZAMS stars with the same mean mass density.
In the following we explore to what extent this discrepancy can be accounted for by the fact that the secondary transfers mass to the white dwarf. As a consequence of this mass loss, the secondary deviates from thermal equilibrium. The deviation is large if the mass loss time scale is short compared to the star’s thermal time scale. The non–equilibrium reveals itself as a radius expansion for predominantly convective donors ( ) or contraction for more massive donors ( ) compared to their respective ZAMS radii (e.g. Whyte & Eggleton 1980; Stehle et al. 1996). In contrast, the effective temperature at a given secondary mass is fairly insensitive to mass loss (e.g. King & Kolb 1998). Hence donors that have been subjected to mass loss are under–massive and cooler ( ) or over–massive and slightly hotter ( ) compared to hypothetical donors with no previous mass loss in CVs with the same orbital period. This could explain the late spectral types seen in CVs with hr, but certainly not those at longer period. Nuclear evolution of the secondary star prior to mass transfer offers a natural explanation for the latter. The nuclear timescale of stars with mass is short enough that nuclear burning can significantly deplete the central hydrogen supply within the age of the Galaxy. Subsequent mass transfer reduces the secondary mass and mimics a low–mass star that has an equivalent nuclear age much longer than a Hubble time.
To illustrate this quantitatively we have calculated several evolutionary sequences with constant mass loss rate, using the same input physics as for the BCAH models. At turn–on of mass transfer, the secondary has a mass of , is either a ZAMS star with initial central H abundance (dot-dashed curve, henceforth “unevolved sequence”), a moderately evolved MS star with reduced to (long dashes), or a star which is just at the end of core hydrogen burning (; short dashes). For all three cases the adopted transfer rate is yr-1. Along the last two sequences, henceforth “evolved sequences”, the surface H abundance decreases as the convective envelope reaches H–depleted regions deeper inside the star. Both the outer boundary conditions of the stellar models and the derived colours rely on atmosphere models for solar composition (X=0.70). As this inconsistency makes the models unreliable for we stopped the evolved sequences once dropped below this value (at a mass and , respectively). The unevolved sequence extends further down to hr where the secondary becomes fully convective (at a mass ). In line with the standard model for the period gap (see e.g. King 1988, Kolb 1996, for reviews) mass loss was terminated at this point and the star allowed to shrink back to its equilibrium radius. Then mass loss resumed (at the now shorter orbital period hr) with a rate yr-1, typical for mass transfer driven by gravitational wave emission. The mass loss rate above the period gap was chosen such that the sequence reproduces the observed width and location of the gap, i.e. the secondary’s radius was larger by a factor than its equilibrium radius when it became fully convective. The true secular mean transfer rate at longer orbital periods is not known. Semi–empirical estimates for the braking rate from a magnetic stellar wind typically give values in the range yr-1, consistent with observational estimates (e.g. Warner 1995).
The observed spectral types on both sides of the gap are about M4.5, supporting the conventional explanation of the gap which predicts that the secondary masses in the majority of systems just above and below the gap are the same. Below the period gap, mass loss is so slow that the star should stay close to the ZAMS, as is, in fact, observed. This holds until the secondary approaches the period minimum where the internal structure is increasingly dominated by electron degeneracy, H-burning turns off, and the star becomes a brown dwarf.
At longer orbital periods the unevolved sequence fails to give secondaries cool enough to match observed secondaries, except immediately above the gap (cf. Fig. 5). The observed spread in for hr seems to imply much higher transfer rates which would expand the secondaries further over the equilibrium radius. Further model calculations demonstrated that for transfer rates in excess of yr-1 the secondary can reach the region near hr and M5. A forthcoming paper (Kolb & Baraffe, in preparation) will investigate this possibility in more detail.
The most evolved sequence (short-dashed curve in Fig. 5) nicely defines an approximate lower envelope for the observed distribution of CVs with hr in the diagram. (Note that sequences from initially more massive donors, or with different transfer rate, might fall slightly below the most evolved sequence in Fig. 5). Additional effects to reconcile theory with observations seem not necessary in this period range. As the evolved sequences differ from the unevolved sequence significantly only when the initial is already very small, the observed location of CV secondaries implies that in a fairly large fraction of CVs the donor must have been very close to the end of core hydrogen burning when mass transfer began (see also Ritter 1994). Such a large fraction seems to be in conflict, however, with standard models of CV formation (de Kool 1992, Politano 1996) which predict that nascent CVs are dominated by systems with essentially unevolved donors.
5 Conclusions
A re-evaluation of the properties of the lower MS indicates that secondary stars in short-period CVs lie on the ZAMS for near-solar metallicity within the uncertainties. In CVs with orbital period hr, the majority of the secondaries is cooler than ZAMS field stars with solar metallicity, indicative of some expansion. Possible causes are nuclear evolution prior to mass transfer at the longer periods and lack of thermal equilibrium due to mass loss at the shorter ones. A comparison with evolutionary sequences suggests that an unexpectedly large fraction of CVs has an evolved donor, and that mass transfer rates for hr could be much higher than usually assumed. Of the secondaries spectroscopically identified so far, none has a metallicity substantially below solar. Secondaries in CVs with orbital period min will be of spectral type M8 and very difficult to detect.
Acknowledgements.
We thank Hartmut Jahreiss for providing the HIPPARCOS parallaxes prior to publication and Frederic Hessman, Boris Gänsicke, and Klaus Reinsch for comments and discussions. IB thanks the Universitäts-Sternwarte, Göttingen, for hospitality and the APAPE (PROCOPE contract 97151) for travel support. Theoretical astrophysics research at Leicester is supported by a PPARC Rolling Grant.References
- (1) Allard F., Hauschildt P.H., Alexander D.R., Starrfield S. 1997, ARA&A 35, 137
- (2) Baraffe I., Chabrier G. 1996, ApJ 461, L51
- (3) Baraffe I., Chabrier G., Allard F., Hauschildt P.H. 1995, ApJ 446, L35
- (4) Baraffe I., Chabrier G., Allard F., Hauschildt P.H. 1997, A&A 327, 1054
- (5) Baraffe I., Chabrier G., Allard F., Hauschildt P.H. 1998, A&A 337, 403
- (6) Barnes T.G., Evans D.S. 1976, MNRAS 174, 489
- (7) Beuermann K., Thomas H.-C., Giommi P., Tagliaferri G. 1987, A&A 175, L9
- (8) Beuermann K., Weichhold M 1998, A&A submitted
- (9) Chabrier G., Baraffe I. 1995, ApJ 451, L29
- (10) Chabrier G., Baraffe I. 1997, A&A 327, 1039
- (11) Clemens J.C., Reid I.N., Gizis J.E., O’Brien M.S. 1998, ApJ 496, 392
- (12) Dhillon V.S., Marsh T.R. 1995, MNRAS 275, 89
- (13) Echeverría J. 1983, Rev.Mex.Astron.Astrof. 8, 109
- (14) Ferrario L., Wickramasinghe D.T., Bailey J., Buckley D. 1995, MNRAS 273, 17
- (15) Friend M.T., Martin J.S., Smith R.C., Jones D.H.P. 1990, MNRAS 246, 637, and 654
- (16) Hauschildt P.H., Allard F., Baron E. 1998, ApJ in press (NextGen models)
- (17) Henry T.J., McCarthy Jr. W. 1993, AJ 106, 773
- (18) Howell, S.B., Hauschildt, P., Dhillon, V.S. 1998, ApJ 494, L223
- (19) Jones H.R.A., Longmore A.J., Allard F., Hauschildt P.H. 1996, MNRAS 280, 77
- (20) King A.R. 1988, QJRAS 29, 1
- (21) King A.R., Kolb U. 1998, MNRAS, in press
- (22) Kolb U. 1996, in Cataclysmic Variables and Related Objects, ed. A. Evans, J.H. Wood, (Dordrecht: Kluwer), IAU Coll. 158, 433
- (23) Kolb U., King A.R., Ritter H., 1998, MNRAS 298, L29
- (24) de Kool M. 1992, A&A 261, 188
- (25) Kirkpatrick J.D., McCarthy D.W. 1994, AJ 107, 333
- (26) Kirkpatrick J.D., Henry T.J., Simons D.A. 1995, AJ 109, 797
- (27) Lacy C.L. 1977, ApJS 34, 479
- (28) Leggett S.K. 1992, ApJS 83, 351 (L92)
- (29) Leggett S.K., Allard F., Berriman G., Dahn C.C., Hauschildt P.H. 1996, ApJS 104, 117 (L96)
- (30) Leung K.-C., Schneider D.P. 1978, AJ 83, 618
- (31) Liebert J., Stockman H.S., Angel J.R.P. et al. 1978, ApJ 225, 201
- (32) Metcalfe T.S., Mathieu R.D., Latham D.W., Torres G. 1996, ApJ 456, 356
- (33) Paczyński B., Sienkiewicz R. 1981, ApJ 248, L27
- (34) Patterson J. 1984, ApJS 54, 443
- (35) Politano M. 1996, ApJ 465, 338
- (36) Reid I.N., Gizis J.E. 1997, AJ 113, 2246
- (37) Ringwald F.A. 1994, MNRAS 270, 804
- (38) Ritter H., 1994, in Evolutionary Links in the Zoo of Interactive Binaries, ed. F. D’Antona, V. Caloi, C. Maceroni, F. Giovanelli, in Memorie della Società Astronomica Italiana 65, 173
- (39) Ritter H., Kolb U. 1998, A&A 129, 83
- (40) Schwarz R., Schwope A.D., Beuermann K. et al. 1998, A&A in press
- (41) Schweitzer A., Hauschildt P.H., Allard F., Basri G. 1996, MNRAS 283, 821
- (42) Silber A., Remillard R.A., Horne K., Bradt H.V. 1994, ApJ 424, 955
- (43) Smith D.A., Dhillon V.S. 1998, MNRAS in press
- (44) Smith D.A., Dhillon V.S., Marsh T.R. 1998, MNRAS 296, 465
- (45) Stehle R., Ritter H., Kolb U. 1996, MNRAS 279, 581
- (46) van Altena W.F., Lee J.T.L., Hoffleit D. 1995, Catalogue of Trigonometric parallaxes, Yale University Observatory
- (47) Warner B. 1995, Cataclysmic Variable Stars, Cambridge Astrophysics Series 28, (Cambridge: CUP)
- (48) Whyte C., Eggleton P. 1980, MNRAS 190, 801
Appendix A Sample of main sequence stars
Our sample of MS stars was collected from the three sources listed below. Denotations are: YD = young disk, OD = old disk or old disk/halo, H = halo star, B = binary, SB = spectroscopic binary. For some stars, different spectral classifications are given in the literature. In these cases, we have chosen the one more appropriate for the colours and . When no spectral class is available, we adopt the probable classification appropriate for the colours.
-
1.
The first group contains the Sun and further nine stars taken mostly from Reid & Gizis (1997) which delineate the MS at spectral types G/K.
Name Pop. Name Pop. Gl34A – G3V Gl488 OD M0 Gl68 – K1V Gl673 OD K7V Gl105A OD K3V Gl820A OD K5V Gl166A OD K1V Gl820B OD K7V Gl380 Y/O K7V
-
2.
The second group contains the 16 M-stars from Leggett et al. (1996, L96) with individually determined radii. These stars serve as calibrators for the ) relationship.
Name Pop. Name Pop. Gl65AB YD,B M Gl411 OD M2 Gl129 H,SB M0 Gl494 YD M1.5 Gl195A YD M2 Gl699 OD M4 Gl206 YD,SB M3.5 Gl896A YD M3.5 Gl213 OD M4 Gl908 OD M1 Gl268 YD,SB M4.5 GJ1111 YD M6.5 Gl299 H M4 LHS343 H K7: Gl388 YD M3 LHS377 H M5
-
3.
The third group contains 60 stars from the list of “single” red dwarfs in Table 3 of Henry & McCarthy (1993), of which seven are already contained in the L96 sample. To these we have added the mean components of the visual binaries CM Dra and YY Gem, the M8.5 star TVLM 513-46546 and GD165B which marks the transition to the brown-dwarf regime at M10 (Kirkpatrick et al. 1995). Hence, this group contains 57 stars.
Name Pop. Name Pop. Gl15A OD M1.5 CM Dra OD,B M3.5 Gl15B OD M Gl643 OD M4 Gl54.1 OD M4.5 Gl644C OD M7 Gl83.1 OD M4.5 Gl701 OD M2 Gl105B OD M4 Gl725A Y/O M3 Gl109 YD M3+ Gl725B Y/O M3.5 Gl166C OD M4.5 Gl729 Y/O M Gl205 OD M1.5 Gl752A OD M3 Gl229 YD M1.5 Gl752B OD M8 Gl251 Y/O M3.5 Gl809 OD M1 Gl273 OD M3.5 Gl873 Y/O M3.5 YY Gem YD,B M0.5-1 Gl880 OD M2 Gl300 M4+ Gl884 OD M Gl338A YD M0 Gl905 OD M5.5 Gl393 Y/O M2 GJ1002 OD M5.5 Gl402 Y/O M4 GJ1156 YD M5 Gl406 OD M6 GL1245B M5.5 Gl408 YD M3 LHS191 M6.5 Gl412A OD M1 LHS292 OD M6.5 Gl412B OD M6 LHS523 OD M6.5 Gl445 OD M3.5 LHS2065 M9 Gl447 OD M4+ LHS2397a OD M8 Gl450 OD M2 LHS2471 OD M7 Gl514 OD M1 LHS2924 OD M9 Gl526 OD M1.5 LHS2930 Y/O M7 Gl555 M4 LHS3003 M7 Gl581 Y/O M3.5 TVLM513 M8.5 Gl625 YD M2 GD165B M10 Gl628 YD M3.5
Appendix B Sample of spectroscopically identified secondaries in CVs
The list of Ritter & Kolb (1998) contains 60 entries for the spectral classes of secondary stars in CVs with orbital period hr. We exclude six objects because we judge the spectral evidence as not sufficiently compelling (UU Aql, TX Col, WW Hor, EX Hya, BD Pav, HX Peg) and four further objects because the cited spectral type is based on photometry only (TV Col, CW Mon, X Leo, UU Aqr). The published spectrum of WW Hor (Beuermann et al. 1987) is very noisy and the spectral type may be earlier than the quoted M6. For EX Hya, our own unpublished optical/near IR spectroscopy does not reveal the secondary while our IR photometry shows what seems to be its ellipsoidal modulation, suggesting that it is of late spectral type. Two potentially interesting systems are among those excluded: HX Peg (Ringwald 1994) may be the only CV with an sdK secondary; BD Pav is quoted as K (Ritter & Kolb 1998, unpublished spectrum), but as K7M0 by Friend et al. (1990). These two systems would be located above the MS in Fig. 5, in a region otherwise devoid of CV secondaries. For a few systems we adjusted the spectral types in the Ritter & Kolb list based on the available literature: e.g. VV Pup : M5 (Liebert et al. 1978), V2301 Oph : M5.5 (Silber et al. 1994, Ferrario et al. 1995), and BT Mon : G8 (Smith et al. 1998). We added BC UMa M6.5 (Friend et al. 1990), RX J0203+29 : M2.5 (Schwarz et al. 1998), and RX And : K5- (Dhillon & Marsh 1995). The list gives the name of the CV, the orbital period in hr, and the adopted spectral type with estimated error.
| Name | P(h) | Name | P(h) | ||
|---|---|---|---|---|---|
| BC UMa | 1.512 | M6.50.5 | TW Vir | 4.384 | M31 |
| OY Car | 1.515 | M60.5 | SS Aur | 4.387 | M11 |
| BZ UMa | 1.632 | M5.50.5 | RXJ0203 | 4.602 | M2.51 |
| VV Pup | 1.674 | M51 | DQ Her | 4.647 | M30.5 |
| V834 Cen | 1.692 | M5.50.5 | UX UMa | 4.720 | M0.50.5 |
| HT Cas | 1.768 | M5.40.3 | RX And | 5.037 | K5-2 |
| Z Cha | 1.788 | M5.50.5 | EX Dra | 5.038 | M1.50.5 |
| V2301 Oph | 1.883 | M5.51 | AR Cnc | 5.150 | M51 |
| MR Ser | 1.891 | M5.50.5 | EY Cyg | 5.244 | K72 |
| BL Hyi | 1.894 | M5.50.5 | CZ Ori | 5.254 | M2.51.5 |
| ST LMi | 1.898 | M5.50.5 | AT Cnc | 5.729 | K81 |
| WW Hor | 1.925 | M6 | AH Her | 6.195 | K53 |
| AR UMa | 1.932 | M5.50.5 | SS Cyg | 6.603 | K40.5 |
| DV UMa | 2.063 | M4.50.5 | V426 Oph | 6.847 | K31 |
| HU Aqr | 2.084 | M4+0.7 | Z Cam | 6.956 | K72 |
| UZ For | 2.109 | M4.50.5 | EM Cyg | 6.982 | K51 |
| UW Pic | 2.224 | M4.51 | AC Cnc | 7.211 | K02 |
| QS Tel | 2.332 | M4.50.5 | TT Crt | 7.303 | K72 |
| AM Her | 3.094 | M4+0.3 | V363 Aur | 7.710 | K02 |
| MV Lyr | 3.190 | M50.5 | V1309 Ori | 7.983 | M0.50.5 |
| V1432 Aql | 3.366 | M40.5 | BT Mon | 8.012 | G82 |
| QQ Vul | 3.708 | M31 | CH UMa | 8.232 | K62 |
| IP Peg | 3.797 | M4+0.7 | QZ Aur | 8.580 | K11 |
| VY For | 3.806 | M4.51 | RU Peg | 8.990 | K2.50.5 |
| CN Ori | 3.917 | M41 | SY Cnc | 9.120 | G91 |
| DO Dra | 3.969 | M4+0.7 | AE Aqr | 9.880 | K41 |
| U Gem | 4.246 | M4+0.5 | DX And | 10.572 | K01 |