SCUBA: A common-user submillimetre camera operating on the James Clerk Maxwell Telescope
Abstract
SCUBA, the Submillimetre Common-User Bolometer Array, built by the Royal Observatory Edinburgh for the James Clerk Maxwell Telescope, is the most versatile and powerful of a new generation of submillimetre cameras. It combines a sensitive dual-waveband imaging array with a three-band photometer, and is sky-background limited by the emission from the Mauna Kea atmosphere at all observing wavelengths from 350 m to 2 mm. The increased sensitivity and array size mean that SCUBA maps close to 10,000 times faster than its single-pixel predecessor (UKT14). SCUBA is a facility instrument, open to the world community of users, and is provided with a high level of user support. We give an overview of the instrument, describe the observing modes and user interface, performance figures on the telescope, and present a sample of the exciting new results that have revolutionised submillimetre astronomy.
keywords:
Submillimetre astronomy: James Clerk Maxwell Telescope – instrumentation: detectors (SCUBA)1 Introduction
It can be claimed with some justification that the submillimetre waveband is the last to be opened up for ground-based astronomical research. Even from superb sites the atmospheric transparency is generally poor, and even in the transmission ‘windows’ the high background photon power and associated noise fluctuations from the atmosphere limit the observing sensitivity. However, in terms of the three fundamental factors that govern the impact of a particular waveband – the collecting area of the telescope, the sensitivity of the detector, and the availability of imaging systems – submillimetre astronomy has finally come of age.
The 15 m James Clerk Maxwell Telescope (JCMT) is situated at a high, dry site–Mauna Kea in Hawaii. With detectors cooled to well below 1 K, sky-background noise sensitivity levels are achievable in all the submillimetre atmospheric windows. Single-pixel instruments such as UKT14 (Duncan et al. 1990), SCUBA’s (successful) predecessor on the JCMT, provided a wealth of photometric and mapping data, though the latter were limited both in depth and area. Indeed, in terms of extragalactic astronomy, UKT14 had reached the end of its useful life almost three years before it was retired from service, with only a handful of high-redshift active galaxies succumbing to very lengthy integrations in excellent conditions in the final years (e.g. Dunlop et al. 1994).

Array detectors were the obvious next step and the extremely ambitious SCUBA project was approved by the JCMT Board in 1987. SCUBA is not the first bolometer array to appear on a telescope; over the past several years there have been the MPIfR 1.3 mm arrays (Kreysa et al. 1998) on the Institut de Radio Astronomie Millimetrique (IRAM) 30 m telescope and the 350 m SHARC array at the Caltech Submillimetre Observatory (CSO) (Wang et al. 1996). However, SCUBA is unique in combining an unparalleled sensitivity with an extensive wavelength range and field-of-view. The result is a mapping capability up to 10,000 times faster than that of UKT14.
SCUBA is a dual camera system containing 91 pixels in the short-wavelength (SW) array and 37 pixels in the long-wavelength (LW) array. Both arrays have approximately the same field-of-view on the sky (2.3 arcminutes in diameter) and can be used simultaneously by means of a dichroic beamsplitter. The SW array is optimised for operation at 450 m (but can also be used at 350 m), whilst the LW array is optimised for 850 m (with observations at 750 and 600 m also possible). Additional pixels are provided for photometric studies at 1.1, 1.35 and 2.0 mm. The array pixels are arranged in a close-packed hexagon as shown in Figure 1, with the photometric pixels positioned around the outside of the LW array.
SCUBA was delivered from the Royal Observatory Edinburgh to the Joint Astronomy Centre (JAC) in April 1996 and first light on the telescope was obtained in July. After extensive commissioning the first astronomical data for the community was taken in May 1997 using two modes of operation: photometry and ‘jiggle-mapping’. The final major mode of data-acquisition, ‘scan-mapping’, was released in February 1998.
SCUBA’s forte is the detection of thermal emission from dust with temperatures ranging from 3 K to 30 K. At higher temperatures (except for high-redshift objects - see later) the dust radiates predominantly in the far-infrared. SCUBA is also perfectly suited to measuring the synchrotron emission from extragalactic sources.
In terms of dust emission, SCUBA has already revealed the population of galaxies responsible for at least part of the far-infrared background (Smail, Ivison & Blain 1997; Barger et al. 1998; Hughes et al. 1998; Eales et al. 1998), detected a range of high-redshift galaxies (Ivison et al. 1998a; Cimatti et al. 1998; Dey et al. 1998), provided new insights into galaxy evolution (Blain et al. 1998a), imaged the dust extent in nearby galaxies (Israel, van der Werf & Tilanus, 1998), discovered potential proto-planetary systems around a number of ‘Vega-excess’ stars (Holland et al. 1998a; Greaves et al. 1998), mapped numerous dust complexes and molecular outflow regions of our Galaxy (e.g. Davis et al. 1998), and discovered new populations of Class 0 protostars and pre-stellar cores (Visser et al. 1998; Ward-Thompson et al. 1998). The impact of SCUBA has already been realised and has resulted in an unprecedented over-subscription factor for the JCMT.
This paper gives a brief description and overview of the SCUBA instrument; the detailed technical aspects, as well as the design criteria, will be found elsewhere (Gear et al. 1998). We aim to give the user a feel for the instrument and its operation, the user-interface, software, performance figures on the telescope, sky noise removal and data calibration. Finally, we illustrate the potential of SCUBA with a short selection of new results, and discuss plans for future developments.
2 Optical Design
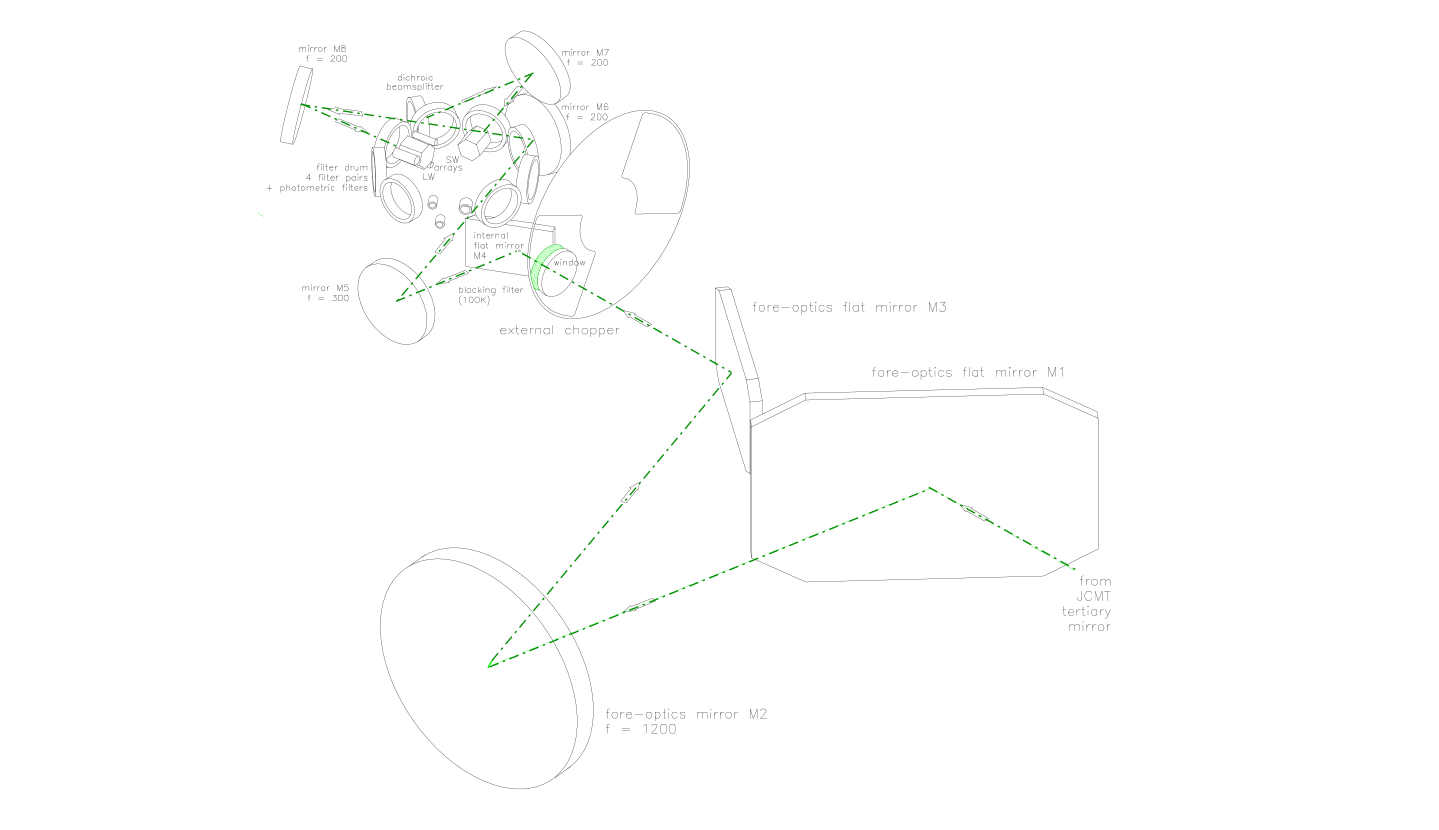
SCUBA is mounted on the left-hand Nasmyth platform of the JCMT. To obtain the maximum field-of-view at this location, the normal /12 focal ratio has been extended to /16 by a small shift in the secondary mirror position. This ensures that the telescope beam passes unvignetted from the tertiary mirror, through the elevation bearing to the instrument. To minimise the thermal load on the low-temperature arrays and the size of the feedhorns, the final focal ratio is down-converted to /4 using a Gaussian-beam telescope arrangement. This preserves a focal plane that is frequency invariant, and allows critical components such as the cryostat window and dichroic beamsplitter to be located at points where the beam diameter is a minimum. The layout of the optics is shown in Figure 2 and is fully described in Murphy et al. (1998).
Just in front of the cryostat entrance window is a sky chopping unit. This is a dual-bladed chopper that allows the bolometers to view either the sky (no blade present), the emission from an ambient-temperature blade covered in Eccosorb, or the reflection of the cold internal optics from the back of a polished blade. This arrangement provides a standard hot- and cold-load calibration system similar to existing heterodyne receivers.
An internal Gaussian-beam telescope relays the input beam to the SW and LW arrays via a dichroic beamsplitter lying at the final re-imaged aperture plane; the LW beam being transmitted and the SW beam reflected. The beams then pass to the arrays through bandpass filters housed in a rotating filter drum (see section 3).
A novel feature of the SCUBA optical design is an internal calibration unit that can remove any short- or long-term drifts in the detector response (caused, for example, by a change in the sky-background power). The calibration source is an ‘inverse bolometer’, i.e. a bolometer that is heated by electrical power and therefore radiates. The signal is modulated at a frequency of 3 Hz (i.e. different to the 7.8 Hz chop of the secondary) so that both calibrator and chop signals can be recovered separately. The calibrator is located at an image of the telescope aperture (mirror M4 in Figure 2) and provides an effective point source which uniformly illuminates the arrays through the internal optics.
The submillimetre beam is coupled to the detector cavities via conical feedhorns with single-moded cylindrical waveguides. Each horn illuminates the telescope with a profile that approximates to a Gaussian, and this provides efficient coupling to the Airy disk whilst minimising the response to extraneous background power. The horns are optimised for use at 450 and 850 m. At the detector, optimum coupling efficiency is obtained by having a feedhorn with an entrance diameter of about twice the full-width half maximum (FWHM) of the Airy pattern, i.e. 2, where is the focal ratio of the beam. The array pixels are therefore spaced at approximately 2 (ignoring the small wall thickness of the feedhorn), which results in a significantly undersampled image (the requirement for Nyquist sampling is /2).
To obtain a fully-sampled map at one wavelength requires 4 offsets in orthogonal directions, and this is achieved by ‘jiggling’ the telescope secondary mirror over a 16-point pattern to fill in the gaps. This pattern is repeated as necessary to build up the signal-to-noise (S/N) in a map. This mode of mapping is referred to as ‘jiggle-mapping’ (see section 7).
3 Wavelength selection
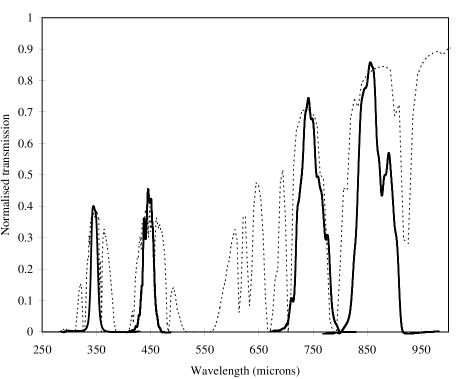
Ground-based astronomy in the submillimetre waveband is restricted to observing through particular transmission ‘windows’ in the atmosphere. As shown in Figure 3 these windows extend from 350 m (860 GHz) to 850 m (345 GHz). Throughout this region atmospheric water vapour is the main absorber of the radiation from astronomical sources. Excellent observing conditions are therefore also referred to as dry conditions, meaning the atmospheric water vapour content is low above the site. One of the best sites currently available is the summit of Mauna Kea, 4.2 km above sea level.
The selection of observing wavelength is made by a bandpass filter carefully designed to match the transmission window. The filters are multi-layer, metal-mesh interference filters (Hazell 1991) located in a nine-position rotating drum that surrounds the arrays, at a temperature of around 4 K. They have excellent transmission (typically over 80 %), and also less than 0.1 % out-of-band power leakage. This latter design characteristic is particularly important as it ensures that there is minimum contribution to the source signal from extraneous sky emission. Composite alkali-halide filters (Hazell 1991) are used to block optical and near-infrared radiation, thereby minimising the thermal load on the arrays. These blocking filters are located on the outer radiation shield of the cryostat (at 90 K), the filter drum (4 K) and the 100 mK array stage. The filter drum contains several pairs of filters; for example, it is possible to observe at 450/850 m simultaneously, and also at 350/750 m. One position of the drum is for the three filters for the photometric pixels at 1.1, 1.35 and 2.0 mm. The spectral performance of the filters was measured by the University of Lethbridge Fourier Transform Spectrometer (Naylor et al. 1996), and the resultant profiles are overlaid on the Mauna Kea atmospheric transmission curve in Figure 3.
4 Bolometers
In general, bolometric detectors with their large instantaneous bandwidths have a significant sensitivity advantage over heterodyne receivers. However, a drawback of the large bandwidth is an increased susceptibility to degradation in performance through background power loading (from the sky and telescope) of the cooled detector (Griffin & Holland 1988). Therefore, although bolometers are still the preferred device for submillimetre continuum astronomy, it is often necessary to restrict the filter profile to a relative narrow bandwidth (/ 5). This is particularly true for the ultra-low temperature detectors now in operation.
The SCUBA bolometers are of a composite design. Incoming radiation is absorbed onto a thin film of bismuth mounted on a saphhire substrate. Glued to the centre of the substrate is a small chip of neutron transmutation doped germanium (volume 0.4 mm3), which acts as a thermometer and measures tiny changes in temperature due to incident photons. Electrical connections are made by 10 m diameter brass wire that govern the overall thermal conductance, and these leads are fed out of the back of the mount. Each of the 131 bolometers in SCUBA is designed as a ‘plug-in’ unit that can be close-packed to form an array, and easily replaced in the event of malfunction (over several years of extensive testing and operation there has only been one faulty bolometer). Details of the design and construction of the bolometers are given in Holland et al. (1996).
When cooled to an operating temperature of 100 mK and blanked-off to incoming radiation, the bolometers have a measured electrical noise equivalent power (NEP) of 6 10-17 W Hz-1/2. Under low sky-background levels the bolometers achieve background-limited performance, i.e. optical NEPs of 3.5 10-16 and 1.8 10-16 W Hz-1/2 at 450 and 850 m respectively. The NEP varies by no more than 20 % across each array; this was one of the crucial design goals for the instrument. The performance of the bolometers is fully discussed in Holland et al. (1998b).
5 Cryogenics
The SCUBA arrays are cooled to an operating temperature of 100 mK using an Oxford Instruments Kelvinox dilution refrigerator. This produces a cooling power of 20 W at 100 mK, which is sufficient to cool the 6 kg of arrays down to this temperature. The refrigerator is built into a hybrid cryostat consisting of a central 10 litre, liquid helium dewar, used to cool the filter drum to around 4 K. A pumped liquid nitrogen vessel cools the internal optics to 45 K, minimising the thermal load on the filter drum and arrays. An outer liquid nitrogen vessel cools a superinsulated radiation shield and infrared blocking filter to 90 K, further minimising the thermal load.
The vacuum system uses a turbomolecular pump that is left running constantly to limit the migration of contamination onto the arrays. The vacuum within the instrument is typically less than 10-8 mbar. To minimise resonances and vibrational microphonics within the signal band, the internal sections of the cryostat are held by fiberglass truss supports (these also minimise heat conduction). Further details of the design of the cryogenics can be found in Cunningham et al. (1998).
6 Electronics and signal processing
The plug-in bolometer units fit directly into a printed circuit board. Each bolometer is biased with a 90-M load resistor (also at 100 mK) and a common battery voltage supply. The detector signals are brought to the first stage of signal amplification via superconducting ribbon cables (Cunningham et al. 1996) that are heat-sunk at various temperatures inside the cryostat. The JFET head amplifiers are voltage followers, cooled to 200 K to minimise gate current noise. The output of the FETs goes through RF filters in the vacuum seal to external AC-coupled pre-amplifiers with gains of about 9000. Subsequent to this, the signals are multiplexed into groups of 16, and pass through an anti-aliasing filter to reject high-frequency resonances, and finally to the Data Acquisition System (DAQ).
The DAQ consists of 9 programmable gain amplifiers (to account for different source flux levels), and the signals are digitised by 12-bit A/D converters. They then pass to Inmos T800 transputers via a link adapter and high-speed serial link. The nine transputers perform signal processing functions such as demodulating the calibrator and chop signals and the removal of spikes. The image-processing transputer re-samples map data onto a square grid (usually in RA-Dec) and corrects for sky rotation. Data are sent via Ethernet to a workstation in the telescope control room for display.
7 Observing modes
7.1 Introduction
SCUBA is both a camera and a photometer. There are four basic observing modes for use with the instrument: photometry, jiggle-mapping, scan-mapping and polarimetry (the latter needs additional hardware). These will be briefly discussed in the next section (more extensive descriptions of the first three are given by Lightfoot et al. 1995; Jenness, Lightfoot & Holland 1998).
7.2 Photometry
Photometry is the preferred mode of observation for a completely isolated point-like source with an accurately known position. Photometry is carried out with the central pixel of each array simultaneously, or with any of the long-wavelength photometers independently. The conventional techniques of two-position chopping and nodding are employed to remove the dominant sky background. Extensive tests have shown that a better S/N is obtained by performing a small 3 3 grid (of spacing 2 arcsecs) around the source. This compensates for the slight offset between the arrays (1.5 arcsec) and helps cancel atmospheric scintillation and/or slight pointing or tracking uncertainties. Chopping between pixels on the array (2-bolometer chopping) so that the source is observed continuously during the chop cycle is also possible for compact sources. However this requires a non-azimuthal chop, which is known to be less effective in providing sky cancellation (Church & Hills 1990).
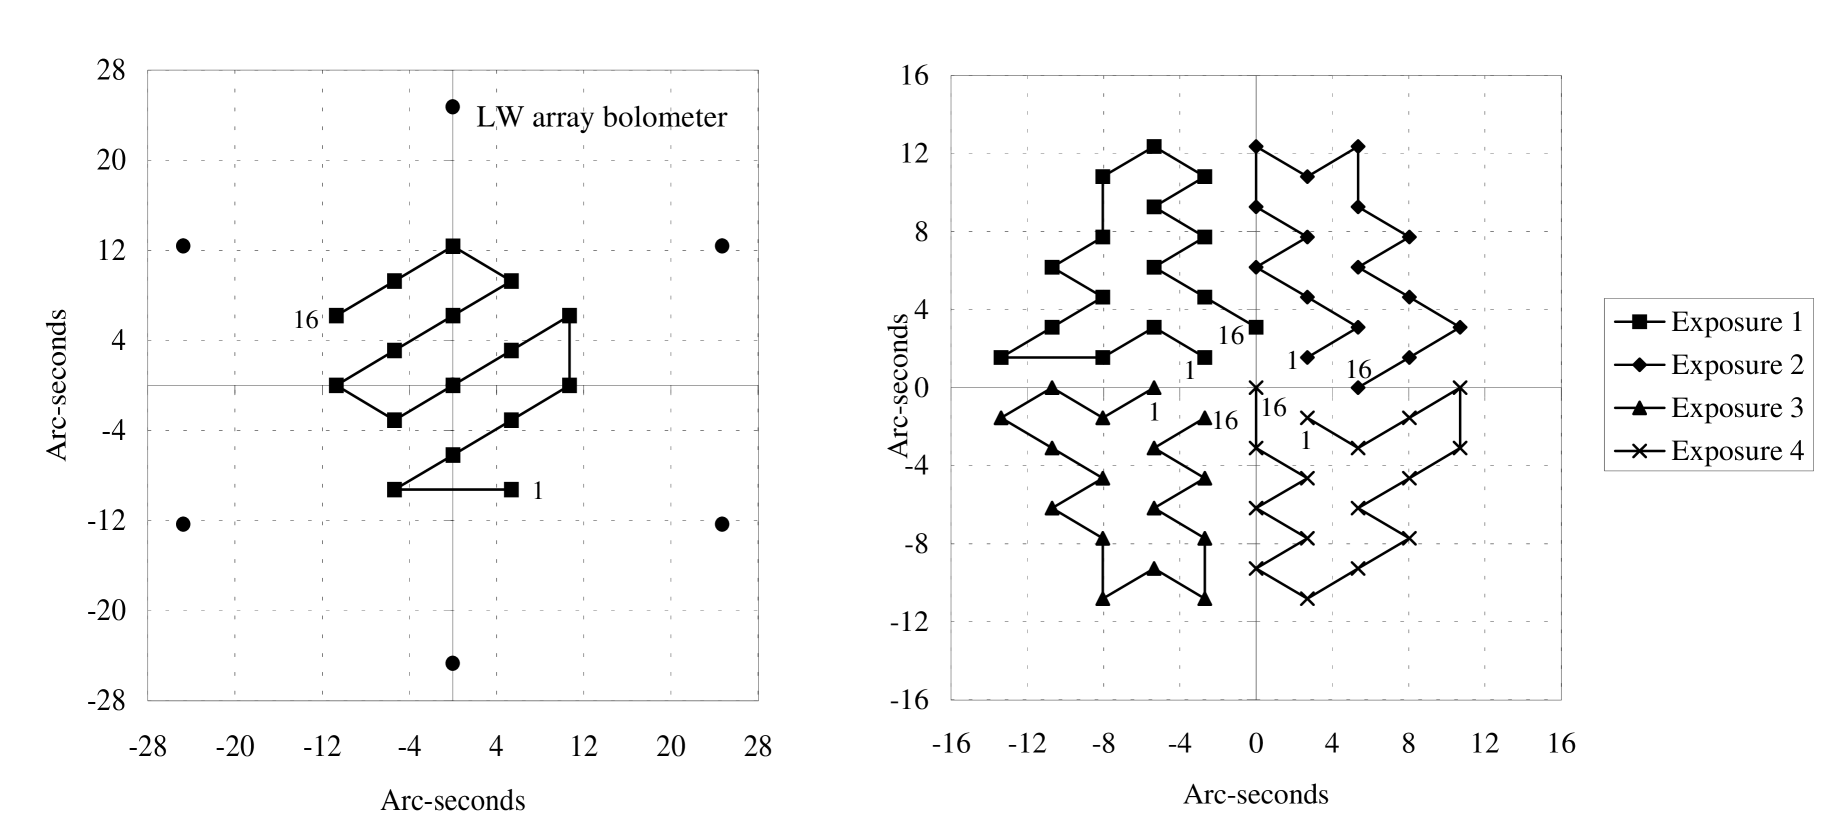
7.3 Jiggle-mapping
For sources that are extended but still smaller than the array field-of-view, jiggle-mapping is the preferred observing mode. This mode is also useful when searching for point-like sources in a blank field. As mentioned in section 2, the arrangement of the SCUBA bolometers is such that the sky is instantaneously under-sampled. For an individual array, 16 offset positions are needed to produce a fully-sampled map (as shown in Figure 4a for the LW array). For dual-wavelength imaging (eg. at 450 and 850 m) it is necessary to carry out a 64 point jiggle pattern with 3 arcsec sampling. This ensures that the area between the LW array pixels is covered at the resolution required to fully-sample the SW array (the spacing of the SW bolometers is about half that of the LW). Since the telescope is nodded to remove the sky background, a 64 point jiggle therefore requires 128 sec to complete. It is highly likely that the sky emission will change over such a timescale and the 64 point jiggle is therefore split into four sets of 16, with the telescope nodding every 16 seconds (see also Figure 4b). Jiggle-maps can be coadded to improve the S/N.
For the telescope user, one remaining issue to consider in setting up photometry and/or jiggle-map observations is the size and direction of the chop throw. The chop throw and direction are determined primarily by the morphology or type of the astronomical source being imaged. Chopping is normally undertaken in azimuth in order to best cancel the sky emission, but for some source geometries, specific RA or Galactic co-ordinates might be required. Chop size is typically 120 arcsec in order to chop off the array, larger chop throws will usually lead to a degradation in the quality of an observation through reduced sky-background cancellation (see section 9). Chop throws as small as 30 arcsec have been used successfully to search for point sources.
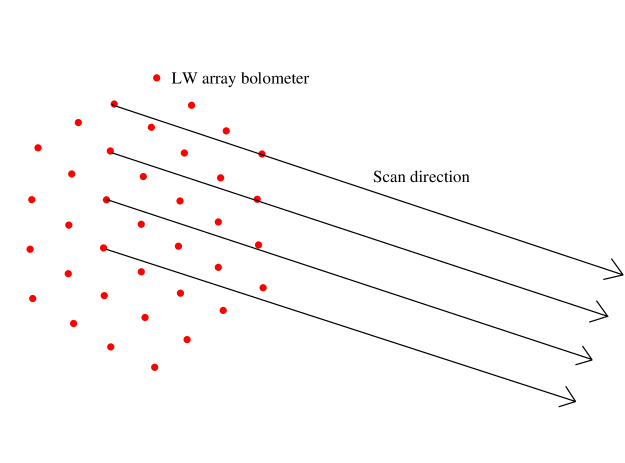
7.4 Scan-mapping
Scan-mapping is used to map regions that are large compared with the array field-of-view. This is an extension of the raster-mapping technique used by single-element photometers (e.g. UKT14), where the telescope is scanned across a region whilst chopping to produce a differential map of the source. The SCUBA arrays have to be scanned at one of 6 angles to produce a fully-sampled map (see Figure 5). The traditional method of raster-mapping involves scanning and chopping in the same direction (Emerson, Klein and & 1979), resulting in a map that has the source profile convolved with the chop. However, restoring the source data by deconvolving the chop from the measured map produces problems at spatial frequencies where the Fourier transform (FT) of the chop (a sine wave) is low or near-zero. This introduces noise into the restored map. To minimise these effects, data are currently acquired using a revised method first described by Emerson (1995) where maps of the same region are taken with several different chop throws and directions (usually three throws, chopping in both RA and Dec). This ensures that the zeroes of one chop FT do not coincide with the zeroes of another. The individual maps are Fourier transformed and coadded, each weighted according to the sensitivity of the chop and throw, and then transformed back to give the final image. This method, which is known locally as the Emerson II” technique, has been shown to produce substantial improvements in S/N over the original technique (Jenness et al. 1998c).
In practice, the telescope is scanned at a rate of 24 arcsec per second, with a chop frequency of 7.8 Hz, giving 3 arcsec sampling along a scan length. A substantial overlap of the array (about half the diameter) between scans is usually adopted to minimise the effects of field rotation. As with photometry and jiggle-map, successive scans or maps over the same region can be coadded together to improve the S/N.
7.5 Polarimetry
Polarisation measurements with SCUBA require additional hardware in the form of a photo-lithographic analyser to select one plane of polarisation along with a rotating half-waveplate. Achromatic waveplates have been developed to allow simultaneous imaging using both arrays (Murray et al. 1997). Photometry or fully-sampled maps are taken at a number of waveplate positions, and the amplitude and phase of the resulting sinusoidal modulation of the signal is used to deduce the degree of linear polarisation and the position angle. Corrections are applied to the data for instrumental polarisation contributions (due to the instrument and telescope optics, and also the JCMT membrane) and sky rotation. At time of writing this observing mode has been commissioned in single-pixel mode, with the prospects of full-imaging polarimetry by the end of 1998.
8 The SCUBA queue and flexible scheduling
SCUBA comes with its own queue software. This enables effective execution of the observing programme through a series of macros. These are arranged into an observing queue and their order can be changed at any time (using observation definition files or ODFs – see section 10). The queue runs automatically and when the top observation in the queue is reached, the telescope drives to the source, the SCUBA parameters are set up and the observation is performed. This continues without intervention until the queue is empty. The use of a queue system along with careful pre-planning goes a long way in maximising the efficiency of the observing process.
As can be seen from Figure 3, even in the transmission windows the atmosphere is severely attenuating, especially at 450 and 350 m. Because of the variability of transmission ( and hence detection performance) with a change of water vapour content, to obtain maximum efficiency for the facility it is crucial to match the programme requirements to the weather conditions prevailing at the time. Scientific programmes are awarded telescope time by the Time Allocation Groups (TAGs) with an associated weather flag that specifies the range of weather conditions in which they can be undertaken. Those programmes requiring the very driest conditions are labeled Band 1, whilst programmes that can be undertaken in relatively wet conditions, such as bright sources using the 230 GHz spectral-line receiver, are allocated to Band 5.
The programmes are awarded an overall scientific priority and are then broken down into weather groups at the JCMT. Templates provided by the Principal Investigator (PI) can then be used to enable the observations to be undertaken, even without the presence of the PI. This mode of operation began in February 1998 and a new software suite is currently being produced to enable visiting observers to identify which programmes should be undertaken in the prevailing weather conditions according to scientific priority. This software also provides pipeline data processing, data tracking and observing programme management tools. The SCUBA observations represent the first step in the move of the JCMT to a fully flexibly scheduled facility using weather-based and scientifically prioritised queues.
9 Calibration and sky noise removal
9.1 Extinction correction
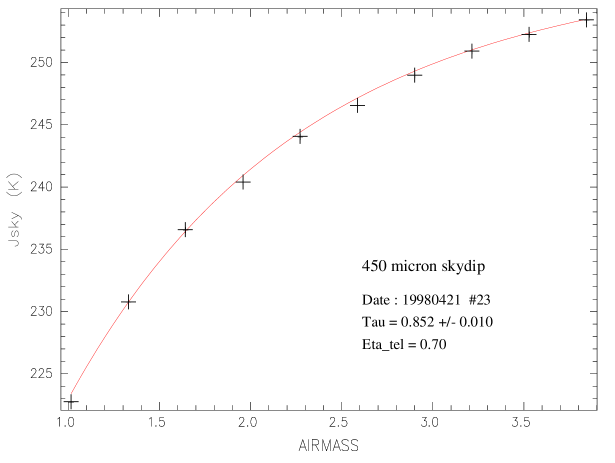
The determination of the atmospheric attenuation of a source signal is critical for the calibration of data in the submillimetre waveband. The method adopted by SCUBA for measuring the atmospheric transmission is the technique of skydipping. During a skydip the sky brightness temperature is measured as a function of elevation (usually between 80 and 15 degrees) with absolute temperature reference being provided by a hot-load at ambient temperature and a cold-load at 45 K. With a knowledge of the telescope transmission it is then possible to fit the data and derive a value for the zenith sky opacity (Hazell 1991). Skydips can be performed at two wavelengths simultaneously (as for the other observing modes), and take about 5 minutes to complete. An example of a skydip taken at 450 m is given in Figure 6. It is possible that in the future an almost instantaneous estimate of the line-of-sight opacity should be possible from a hot-cold-sky measurement at the elevation of the source, given a database of sky temperature versus elevation information.
The nearby CSO operates a 225 GHz radiometer (‘the CSO tau-meter’) that performs a skydip in a fixed direction every 10 minutes. The relationships between the various SCUBA wavebands and the CSO tau-meter are now well-established (Robson et al. 1998) and this provides additional assistance in the calibration of data. The CSO tau-meter is used extensively as an indicator of the conditions before and during an observing session, and defines the weather-band for a particular night (and consequently which programmes are to be undertaken).
9.2 Sky noise and its removal
In addition to attenuating the source signal, the atmosphere and immediate surroundings of the telescope contribute thermal radiation that is often several orders of magnitude greater than the target signal. On many occasions the primary limit to sensitivity, particularly for deep integrations at the shorter wavelengths, arises from ‘sky noise’. Sky noise manifests itself in a DC offset and in spatial and temporal variations in the emissivity of the atmosphere on short timescales. Chopping and nodding removes the DC offset, but since the chopped beams travel through slightly different atmospheric paths, the effects of sky variability are not removed completely. Reducing the chop throw is a standard and well-tested method of decreasing the effects of sky noise, and for point-source photometry, chop throws of only 30-40 arcsec are usually adopted. Increasing the throw to 120 arcsec to ensure chopping off the array for an extended source, can produce a degradation in S/N of up to a factor of 2.
One obvious advantage in using the SCUBA arrays to observe compact sources (say less than an arcminute or so in diameter) is that there will be a number of pixels that are viewing the ‘blank sky’ around the source. Subtracting the average level of these blank pixels from the source has been shown to improve the S/N of an observation by up to a factor of 3. This is illustrated in the mapping observation shown in Figure 7, in which the output of the central pixel of the LW array at 850 m, and the average of the outer 18 pixels (‘LW sky’) are plotted. The noise on each trace is clearly correlated to a high degree, which results in a significant improvement in S/N when subtracted (‘Centre pixel – Sky’). Also in this figure is a trace of the SW sky at 450 m (again from edge pixels) which demonstrates that sky noise is well correlated between the arrays. Any number of ‘sky pixels’ can be selected in the data reduction (usually the more pixels selected the better the S/N) although care has to be exercised to ensure there is no ‘contaminating’ source signal in these pixels. More details of current sky noise removal algorithms are given in Jenness et al. (1998c).

Whereas for the photometry and jiggle-mapping modes we have some idea which bolometers are always looking at sky, for scan-map data the situation is somewhat different since any bolometer can be on sky or source at a given time. This problem is currently overcome by first removing the source from the data stream before calculating the sky contribution. This is possible because the source structure should be constant over time whereas the sky is assumed to vary over the array on timescales of several seconds. The source signal is removed from the raw demodulated data leaving a dataset that should contain only intrinsic sky emission noise. This sky signature is then removed from the original raw data, and the image regenerated. An example of the improvement that this technique generates for scan map data can be found in Jenness et al. (1998c). One additional advantage of this technique is that it works for both scan- and jiggle-mapping and removes the need to specify individual pixels that view sky alone.
9.3 Calibration
Primary calibration is taken from Mars (Wright 1976) and Uranus (Orton et al. 1986). The fluxes of the planets are provided on the JAC worldwide-web page (Privett et al. 1997) and the astronomer can use these data along with the beamsizes at the time of the observation to determine calibration to a high degree of accuracy. Where planets are not available, a list of secondary calibrators is being provided by the facility (Sandell et al. 1998). It has been shown to be important that the calibrators are observed in an mode identical to the programme sources. Selection of many modes (photometry, jiggle- and scan-mapping) during a single shift increases the calibration overheads significantly.
10 Observing tools and the user-interface
10.1 Observation definition files
Prior to programme submission a number of observing planning tools are available to determine, for example, the necessary integration time to reach a certain S/N or rms noise level. The use of the Integration Time Calculator in the application process means that the TAGs have the correct information to hand, and staff astronomers no longer need go through the detailed calculations for each application, a notable saving of staff time. Other tools for determining source position and optimum time for an observation are also provided.
At the telescope an individual observation, such as a single map or a single photometric measure of a source, is contained within an observation definition file (ODF), which is the basic unit of the observing system. The ODF specifies everything about the observation, ranging from the source name (and co-ordinates if it is not in the telescope or observer catalogue), the wavelength of observation, type of observation (photometry, mapping), number of jiggles, jiggle spacing, integration time, number of integrations, etc. Frequently only a small selection of these parameters require changing by the user, and so it is very easy to build up a library of ODFs. Special ODFs are also provided for pointing, focusing and skydips, as well as for calibration.
The ODFs can be stacked together if needed to make up an observation macro. This is the usual case where a number of individual measurements are to be undertaken for a single source. In this case, the macro is called from the queue and the telescope and SCUBA then perform the ODFs sequentially until they are complete, or until the user halts or extends the process to optimise the S/N. An example of a macro for performing photometry on, say, 3C273, is one that first calls for a pointing observation of the source at 850 m; the telescope subsequently centres 3C273 precisely on the central bolometer (usually, but not necessarily) of the LW array; photometry for a set number of integrations is then taken at 850/450 m; the filters changed to perform 750/350 m photometry and, finally, the telescope is offset to undertake 1.1, 1.35 and 2.0 mm observations. All this is done automatically and very efficiently and the data are displayed to the user in real time.
10.2 Real-time display and data reduction
The use of ODFs and macros makes queue observing very efficient. A Telescope System Specialist (TSS) usually monitors the status of the queue, whilst the observer (or TSS) can insert or re-order ODFs based on information from the on-line display and the requirements of the observing programme. The on-line software provides the user with valuable information concerning the progress of an observation. For photometry mode, the output signal from the selected pixel(s) are displayed graphically, and the S/N of both individual data points and the resulting coadd are tabulated. For mapping, images are displayed on a re-sampled RA-Dec plane, and (under stable conditions) the S/N can be seen to build up in real-time. The on-line display can also be made available to remote observers via the WORF system (Jenness et al. 1998a).
Only rudimentary data processing is produced by the on-line display; at the present time, calibration or sky-noise removal are not applied, and successive observations of the same source cannot be coadded together. However, once an observation is completed, the raw data (stored in addition to the quick-look data) can be re-processed using the SCUBA User Reduction Facility (SURF, Jenness and Lightfoot 1998a,b). This allows a comprehensive analysis of an observation to be undertaken, including calibration, extinction correction and sky noise removal. In general, it is possible to keep up with the data reduction, but ideally we would like the data to be processed by a reduction pipeline as soon as an observation is complete. For this reason we have recently developed a data reduction pipeline based on the UKIRT ORAC system (Economou et al. 1998) and SURF. This pipeline is currently undergoing testing and should be available at the telescope in the Autumn of 1998. An additional advantage is that such a system can be used off-line as well as at the telescope, and so should make the reduction of SCUBA data almost completely automatic.
| Wavelength | Best NEFD | Average NEFD |
|---|---|---|
| (m) | (mJy/) | (mJy/Hz1/2) |
| 350 | 1000 | 1600 |
| 450 | 450 | 700 |
| 750 | 110 | 140 |
| 850 | 75 | 90 |
| 1100 | 90 | 100 |
| 1350 | 60 | 60 |
| 2000 | 120 | 120 |
| Wavelength | NEFD | 1-hr | 10-hrs | 25-hrs |
|---|---|---|---|---|
| (m) | (mJy/Hz1/2) | (mJy) | (mJy) | (mJy) |
| 350 | 1000 | 83 | 26 | 17 |
| 450 | 450 | 38 | 12 | 7.5 |
| 850 | 75 | 6.3 | 2.0 | 1.3 |
| 1350 | 60 | 5.0 | 1.6 | 1.0 |
11 Telescope Performance
11.1 Sensitivity
The overall sensitivity on the telescope is represented by the noise equivalent flux density (NEFD), the flux density that produces a S/N of unity in a second of integration. The NEFD, particularly at the shorter wavelengths, depends very much on the weather, and on many occasions the fundamental limit to sensitivity is governed by the aforementioned sky noise (section 9.2). Table 1 summarises the per-pixel measured NEFD at all wavelengths after sky noise removal under the best and average conditions at each wavelength. These represent an order of magnitude improvement over the previous bolometer instrument at the JCMT. In Table 2 we present 5- detection limits based on the best NEFDs for 1, 10 and 25 hours of on-source integration time.
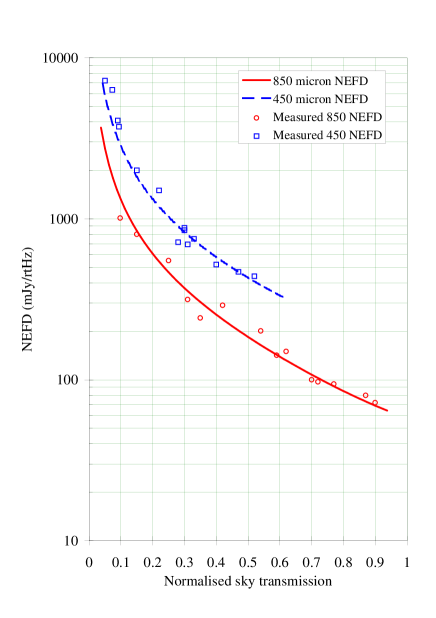
Since the instrument is predominantly background-limited from the sky, the NEFD will vary with sky transmission, particularly at the submillimetre wavelengths. From a knowledge of the components in the optical path between the detectors and the sky, it is possible to construct a model of how the NEFD varies as a function of sky transmission (see Holland et al. 1998b). Figure 8 shows how the calculated NEFDs at 450 and 850 m vary with sky transmission. Also on this plot are some measured values from long ( 15 min) photometry observations, showing excellent agreement between the model and the measured points.
One of the primary scientific goals for SCUBA is to make deep integrations of faint sources over a period of many hours, and so it is crucial that the noise integrates down in a predictable way. Figure 9 shows data coadded over a period of almost 5 hours, in which the standard error (solid line) integrates down with time as approximately t-1/2 (Ivison et al. 1998a).
11.2 Optical performance
The SCUBA optical system is almost entirely an all-mirror design, and includes several off-axis mirrors to fold the telescope beam into a reasonably compact volume. Even though complex mirror shapes minimise aberrations to a large extent, some field curvature in the focal plane is inevitable. In addition, the bolometers have a range of optical responsivities (Holland et al. 1998b). Hence, the positions and relative responsivities of the bolometers must be accurately known for image re-sampling to work properly. The arrays are therefore flatfielded by scan-mapping the telescope beam over a bright point-like source (e.g. Mars or Uranus). The flatfield has been found to remain extremely constant over time.

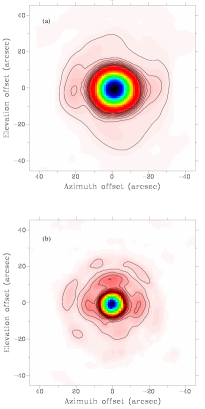
Diffraction-limited performance is illustrated at 450 and 850 m in Figure 10. These maps are centred on each array and are a jiggle map of Uranus, chopping 60 arcsec in azimuth (E-W in the figure). The measured FWHM beam sizes are 7.8 and 13.8 arcsec at 450 and 850 m respectively.
12 Scientific Results
A number of results from SCUBA have already been published and here we illustrate just a few examples of SCUBA’s potential. Two techniques stand out that have brought major breakthroughs in submillimetre science: deep imaging and large-scale mapping.
An example of a bright 450 m SCUBA jiggle-map image is shown in Figure 11. This is the Eagle Nebula (M16). Some differences are evident immediately between the HST optical image and the submillimetre map. Note the increased thermal emission from the tips of the ‘fingers’, totally invisible on the optical image, possibly revealing the very earliest phases of star formation – the ‘pre-protostellar phase’ (White et al. 1998). The image is a two-field mosaic that was obtained in about 3 hours of total observing time (which also included an 850 m image). The peak flux of the brightest finger is 6 Jy/beam, and the 1- noise in the map is approximately 80 mJy/beam over an area of 6.5 arcmin2. The equivalent time for the same S/N using SCUBA’s predecessor would have been over 10,000 hours!
One of the long-standing challenges of infrared and submillimetre astronomy is the understanding of the earliest stages of star formation. SCUBA is already showing the power of deep imaging to discover new candidate protostars, as well as obtaining reliable statistics on the early stages of stellar evolution, including the protostellar Class 0 phase. Recent interest has centred on pre-stellar cores” which are significant in that they constrain the initial conditions of protostellar collapse. Over 40 such cores have already been studied by SCUBA, with more detections than would be predicted by simple ambipolar diffusion models (Ward-Thompson et al. 1998). Unbiased surveys of extended dark clouds are also underway to identify complete samples of protostellar condensations, allowing the measurement of star formation efficiencies, mass-accretion rates and evolutionary lifetimes (Visser et al. 1998).
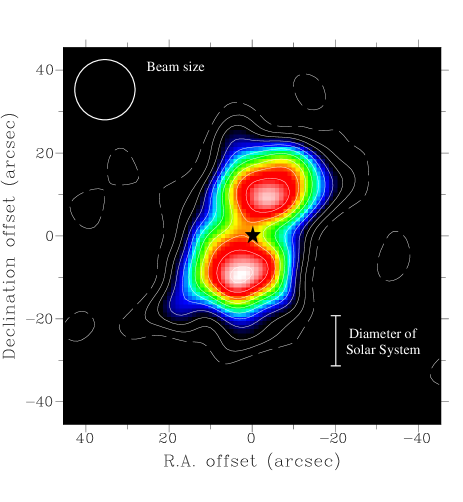
Observations of circumstellar disks of dust can give clues to the existence of rocky, Earth-like planets from which they form. SCUBA is well-suited to measure the low-level thermal emission from dust grains in such disks. Figure 12 is a 6 hour 850 m jiggle map of the nearby main-sequence star Fomalhaut. This star was known to have excess far-infrared emission from IRAS observations, but until the introduction of SCUBA it had been impossible to image the dust structure in any detail. The peak flux in the map (28 mJy/beam) occurs in two distinct peaks, offset from the star position by about 10 arcsec to the north and south. The image is consistent with an edge-on torus (doughnut) structure with a central cavity containing significantly less dust emission. The cavity is about the diameter of Neptune’s orbit, and a possible explanation is that the region has been cleared of gas and dust by the formation of planetesimals (Holland et al. 1998a).
The most vigorously star-forming galaxies in the nearby Universe are also those in which dust obscuration is the most significant. It was long suspected, therefore, that the early evolution of galaxies would take place inside shrouds of dust. The first deep SCUBA maps outside the Galactic plane immediately confirmed this suspicion, revealing a large population of hitherto unknown, star-forming galaxies. This discovery was reported by Smail et al. (1997) and subsequent blank-field surveys (Barger et al. 1998; Eales et al. 1998; Hughes et al. 1998) have confirmed that the surface density of submillimetre sources is several orders of magnitude above that expected for a non-evolving galaxy population. Strongly star-forming galaxies must have been substantially more common in the early Universe than they are today. The source-confusion limits due to these dusty galaxies have important consequences for the design and operation of planned and existing mm/sub-mm telescopes (Blain, Ivison & Smail 1998a).
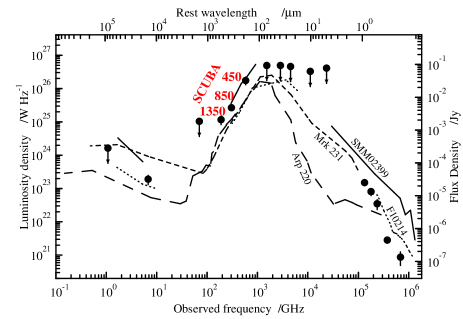
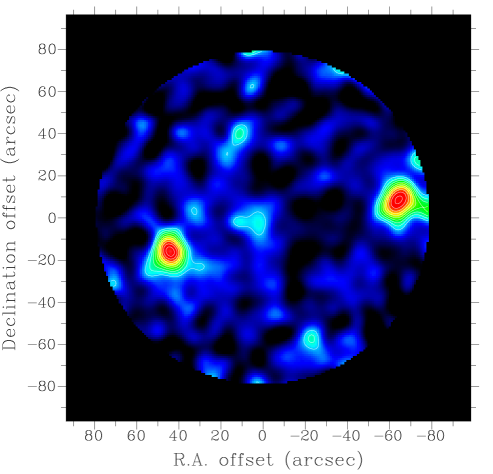
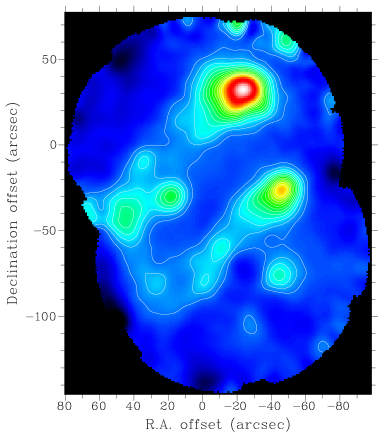
These first deep submillimetre surveys imply that a large population of dusty galaxies is missing from optical inventories of star-formation activity (Blain et al. 1998b). Further support for this was obtained with the submillimetre detection of an extremely red galaxy, HR 10, at . This is a relatively common class of galaxy previously thought to consist of very old, quiescent ellipticals, but which SCUBA has revealed to be young, star-forming systems similar to local ultraluminous IRAS galaxies (ULIRGs) (Cimatti et al. 1998; Dey et al. 1998). The distant, submillimetre-selected galaxies discovered by Smail et al. (1997) also resemble ULIRGs, at least in the rest-frame ultraviolet/optical, with a similar proportion of mergers (Sanders & Mirabel 1996; Smail et al. 1998a). The spectral energy distribution of HR 10 is shown in Figure 13, and an example of a deep 850 m image revealing dusty, extremely luminous galaxies behind a massive galaxy cluster is shown in Figure 14.
The study of galaxies with active galactic nuclei (AGN) has also been revolutionised by SCUBA. Use of the jiggle-map mode led to the discovery of SMM 023990136, a hyperluminous galaxy at hosting an AGN (Ivison et al. 1998b; Frayer et al. 1998). Such galaxies cannot be easily detected in conventional AGN/QSO surveys, so the presence of SMM 023990136 in the very first submillimetre image of the distant Universe may suggest that estimates of the prevalence of AGN may require substantial revision.
The unprecedented sensitivity of SCUBA’s photometry mode has allowed the study of radio- and optically-selected AGN to move from the pioneering world of bare detections to the reliable extraction of physical parameters. For the high-redshift radio galaxy, 8C 1435+635, Ivison et al. (1998a) presented 450 and 850 m detections of sufficient quality to infer that the formative starbursts of such massive ellipticals may still be in progress at . Observations of a complete sample of radio galaxies spanning a range of redshifts and radio luminosities will be presented by Dunlop et al. (1998).
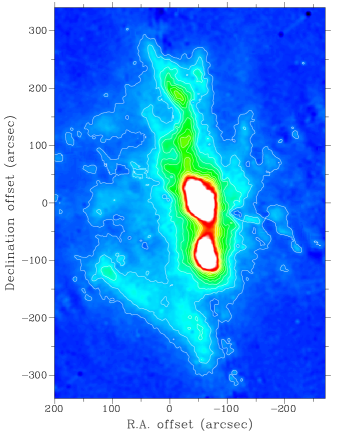
Finally, as an illustration of the power of SCUBA to map large areas, Figure 15 shows a 850 m scan map of the central region of the Orion Molecular Cloud (OMC). This 8 10 arcmin commissioning map was obtained in just 50 minutes of integration time, and has a noise level of about 60 mJy/beam. The famous Orion “Bright-Bar” is clearly seen in the image, as well as the little-studied embedded protostellar ridge in the north. The region is also believed to be a site of progressive star formation (from the south to the north), and so offers an opportunity to compare dust core properties over a range of evolutionary stages. This map is taken from a paper by Greaves and Holland (1998), and would have been impossible for UKT14 at the JCMT in a reasonable amount of observing time. A much larger region of the OMC has since been imaged using the Emerson II” technique and is described by Johnstone et al. (1998).
13 Current and future developments
SCUBA is a continually evolving instrument. There are a number of identified improvements both in terms of observing strategies and sensitivity gains. These are briefly described in this section.
13.1 Observing modes
A new mode of ‘fast data sampling’ is currently under investigation. Here, the chopping component and the image sampling are merged together into one step pattern (Le Poole & van Someron Greve 1998) which is completed as rapidly as possible (twice per second) in order to compensate for any sky variabilities. This is repeated many times to build up the source integration time. There are two immediate benefits. The removal of the requirement for a bolometer to look at blank sky for 50 % of the time (during the ‘off’ cycle of the nod), which, for the same reasons as two bolometer chopping on the array, can in principle bring an efficiency improvement of a factor of two. Also, because the pattern is very much faster than a conventional 16 sec jiggle, there is potential for real-time reduction of sky noise in the resulting data. This mode is undergoing telescope testing in mid-1998.
It is generally agreed that the best method for sky-noise suppression is to use three-position chopping (Papoular 1983). This works best for compact sources where the two ‘off’ beams are themselves sampled by other bolometers on the array. In principle, this technique should give a factor of improvement in noise. Tests are ongoing at the telescope and it is likely that this mode will be released early in 1999.
13.2 Sensitivity improvements
Although the sensitivity per SCUBA pixel is approximately an order of magnitude better than the previous instrument, it is expected that there are still substantial gains to be made. One obvious way to improve the SW array performance in particular, is by improving the large scale surface accuracy of the telescope primary mirror. A programme is underway to accomplish this, and by Autumn 1999 it is expected that the 450 m NEFD per pixel will improve by a factor of approximately 2 under good observing conditions.
There are significant discrepancies between the estimated and measured optical efficiencies at all SCUBA submillimetre wavelengths. The cause of this loss is thought to be due to a interaction between the array feedhorns and the filters (which are in close proximity). It is possible that a large array of feedhorns so close to the filters modifies the effective terminating impedance of the filters, resulting in a change in their reflectance coefficients. The net result is that the horn beams leaving the filter drum enclosure are considerably broader than when measured individually. If the beams are sufficiently wide that they over-illuminate the internal mirrors then not only will the signal coupling to the telescope be reduced, but additional photon noise will be introduced from the 45 K optics box. If the horn beams themselves cannot be corrected, one possible way of counteracting the rise in photon noise would be to terminate the spillover on a colder surface. An additional radiation shield at a temperature of 10 K would be complex and difficult to manufacture but is nevertheless being considered. An alternative solution would be to use a helium liquifier to cool the optics box to around 4 K. Full cost-benefit analyses of these options have yet to be undertaken; if proven viable it will not be in place before early 2000.
FTS filter measurements of the photometric pixels revealed a deep fringe roughly in the centre of the observed profile, and the depth of the fringe increased with wavelength. All the bolometers are the same and the cavities do not scale with wavelength. Consequently, at the longer wavelengths, where fewer modes propagate, the integrating properties of the cavity are diminished. A simple ‘tuning’ of the cavity for the 1350 m pixel (moving the waveguide closer to the substrate) gave an immediate factor of two improvement in NEFD. Such gains should also be expected at 1.1 and 2.0 mm, although it is unlikely that there will be any significant gains at the array wavelengths.
13.3 Noise performance
There are some 10 % of pixels that do not meet the noise specification (Holland et al. 1998b). The noise has a characteristic 1/frequency signature, and is thought to be due to poor contacts in the ribbon cables. Fortunately, there has not been a deterioration in noise performance (e.g. due to oxidisation or moisture when the instrument is opened). A new ribbon cable technology, being developed by the UK ATC, Edinburgh, should eliminate this problem. New cables are expected in early 1999.
One of the early problems encountered with SCUBA on the telescope was an unexpected sensitivity to vibration from the secondary mirror unit (SMU). This affected about 10 % of pixels, in addition to those suffering from 1/f noise. The demodulation of the chop and calibrator signals was severely affected by the dominant 5th harmonic of the chop at around 40 Hz. Increasing the risetime of the chopper waveform by about 2 msec and providing a smoother transition at the end of the cycle improved the situation dramatically without a noticeable loss in on-source efficiency (and consequently NEFD). Although several pixels remain sensitive to SMU vibration, particularly for large chop throws, this is no longer a major concern. However, the fast-data sampling” mode is sensitive to a wider range of frequencies (0.5 - 30 Hz) than the conventional observing modes. Features caused by telescope resonances (induced by drive motors and compressors) around 25 - 30 Hz are evident in the bolometer frequency spectra. This is currently the limiting factor to achieving the efficiency improvements described in section 13.1. A major mid-life electronics upgrade to reduce the sensitivity to vibration by using differential amplifiers is currently being considered.
13.4 Array upgrades
Bolometer array technology has advanced quite significantly since the design of SCUBA. It is possible that SCUBA could be upgraded to take advantage of the planar arrays which are currently being developed, e.g. for the SPIRE bolometer instrument aboard the Far-Infrared and Submillimetre Space Telescope (Griffin et al. 1998). Filled absorber arrays without feedhorns, and containing perhaps many hundreds of detectors, have an added potential of a gain of about three in mapping speed compared to the 2-spaced SCUBA bolometers. Once the number of pixels increases much beyond about 200, more novel signal readout schemes are also needed; this technology is currently being developed.
14 Conclusions
SCUBA has proven to be an extremely powerful and versatile camera for submillimetre astronomy. Background photon noise limited performance on the telescope has been achieved by cooling the detectors to 100 mK and careful design of the focal plane optics. With an order of magnitude improvement in per-pixel sensitivity over the previous (single-pixel) instrument, and over 100 detectors in two arrays, SCUBA can acquire data approaching 10,000 times faster than was possible previously. It is clear that with this huge increase in performance, SCUBA will make big advances in submillimetre astronomy for many years to come.
ACKNOWLEDGMENTS
The JCMT is operated by the Joint Astronomy Centre, on behalf of the U.K. Particle Physics and Astronomy Research Council, the Netherlands Organisation for Pure Research, and the National Research Council of Canada. RJI is supported by a PPARC Advanced Fellowship. We take this opportunity to thank all those people involved in the design, construction, testing and commissioning of SCUBA. The image of the galaxy cluster, A1835, is reproduced with the kind permission of Ian Smail and Andrew Blain. Further details and updated information can be found on the SCUBA world-wide webpage at URL: http://www.jach.hawaii.edu/JCMT/scuba.
References
- [1] Barger A.J., Cowie L.L., Sanders D.B., Taniguchi Y., Sato Y., Kawara K., Okuda H., 1998, Nature 394, 248
- [2] Barvainis R., Antonucci R., Hurt T., Coleman P., Reuter H.-P., 1995, ApJ 451, L9
- [3] Blain A.W., Ivison R.J., Smail I., 1998a, MNRAS 296, L29
- [4] Blain A.W., Smail I., Ivison R.J., Kneib J.-P., 1998b, MNRAS in press (astro-ph/9806062)
- [5] Broadhurst T., Lehár J., 1996, ApJ 450, L41
- [6] Cimatti A., Andreani P., Rottgering H., Tilanus R. P., 1998, Nature 392, 895
- [7] Church S.E. & Hill R.E. 1990, in Radio Astronomical Seeing, Eds. Baldwin J.B. & Wang Shouguan, URSI/IAU Symposium 75.
- [8] Cunningham C.R. et al. 1998, in preparation
- [9] Cunningham C.R., Hastings P.R., Strachan J.M.D., 1995, Cryogenics 35, 6, 339
- [10] Davis C. et al. 1998, in preparation
- [11] Dey A., Graham J.R., Ivison R.J., Smail I., Wright G.S., 1998, ApJ submitted
- [12] Dunlop J.S., Hughes D.H., Rawlings S., Eales S.A., Ward M.J., 1994, Nature 370, 347
- [13] Dunlop J.S., Hughes D.H., Rawlings S., Eales S.A., Archibald E.N., 1998, in preparation
- [14] Duncan W.D., Robson E.I., Ade P.A.R., Griffin M.J., Sandell G., 1990, MNRAS 243, 126
- [15] Eales S.A., Lilly S.J., Gear W.K., Dunne L., Bond J.R., Hammer F., Le Fevre O., Crampton D., 1998, ApJ submitted (astro-ph/9808040)
- [16] Economou F., Bridger A., Wright G.S., Rees N.P., Jenness T., 1998, in Astronomical Data Analysis Software and Systems VII, Eds. Albrecht R., Hook R.N. & Bushouse H.A., ASP Conf. Ser. 145, 196
- [17] Edge A.C., Ivison R.J., Smail I., Blain A.W., Kneib J.-P., 1998, MNRAS submitted
- [18] Emerson D.T., Klein U., Haslam C.G.T., 1979, A&A 76, 92
- [19] Emerson D.T., 1995, in Multi-feed systems for radio telescopes, Eds. Emerson D.T. & Payne J.M., ASP Conference Series 75, 327
- [20] Frayer D.T., Ivison R.J., Scoville N.Z., Yun M., Evans A.S., Smail I., Blain A.W., Kneib J.-P., 1998, ApJ in press (astro-ph/9808109)
- [21] Gear W.K. et al., 1998, in preparation
- [22] Greaves J.S., Holland W.S., 1998, in preparation
- [23] Greaves J.S., Holland W.S., Moriarty-Schieven G., Jenness T., Dent W.R.F., Zuckerman B., McCarthy C., Webb R., Butner H., Walker H., Gear W.K., 1998, ApJ Lett in press (astro-ph/9808224)
- [24] Griffin M.J. & Holland W.S., 1988, Int.J.IR&mm waves 9, 861
- [25] Griffin M.J., Vigroux L., Swinyard B., Cunningham C.R., 1998, Proc SPIE Vol. 3357, Ed. Phillips T.G., in press
- [26] Hazell A.S., 1991, Ph.D Thesis, QMW (University of London)
- [27] Holland W.S., Ade P.A.R., Griffin M.J., Hepburn I.D., Vickers D.G., Cunningham C.R., Hastings P. R., Gear W.K., Duncan W.D., Baillie T.E.C., Haller E.E., Beeman J.W., 1996, Int.J.IR&mm waves 17, 669
- [28] Holland W.S., Greaves J.S., Zuckerman B, Webb R., McCarthy C., Coulson I.M., Walther D., Dent W.R.F., Gear W.K., Robson E.I., 1998a, Nature 392, 788
- [29] Holland W.S., Cunningham C.R., Gear W.K., Jenness T., Laidlaw K., Lightfoot J.F., Robson E.I., 1998b, Proc SPIE Vol. 3357, Ed. Phillips T.G., in press (astro-ph/9809121)
- [30] Hughes D.H., Serjeant S., Dunlop J.S., Rowan-Robinson M., Blain A.W., Mann R.G., Ivison R.J., Peacock J., Efstathiou A., Gear W.K., Oliver S., Lawrence A., Longair M., Goldschmidt P., Jenness T., 1998, Nature 394, 241
- [31] Israel F.P., van der Werf P.P., Tilanus R.P.J., 1998, A&A in press (astro-ph/9806271).
- [32] Ivison R.J., Archibald E.N., Dey A., Graham J.R., 1997, in The Far-Infrared and Submillimetre Universe, Ed. Wilson A., ESA Vol. SP-401, Noordwijk : ESA publications, p281
- [33] Ivison R.J., Dunlop J.D., Hughes D.H., Archibald E., Stevens J.A., Holland W.S., Robson E.I., Eales S.A., Rawlings S., Dey A., Gear W.K, 1998a, ApJ 494, 211
- [34] Ivison R.J., Smail I., Le Borgne J.-F., Blain A.W., Kneib J.-P., Bezecourt J., Kerr T.H., Davies J.K., 1998b, MNRAS 298, 583
- [35] Ivison R.J. et al. 1998c, in preparation
- [36] Jenness T., Economou F., Tilanus R.P., 1997, In Astronomical Data Analysis Software and Systems VI, Eds. Hunt G. & Payne H.E., ASP Conf. Series 125, 401
- [37] Jenness T., Lightfoot J.F., 1998a, Starlink User Note 216, Starlink Project, CLRC
- [38] Jenness T., Lightfoot J.F., 1998b, in Astronomical Data Analysis Software and Systems VII, Eds. Albrecht R., Hook R.N. & Bushouse H.A., ASP Conf. Ser. 145, 216
- [39] Jenness T., Lightfoot J.F., Holland W.S., 1998c, Proc SPIE Vol. 3357, Ed. Phillips T.G., in press (astro-ph/9809120)
- [40] Johnstone D. et al. 1998, in preparation
- [41] Kreysa E. et al., 1998, Proc. SPIE Vol. 3357, Ed. Phillips T.G., in press
- [42] Le Poole R. & van Someron Grieve H., 1998, Proc SPIE Vol. 3357, Ed. Phillips T.G., in press
- [43] Lightfoot J.F., Duncan W.D., Gear W.K., Kelly B.D., Smith I.A., 1995, in Multi-feed systems for radio telescopes, Eds. Emerson D.T. & Payne J.M., ASP Conference Series 75, 327
- [44] Murray A.G., Nartallo R., Haynes C.V., Gannaway F., Ade P.A.R., 1997, in The Far-Infrared and Submillimetre Universe, Ed. Wilson A., ESA Vol. SP-401, Noordwijk : ESA publications, p405
- [45] Murphy J.A. et al., 1998, in preparation
- [46] Naylor D.A., Tompkins G.J., Clark T.A., Davis G.R., 1994, in Instrumentation in Astronomy VIII, Proc. SPIE Vol 2198, 703
- [47] Orton G.S., Griffin M.J., Ade P.A.R., Nolt I.G., Radostitz J.V., Robson E.I., Gear W.K., 1986, Icarus 67, 289
- [48] Papoular R., 1983, A&A 117, 46
- [49] Privett G., Jenness T., Matthews H.E., 1997, Starlink User Note 213, Starlink Project, CLRC
- [50] Robson E.I. et al., 1998, in preparation
- [51] Rowan-Robinson M., Efstathiou A., Lawrence A., Oliver S., Taylor A., Broadhurst T.J., McMahon R.G., Benn C.R., Condon J.J., Lonsdale C.J., Hacking P., Conrow T., Saunders W.S., Clements D.L., Ellis R.S., Robson E.I., 1993, MNRAS 261, 513
- [52] Sandell G. et al. in preparation
- [53] Sanders D.B., Mirabel I.F., 1996, ARA&A, 34, 749
- [54] Smail I., Ivison R.J., Blain A.W., 1997, ApJ 490, L5
- [55] Smail I., Ivison R.J., Blain A.W., Kneib J.-P., 1998a, ApJ in press (astro-ph/9806061)
- [56] Smail I., Ivison R.J., Blain A.W., Kneib J.-P., 1998b, in preparation
- [57] Visser A. et al. 1998, in preparation
- [58] Wang N., Hunter T., Benford D.J., Serabyn E., Lis D.C., Phillips T.G., Moseley S.H., Boyce K., Szymkowiak A., Allen C., Mott B., Gygax J., 1996, Appl. Opt 34, 6629
- [59] Ward-Thompson D. et al., 1998 in preparation
- [60] White G.J., Nelson R., Holland W.S., Robson E.I., Greaves J.S., McCaughrean M., Pilbratt G., Balser D., Oka T., Sakamoto S., Hasegawa T., McCutcheon W., Matthews H., Fridlund C.V.M., Tothill N., Huldtgren M., 1998, A&A submitted
- [61] Wright E.L., 1976, ApJ 210, 250