Multiwavelength optical observations of the chromospherically active binary system MS Ser
J. Sanz-Forcada1, D. Montes1,2, M.J. Fernández-Figueroa1, E. De Castro1, and M. Cornide1
1 Departamento de Astrofísica, Facultad de Físicas, Universidad
Complutense de Madrid, E-28040 Madrid, Spain
2 The Pennsylvania State University,
Department of Astronomy and Astrophysics,
525 Davey Laboratory, University Park, PA 16802, USA
To be published in ASP Conf. Ser., Solar and Stellar Activity: Similarities and Differences (meeting dedicated to Brendan Byrne, Armagh 2-4th September 1998) C.J. Butler and J.G. Doyle, eds
Abstract
We present here a continuation of our ongoing project of multiwavelength optical observations aimed at studying the chromosphere of active binary systems using the information provided for several optical spectroscopic features that are formed at different heights in the chromosphere (Montes et al. 1997, 1998; Sanz-Forcada et al. 1998).
In this contribution we focus our study on the preliminar analysis of the active binary system MS Ser. We have taken H and H spectra in 1995 with the Coudè Spectrograph at 2.2m telescope in Calar Alto, and high resolution SOFIN echelle spectra (covering H, H, Na i D1, D2, He i D3, Mg i b triplet, Ca ii H & K, and Ca ii 8662 lines) in 1998 with the 2.5 m Nordic Optical Telescope (NOT) in La Palma. A strong emission in the Ca ii H & K and Ca ii IRT lines, coming from the primary component (recently classified as K2IV) is observed. One of the Ca ii H & K spectra (at orbital phase near quadrature) reveals that the secondary (G8V) also exhibit a small emission. A near complete and variable filling-in of the H and H is obtained after the application of the spectral subtraction technique. We detect also some seasonal variations between these two observing runs and in comparation with our previous Ca ii H & K observations taken in 1993 (Montes et al. 1995).
Introduction
Griffin (1978) first observed the binary nature of MS Ser (HD 143313), calculating the orbital elements for the system through the velocity curve plotted for the primary star. These orbital elements are presented in Table 2. Griffin gave its T0 in MJD, and this yielded Strassmeier et al. (1993) to a bad calculation of the T0 in HJD. The correct calculus is the showed in table 2 (phase 0 means the primary star behind). Griffin proposed also K2V/K6V as spectral types of the components, based on photometric arguments for the secondary star.
Bopp et al. (1981) observed a variable filled-in of the H line, and calculated a photometric period of 9.60 days, slightly different from orbital period. Miller & Osborn (1996) confirm the value of the photometric period, and Strassmeier et al. (1990) confirm the active nature of MS Ser by observing a strong emission in the Ca ii H & K composite spectrum. Dempsey et al. (1993) observed MS Ser within a wide Ca IRT exploration in chromospherically active stars. They noted some filled-in in these lines for MS Ser, but not a reversal emission. Barrado et al. (1997) measured the Li i 6707.8 equivalent width, giving 9 mÅ as a corrected value for the primary star.
Alekseev (1999) made a photometric and polarimetric study from MS Ser, calculating a spot area of 15% of the total stellar surface, based in part in the idea that the primary star of MS Ser is a main sequence star. He also observed some stational variations. Finally, Osten & Saar (1998) revised the stellar parameters for MS Ser, suggesting with their available data K2IV/G8V as a better classification.
Following the series of papers devoted to the study of RS CVn stars through the simultaneous analysis of several optical activity indicators (see Montes et al. 1997, 1998; Sanz-Forcada et al. 1998), we present spectroscopic observations for MS Ser taken in different epochs for the H, H, Na i D1, D2, He i D3, Ca ii H & K, and Ca ii IRT lines.
We also revise the luminosity class of the primary star, based on spectroscopic analysis of some metallic lines, like the Ti i lines, the Hipparcos data, and the Wilson Bappu effect.
Observations
Spectroscopic observations of MS Ser of several optical chromospheric activity indicators have been obtained during two observing runs. The first was carried out in 1995 June 12th with the 2.2 m telescope at the German Spanish Observatory (CAHA) in Calar Alto (Almería, Spain), using a Coudé spectrograph with the f/3 camera, CCD RCA #11 covering two ranges: H (from 6510 to 6638 Å), and H (from 4807 to 4926 Å). A resolution of 0.26 was achieved in both cases.
We have also done two observations with the 2.56 m Nordic Optical Telescope (NOT) at the Observatorio del Roque de Los Muchachos (La Palma, Spain). On 1998 April 5-14, the Soviet Finish High Resolution Echelle Spectrograph (SOFIN) was used with an echelle grating (79 grooves/mm), camera Astromed-3200, and a 1152x770 pixels EEV P88200 CCD as detector. The wavelength range covers from 3640 to 10085 Å in a total of 40 echelle orders. The reciprocal dispersion achieved range from 0.07 to 0.18 Å/pixel.
The spectra have been extracted using the standard reduction procedures in the IRAF package (bias subtraction, flat-field division, and optimal extraction of the spectra). The wavelength calibration was obtained by taking spectra of a Th-Ar lamp. Finally the spectra have been normalized by a polynomial fit to the observed continuum.
For the spectral subtraction we use Boo (K1.5III) and HD 45410 (K0IV) as standard stars, applying 0.85/0.15 as proportional intensities for the stars.
In Table 1 we give the observing log. For each observation we list date, UT, orbital phase (), and the signal to noise ratio (S/N) obtained for each spectral region.
Table 2 shows the stellar parameters for the system. We give the correct calculus for Tconj in HJD (phase 0 means the primary star behind). Distance is given by the Hipparcos catalogue (ESA, 1997); B-V, Tconj and Porb are given by Griffin (1978); Tsp, Radios and Vsin i are given by Osten & Saar (1998), and V-R is given by Alekseev (1999).
| Date | U.T. | S/N | |||||
| Ca ii K | H | Na i D | H | Ca ii 8662 | |||
| 1995/06/12 | 23:30 | 0.925 | - | - | - | 92 | - |
| 1995/06/12 | 23:55 | 0.927 | - | 86 | - | - | - |
| 1998/04/08 | 05:05 | 0.206 | 98 | 76 | 98 | 124 | 170 |
| 1998/04/11 | 06:15 | 0.545 | 51 | 34 | 35 | 44 | 40 |
| Tsp | SB | R | d | B-V | V-R | Tconj | Porb | Prot | Vsini |
| (R ) | (pc) | (H.J.D.) | (days) | (days) | (km s-1) | ||||
| K2IV/G8V | 2 | 3.5/1.0 | 88 | 0.94/1.23 | 0.73 | 2442616.142 | 9.01490 | 9.60 | 15/7 |
Luminosity Class
We have revised the luminosity class of the primary star in MS Ser, through the study of the behavior of Ti i and some other metallic lines. We have compared some of these lines (Ti i 8382, Ti i 6625) with those from Boo (K1 III), and HD 45410 (K0 IV). These lines are very sensitive to the luminosity class for late type stars (see Montes al. 1998), and so we could better classify MS Ser primary star as a IV-III, or perhaps a giant. We show in Fig 1 the depth of the Ti i 8382 line (multiplet 33).
According to the data provided by the Hipparcos catalogue (ESA, 1997), we can calculate, through the distance modulus, the absolute magnitude for MS Ser, which is 3.5. This yield us to think that the primary star could be a subgiant star.
We have used our Ca ii K spectra to determine the absolute visual magnitude, MV of the active component by application of the Wilson-Bappu effect (Wilson & Bappu 1957). The mean emission line width measured in our Ca ii K spectra is 0.56 Å, which come out to 40.9 km s-1 after the quadratic correction of the instrumental profile. With the improved Wilson-Bappu relation of Lutz (1970) we obtained MV = 3.4 and with the relation found for chromospherically active binaries by Montes et al. (1994) we obtained MV = 4.9. This value is lower than the MV that corresponds to a K1 V (MV(Tsp) = 6.6 from Landolt-Börnstein (Schmidt-Kaler 1982)) but higher than for a K1 III (MV(Tsp) = 0.6). This result indicates that the primary component of MS Ser may be of luminosity class IV or higher.
Chromospherical activity indicators
The Ca ii H K and H lines
Strong emission in the Ca ii H & K lines and the H line also in emission arising from the hot component is observed in our previous observations of this system in the 1993 March at orbital phase 0.10 (Montes et al. 1995). In the present observations (1998 April) we have deblended the emission arising from both components in the spectrum taken at orbital phase near quadrature ( = 0.206). The stronger emission, centered at the absorption line, arise from the hot component, which is the component with the larger contribution to the continuum. The red-shifted and less intense emission corresponds to the cool component (see Fig. 2). The computed orbital velocity agrees with the observed shift. In the 0.545 observation we can not separate the contribution from both stars. The H line appears also in emission in both spectra. The emission intensity observed in our 1993 and 1998 spectra is larger than the emission intensity observed in the 1988 spectrum presented by Strassmeier et al. (1990).
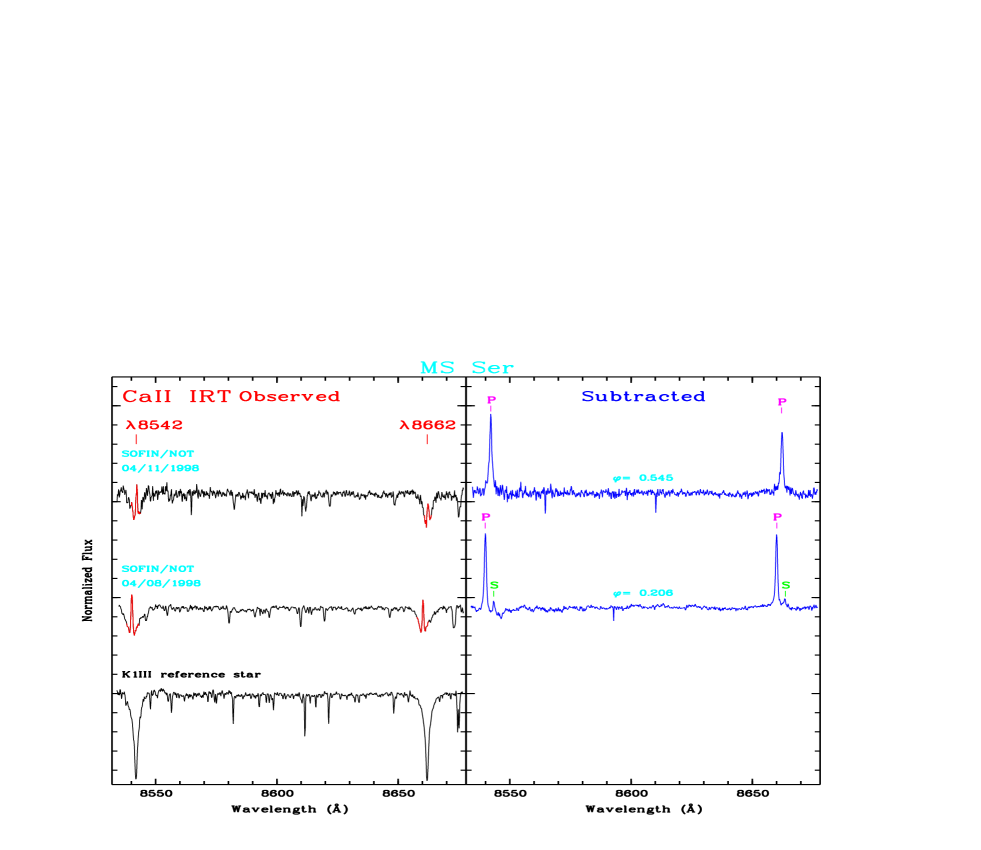
The Ca ii IRT lines
A clear emission reversal in observed in the core of the Ca ii IRT absorption lines 8542 and 8662. (see Fig. 3). After applying the spectral subtraction technique, we can clearly see a small emission arising from the secondary component, in the spectra near quadrature, as in the case of the Ca ii H & K lines. This emission reversal observed here clearly contrast with the only filled-in in these lines reported by Dempsey et al. (1993).
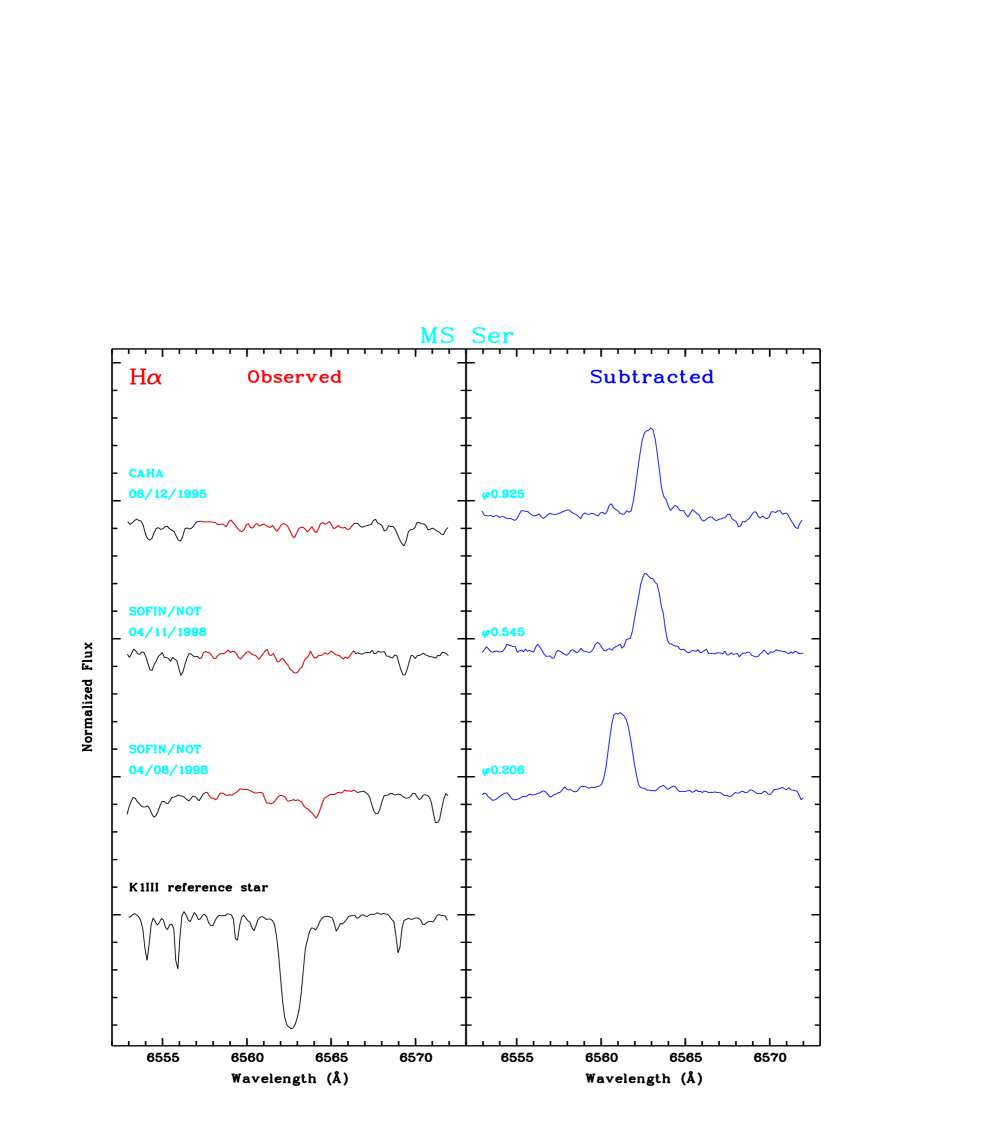
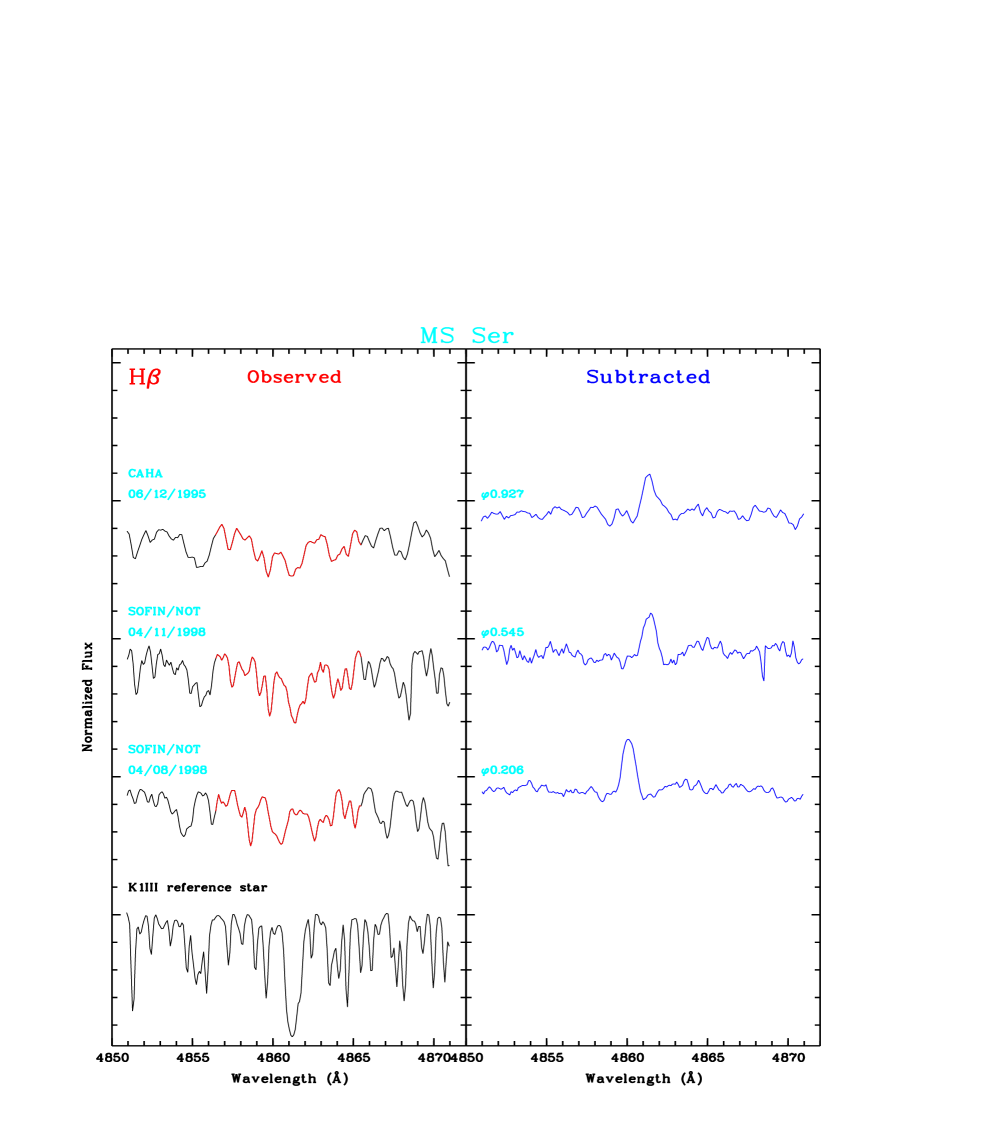
The H, and H lines
A near complete filling-in H and H lines are observed in the 1995 spectra, and a small absorption is present in 1998. After applying the spectral subtraction a clear filled-in in the H and H lines is observed in the three spectra (see Fig 4 and 5). The small emission, arising from the secondary component, that is observed in the Ca ii H & K and IRT lines is not detected in these two Balmer lines. Bopp et al. (1981) found H is weakly present in emission and variable in intensity. However, we only found a variable filling-in in our spectra a two different epochs.
He i D3 line
We can distinguish this triplet in absorption from the primary star. This is typical in cases of activity in evolved stars (Montes et al. 1997). In our observations we have measured 35 mÅ in the spectrum at 0.206, and 17 mÅ at 0.545 But the line could be slightly blended with other minor lines, this could be the responsible of its variation.
References
- [1]
- [2] lekseev I.Y., 1999, A Rep, (in press)
- [3]
- [4] arrado D., Fernández-Figueroa M.J., García López R.J., De Castro E., Cornide M., 1997, A&A 326, 780
- [5]
- [6] opp B.W., Noah P., Klimke A., Africano J., 1981, ApJ 249, 210
- [7]
- [8] empsey R.C., Bopp B.W., Henry G.W., Hall D.S., ApJS 86, 293
- [9]
- [10] SA, 1997, The Hipparcos and Tycho Catalogues, ESA SP-1200
- [11]
- [12] riffin R.F., 1978, Obs. 98, 257
- [13]
- [14] utz T.E. 1970, AJ 75, 1007
- [15]
- [16] iller R., Osborn W., 1996, Obs. 116, 382
- [17]
- [18] ontes D., Fernández-Figueroa M.J., De Castro E., Cornide M., 1994, A&A 285, 609
- [19]
- [20] ontes D., De Castro, E., Fernández-Figueroa, M.J., Cornide, M., 1995, A&AS 114, 287
- [21]
- [22] ontes D., Fernández-Figueroa M.J., De Castro E., Sanz-Forcada J., 1997, A&AS 125, 263
- [23] ontes D., Sanz-Forcada J., Fernández-Figueroa M.J., De Castro E., Poncet A., 1998, A&A 330, 155
- [24]
- [25] sten R.A., Saar S.H., 1998, MNRAS 295, 257
- [26]
- [27] anz-Forcada J., Montes D., Fernández-Figueroa M.J., De Castro E., Cornide M., 1998, in ASP Conf. Ser. 155, The Tenth Cambridge Workshop on Cool Stars, Stellar Systems, and the Sun, eds. R.A. Donahue & J.A. Bookbinder (San Francisco: ASP), CD-1450
- [28]
- [29] chmidt-Kaler T. 1982, in Landolt-Börnstein, Vol. 2b, ed K. Schaifers, H.H. Voig (Heidelberg: Springer)
- [30]
- [31] trassmeier K.G., Fekel F.C., Bopp B.W., Dempsey R.C., Henry G.W., 1990, ApJS 72, 191
- [32]
- [33] trassmeier K.G., Hall D.S., Fekel F.C., Scheck M., 1993, A&AS 100, 173
- [34]
- [35] ilson O.C., Bappu M.K.V. 1957, ApJ 125, 661
- [36]

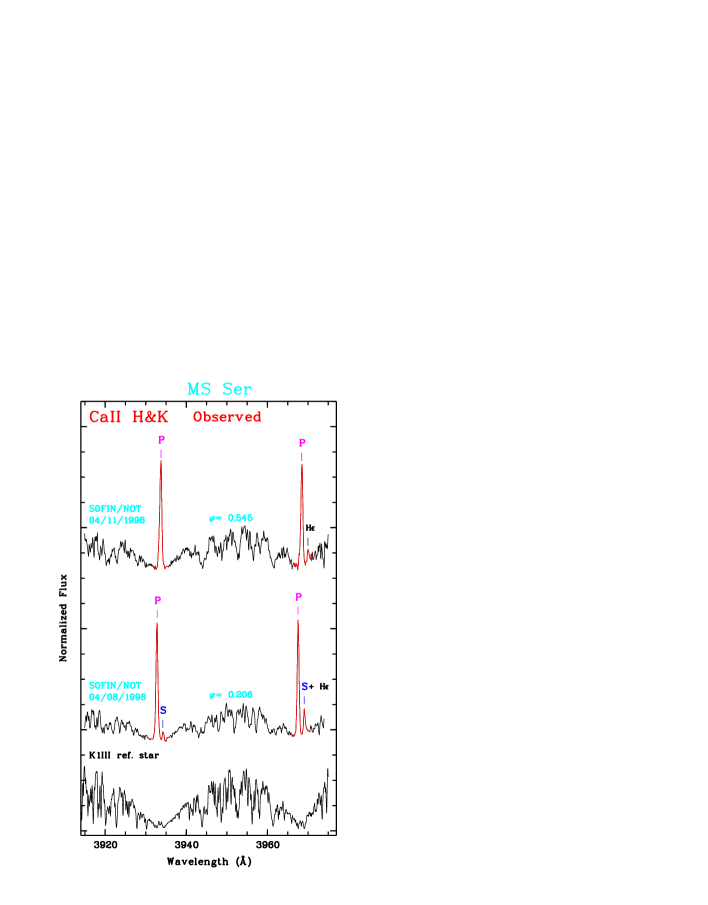
lines of the primary (P) and secondary (S) components are marked.