RX J1016.9–4103: A new soft X-ray polar in the period gap††thanks: Partly based on observations collected during MPI time at the 2.2 m telescope of the European Southern Observatory, La Silla, Chile.
Abstract
We have discovered a new AM Her system as the optical counterpart of the ROSAT All-Sky-Survey source RX J1016.9–4103 ( 1RXS J101659.4-410332). The X-ray spectrum is very soft and the X-ray intensity is strongly modulated with the orbital period. Optical photometric and spectroscopic follow-up observations reveal a synchronously rotating binary with an orbital period of 134 min, placing RX J1016.9–4103 in the period gap. The strength of the TiO bands suggests a secondary spectral type later than M3 V and a distance of 615150 pc. Based on two clearly visible broad humps in the optical spectrum (interpreted as cyclotron features) a magnetic field strength of 52 MG is deduced thus proving the polar classification.
Key Words.:
X-rays: stars – stars: cataclysmic variables – accretion, accretion discs – stars: magnetic fields – stars: individual: RX J1016.9–4103 1RXS J101659.4-4103321 Introduction
| Telescopea | Date | Energy Band | |
| (sec) | |||
| X-ray | |||
| ROSAT P | 1990 Dec 09–11 | 0.1–2.4 keV | 430 |
| ROSAT P | 1993 Nov 30–Dec 4 | 0.1–2.4 keV | 6760 |
| ROSAT P | 1994 Jun 01 | 0.1–2.4 keV | 2930 |
| ROSAT H | 1997 Dec 08 | 0.1–2.4 keV | 1800 |
| optical spectroscopy | |||
| ESO 2.2 m | 1995 Mar 26 | 3000–9000 Å | 1800 |
| optical photometry | |||
| ESO 2.2 m | 1995 Mar 25–27 | B, R | 600, 180 |
a The abbreviations have the following meanings: ROSAT P or H = PSPC or HRI detectors onboard the ROSAT satellite, ESO = European Southern Observatory, La Silla/Chile.
AM Her type variables are a subgroup of cataclysmic variables (CVs) in which the magnetic field of the white dwarf controls the geometry of the material flow between the main-sequence donor and the white dwarf primary as well as synchronizes the white dwarf spin period with the binary orbital period (see e.g. Warner 1995 for a detailed review). The inflow of matter along the magnetic field lines (of one or occasionally also two magnetic poles) is decelerated above the white dwarf surface producing a shock front. This region is thought to emit hard X-rays (usually modelled in terms of thermal bremsstrahlung of 10–20 keV) and polarized cyclotron radiation (hence these systems are named also polars) in the IR to UV range. In addition, a strong soft component has been frequently observed from polars which is thought to arise from the heated accretion pole (usually modelled in terms of blackbody emission with 20–50 eV temperature).
It is this soft X-ray component which has led to the discovery of a few dozen new polars by ROSAT observations over the last 8 years, most notably the ROSAT all-sky survey (e.g. Beuermann & Burwitz 1995 for a first summary). Based on these discoveries, the strength of the soft component (or more precisely the ratio of the blackbody and the bremsstrahlung component) has been found to increase with the magnetic field strength of the white dwarf. Since simple reprocession of the hard component cannot produce the observed soft X-ray fluxes, a scenario of high-, blobby accretion has been proposed as a mechanism to explain the soft excess (Kujpers & Pringle 1982). In a different approach, bremsstrahlung emission is gradually replaced by more efficient cyclotron cooling at high magnetic field strengths (Woelk & Beuermann 1996).
The source described here has been discovered as a result of a systematic survey for supersoft X-ray sources in the all-sky survey data (see Greiner 1996 for details of this survey) which revealed a large number of CVs and single white dwarfs. Other polars identified from this sample include V844 Her = RX J1802.1+1804 (Greiner, Remillard and Motch 1995, 1998), RS Cae = RX J0453.4–4213 (Burwitz et al. 1996), and RX J1724.0+4114 (Greiner, Schwarz and Wenzel 1998). In this paper we present photometric, spectroscopic and X-ray observations (summarized in Tab. 1) which led to the discovery of another polar, RX J1016.9–4103 (henceforth referred to as RX J1016).
2 X-ray discovery and identification
RX J1016 was scanned during the ROSAT all-sky-survey over a period of 4 days in December 1990 for a total observing time of 430 sec. Its mean count rate in the ROSAT position-sensitive proportional counter (PSPC) was 0.13 cts/s, and the hardness ratio where is defined as (H–S)/(H+S), with H (S) being the counts above (below) 0.4 keV over the full PSPC range of 0.1–2.4 keV.
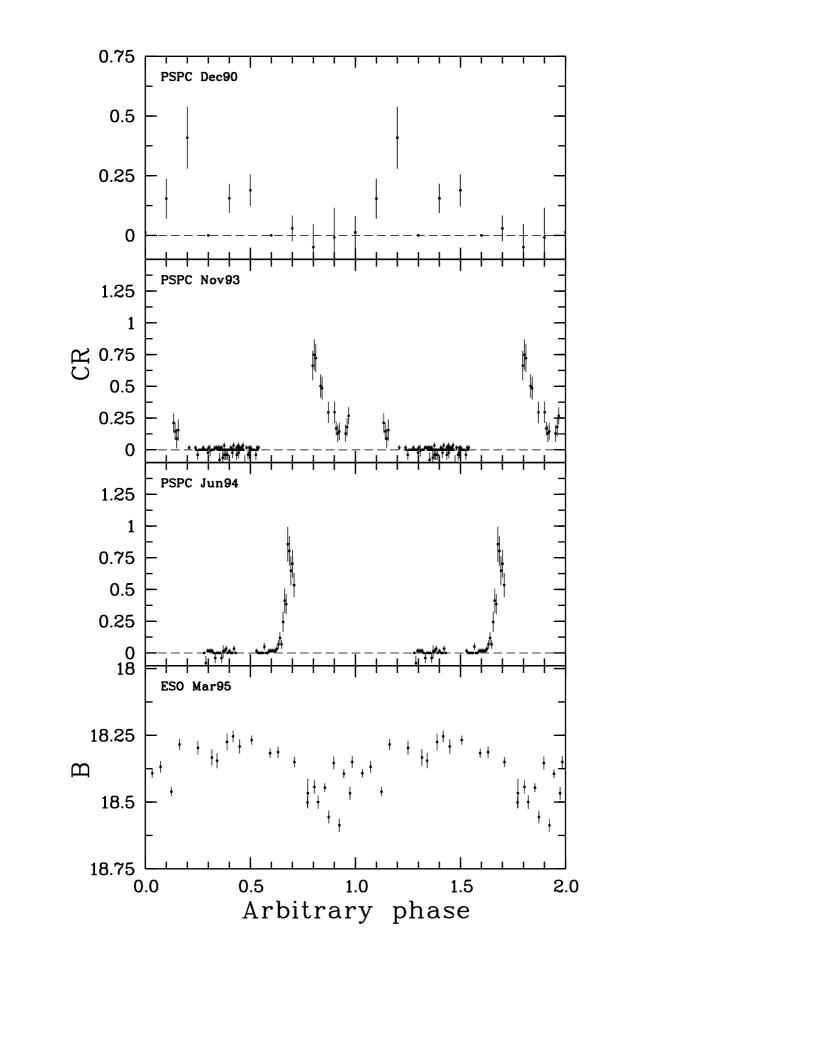
For the timing analysis the source photons were extracted with a radius of 4′. The background was chosen at the same ecliptic longitude at 1∘ distance, corresponding to background photons collected typically 15 sec before or after the time of the source photons. Standard corrections were applied using the dedicated EXSAS software package (Zimmermann et al. 1994). The RASS light curve folded over the best-fit period as derived in section 3 is shown in the upper panel of Fig. 3. The X-ray flux shows 100% modulation with a peak count rate of 0.4 cts/s and a pronounced long faint-phase where the X-ray flux is nearly zero (formal count rate of cts/s).
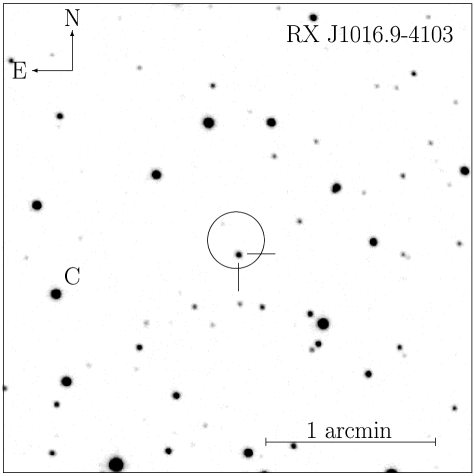
The soft X-ray spectrum and strong variability immediately suggested the cataclysmic variable nature. Indeed, using the best-fit X-ray coordinate derived from the all-sky survey data only one optical object brighter than 20m was found within the error circle (see Fig. 1) which later was identified spectroscopically as a polar (see section 4).
Dedicated follow-up pointed ROSAT observations were performed in November 30 – December 4, 1993 and June 1, 1994 with the PSPC and on December 8, 1997 with the high-resolution imager (HRI). Table 2 summarizes the relevant numbers of these measurements including the total number of detected counts (column 3), the mean count rate (column 4), the hardness ratio (column 5), the coverage of the orbital phases (column 6), the off-axis angle (column 7) and the best-fit X-ray positions (column 8).
| Date | Obs-ID(1) | Ncts | mean count | phase | offaxis | X-ray position | |
|---|---|---|---|---|---|---|---|
| rate (cts/s) | coverage | angle | (equinox 2000.0) | ||||
| 1990 Dec 09–12(1) | – | 57 | 0.13 | –0.950.12 | 5% | 0′–52′ | 10h16m582 –41∘03′38′′ 15′′ |
| 1993 Nov 30–Dec 4 | 201605p | 430 | 0.06 | –0.980.01 | 55% | 050 | 10h16m598 –41∘03′52′′ 25′′ |
| 1994 Jun 1 | 201605p-1 | 352 | 0.12 | –0.980.01 | 30% | 032 | 10h16m592 –41∘03′44′′ 25′′ |
| 1997 Dec 08 | 300580h | 3 | 0.0019(3) | – | 20% | 021 | 10h16m589 –41∘03′40′′ 10′′ |
(1) The letters after the number denote the
detector: h = HRI, p = PSPC.
(2) For the position determination only photons
in the energy range 0.25–0.5 keV have been
used to avoid position degradation due to
ghost images.
(3) Note the lower sensitivity of the
HRI at soft energies by a factor of 7.8 as
compared to the PSPC.
3 Optical and X-ray variations
CCD photometry was obtained during 3 nights in March 1995 with EFOSC II at the 2.2 m telescope on La Silla (during MPI time). Observations were performed mostly with the filter, though a few exposures also were made with the and filters. Exposure times ranged between 10–600 sec. Observational details are listed in Tab. 1. The images were processed using the profile-fitting scheme of the DoPhot reduction package (Mateo & Schechter 1989) to achieve high accuracy. The optical light curve is characterized by a broad bright phase and a shallow 0.3 mag deep faint phase. In contrast, the X-ray intensity variations are much more pronounced and show a clear on/off-like behaviour.
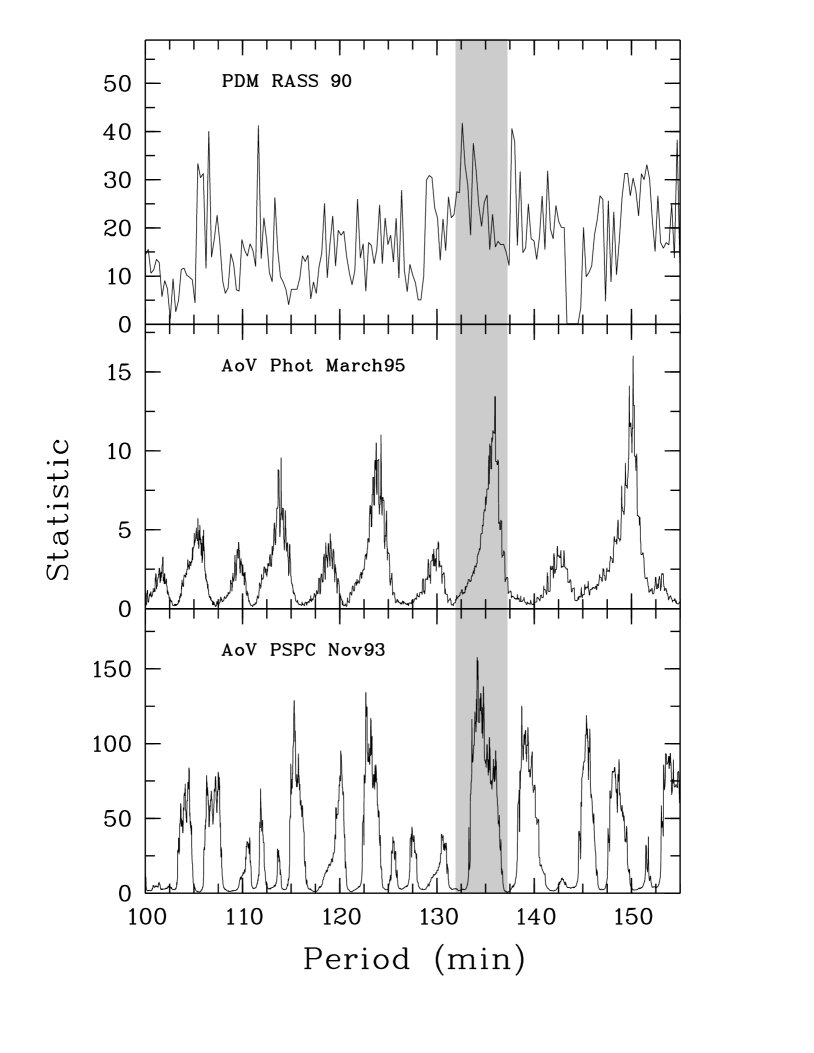
In order to derive an orbital period we carried out a period search using the analysis-of-variance method (Schwarzenberg-Czerny 1989) for both, the optical photometry data as well as the combined ROSAT PSPC pointings and the phase-dispersion method (Stellingwerf 1978) for the ROSAT all-sky survey data. The resulting periodograms (Fig. 2) show a variety of maxima which are predominantly caused by the poor sampling rather than the intrinsic variability. A more closer look at the bottom two panels (optical and ROSAT pointing data) suggests that common periods of 123, 134 or 149 min are possible (134 min is the most reliable period from the ROSAT pointed data alone). Inclusion of the ROSAT all-sky survey data clearly favours the 134 min period though we caution that due to the orbital motion of the ROSAT satellite (96 min) the signal may be affected. We note also that the actual best-fit period of the ROSAT all-sky survey data is 132.5 min, thus being slightly smaller than the period derived from the optical and pointed ROSAT data. Note that for each data set (corresponding to the three panels in Fig. 2) a slightly different best-fit period is obtained though the errors (which we consider to correspond to the width of the peak) overlap. Overall, based on the appearance of the folded light curves (Fig. 3) according to a criterion of “greatest simplicity” we feel that = 1343 min is our best estimate (shaded area in Fig. 2).
4 A low resolution spectrum
4.1 Optical identification
The identification spectrum of the likely counterpart was obtained on March 26, 1995 with the ESO 2.2 m telescope at La Silla/Chile and was exposed for 30 min. We used the EFOSC II spectrograph equipped with a 1k1k Thomson CCD detector with a 450 Å/mm grism (corresponding to about 8.5 Å/pixel) covering the optical wavelength range from 3000–9000 Å. The observation was performed under stable photometric conditions and accompanied by measurements of the standard star LT4816. We additionally applied a correction using the magnitude derived from a direct image taken just prior to the spectroscopic observation to calibrate the flux with an accuracy of % (using standard midas procedures). By convolving the original spectrum with functions representing the bandpasses we arrive at , mag and with a mean error of 0.2 mag for RX J1016.
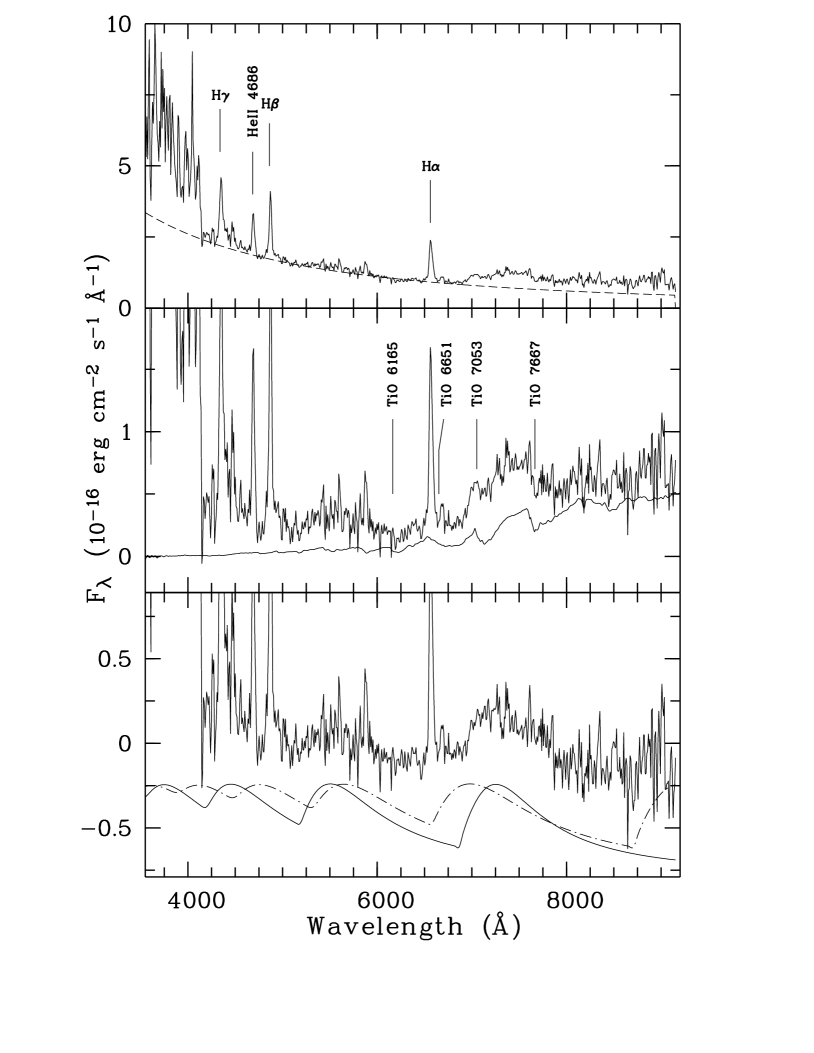
The resulting spectrum plotted in the upper panel of Fig. 4 reveals strong emission lines with of the Balmer series and He ii typical for a CV. The high-excitation line He ii Å is quite prominent. Its strength (2/3 of the H-flux) and the inverted decrement of the Balmer lines clearly indicate a magnetic nature of the object.
4.2 The secondary star
We further deconvolved the optical spectrum by fitting a power-law in the blue range between 3800–5000 Å. After subtracting this blue continuum contribution the late-type companion is revealed by the slope of the continuum in the near–IR and obvious flux depression due to the TiO absorption throughs which are best seen in the 7053 and 7667 Å bandheads. The faintness of the features prevents an accurate quantitative estimate of the spectral type, but the low ratio of the flux deficits (6165Å) to (7667Å) suggest that it is later than dM 3. The expected parameters for a Roche-lobe filling secondary in a 134 minute system are M⊙, R⊙ and a spectral type between M 4.5–5.5, for which the ZAMS mass-radius and mass-spectral type relations of Patterson (1984) and Kirckpatrick & McCarthy (1994) were used.
The distance of RX J1016 can be estimated from the observed strength of the M-dwarf using the method of Bailey (1981). In the following we take the dM 4.5 star Gl 83.1 () as a template and assume that both M-stars have the same colour (Leggett 1992). By comparing the measured flux deficits in the -band in Gl 83.1 and that of RX J1016 (1800 1016 and 0.2 1016 erg cm-2 s-1 ), we derive a magnitude of 165 for the secondary in RX J1016 . If we take this value and from the surface brightness relationship of Beuermann & Weichhold (1998) a distance of pc is deduced. The error includes an uncertainty of 25% for both, the flux calibration and the scaling of the TiO band deficits.
Detailed phase-resolved spectroscopic studies of selected systems, e.g. AM Her (Davey & Smith 1996), QQ Vul (Schwope et al. 1998) and RX J0203.8+2959 (Schwarz et al. 1998) have demonstrated that absorption features from the illuminated side of the secondaries in magnetic CVs can be heavily suppressed due to the strong X/UV irradiation from the accretion region. We therefore caution that the distance derived from our single spectrum with unknown viewing geometry of the binary system can serve as an upper limit only.
4.3 A magnetic field estimate
After subtraction of a suitably scaled spectrum of Gl 83.1 two broad emission humps at 5500 and 7400 Å clearly stand out in the red part of the spectrum (Fig. 4, lower panel), which we tentatively identify as cyclotron lines from the hot optically thin post-shock region.
An unambiguous estimate of the magnetic field strength is difficult to achieve with only two distinct humps observed. Their separation favours an interpretation as the 3rd and 4th harmonic of the cyclotron fundamental, in which case the field strength is 52 MG slightly depending on the plasma temperature and the yet unknown field orientation. An alternative interpretation as the 4th and 5th harmonics, in which case is MG, cannot not completely excluded but results in a distinct mismatch of the expected humps with the shape of the continuum between 6000–7000 Å. Normalized cyclotron absorption coefficients for both cases assuming and keV shown in Fig. 4 illustrate this ambiguity.
5 The X-ray spectrum
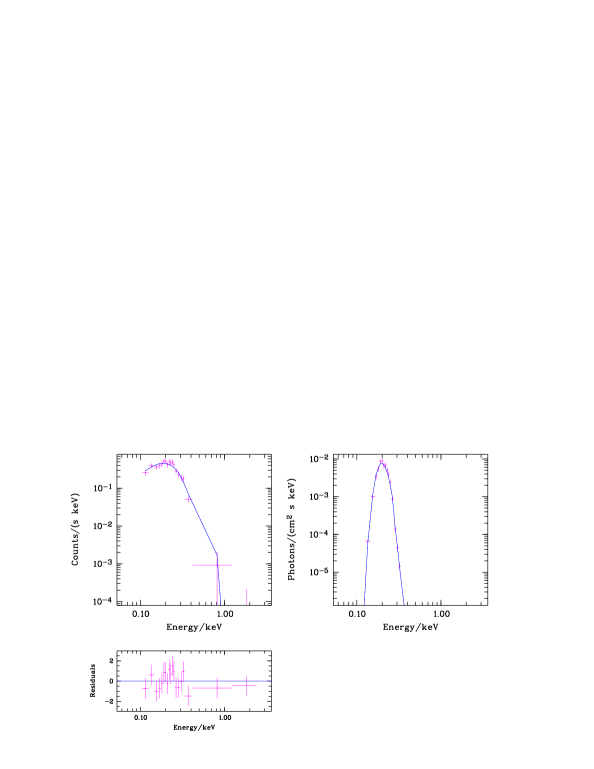
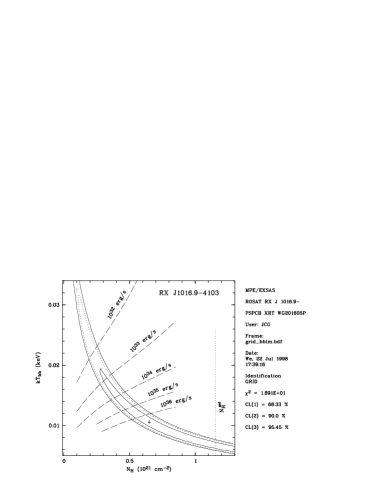
The two pointed PSPC observations have resulted in the detection of nearly 800 photons thus enabling spectral investigation. For the spectral analysis the source photons of the two PSPC pointings were merged and then extracted with a radius of 15. The background was chosen from concentric circles around the source region with a radius of 3′. Other nearby sources were cut out, and the background area normalized to the source extraction area before the background subtraction. Standard corrections were applied using the dedicated EXSAS software package (Zimmermann et al. 1994). As a first step, we have considered the total spectrum as collected during each of the two observations (after merging). Adopting a blackbody plus a thermal bremsstrahlung model (the temperature of the latter fixed to 20 keV) we find that there is no need at all for the inclusion of the bremsstrahlung component, that is the spectral fit does not require any spectral component for hard emission (Fig. 5). The resulting best-fit temperature of the blackbody component is 107 eV and the absorbing column =6.41020 cm-2, e.g. about 50% of the total galactic absorbing column in this direction (Dickey & Lockman 1990). However, this gives an unrealistic high luminosity for a cataclysmic variable due to the very low temperature. If we fix the temperature at the canonical value of 20 eV, the best-fit absorbing column is only =2.41020 cm-2. The difference in reduced is only marginal for all temperatures in the 10–25 eV range.
As a second step we have investigated the emission during the off-state phase intervals which has been observed for a total of 7340 sec. Selecting time intervals where the 60 sec averaged X-ray intensity is less than 0.05 cts/s, we find that the residual emission is consistent with being background radiation. The mean count rate during the X-ray bright phase (at 0.05 cts/s) is 0.38 cts/s in the PSPC.
Considering only the X-ray bright phase, the unabsorbed fluxes of the two model components in the ROSAT band (0.1–2.4 keV) are = 5.1 erg cm-2 s-1 (using kTbbdy=20 eV for comparison purposes) and 9.810-13 erg cm-2 s-1 , giving a small flux ratio of /. The mean bolometric luminosity during the X-ray bright phase is (again with kTbbdy=20 eV) = 2.41032 (D / 100 pc)2 erg/s.
6 Discussion and Conclusion
The measured period of min places RX J1016 in the 2–3 hr CV period gap which is thought to be due to the transition from orbital angular momentum loss by magnetic braking (P 3 hr) to gravitational radiation (P 2 hr) (King 1988). Over the last years, more polars have been found with periods in the 2–3 hr range thus re-initiating the debate on the existence and significance of the period gap for magnetic systems (Wickramasinghe & Wu 1994, Wheatley 1995).
The shape of the X-ray light curve strongly argues for a self-eclipsing polar. The length of the X-ray bright phase of phase units suggests (within our limited accuracy) an one pole accreting geometry such that the accretion region passes behind the limb of the white dwarf for half the orbital period. The lack of eclipses implies .
Our tentative estimate of the magnetic field strength is 52 MG and the strong soft X-ray excess are in good agreement with the correlation found between these quantities (Beuermann 1998).
The strongly modulated soft X-ray emission, the seemingly synchronous rotation, the strength and relative intensities of the Balmer and He ii emission lines as well as the cyclotron humps in the optical spectrum clearly suggest the polar nature of RX J1016 though no polarimetric measurements have been made. More detailed optical photometry and phase-resolved spectroscopy as well as polarimetry are needed to determine the system parameters of this new polar.
Acknowledgements.
We thank R. Egger for help during the ESO observing run and A.D. Schwope for generously providing help and software for the cyclotron spectroscopy. JG and RS are supported by the Deutsches Zentrum für Luft- und Raumfahrt (DLR) GmbH under contract No. FKZ 50 QQ 9602 3 and 50 OR 9206 8. The ROSAT project is supported by the German Bundesministerium für Bildung, Wissenschaft, Forschung und Technologie (BMBF/DLR) and the Max-Planck-Society.References
- (1) Bailey J., 1981, MNRAS 197, 31
- (2) Beuermann K., Burwitz V., 1995, ASP Conf. Ser. 85, 99
- (3) Beuermann K., 1998, in Perspectives of High Energy Astronomy & Astrophysics, Proc. of Int. Coll. to commemorate the Golden Jubilee of TIFR, Tata Inst. of Fund. Research, India, Aug. 1996, p. 100
- (4) Beuermann K., Weichhold M., 1998, A&A (in press)
- (5) Burwitz V., Reinsch K., Schwope A.D., Beuermann K., Thomas H.-C., Greiner J., 1996, A&A 305, 507
- (6) Davey S.C., Smith R.C., 1996, MNRAS 280, 481
- (7) Dickey J.M., Lockman F.J., 1990, ARAA 28, 215
- (8) Greiner J., Remillard R., Motch C., 1995, in Cataclysmic Variables, eds. A. Bianchini, M. Della Valle, M. Orio, ASSL 205, p. 161
- (9) Greiner J., 1996, in Supersoft X-ray Sources, ed. J. Greiner, Lecture Notes in Physics 472, Springer, p. 285
- (10) Greiner J., Remillard R., Motch C., 1998, A&A 336, 200
- (11) Greiner J., Schwarz R., Wenzel W., 1998, MNRAS 296, 437
- (12) King A.R., 1988, QJRAS 29, 1
- (13) Kirkpatrick J.D., McCarthy D.W., 1994, AJ 107, 333
- (14) Kujpers J., Pringle J.E., 1982, A&A 114, L4
- (15) Leggett S.K., 1992, ApJS 83, 351
- (16) Mateo M., Schechter P., 1989, 1st ESO/ST-ECF Data Analysis Workshop, eds. Grosbol P.J., Murtagh F. & Warmels R.H., p. 69
- (17) Patterson J., 1984, ApJS 54, 443
- (18) Schwarz R., Schwope A.D., Beuermann K., et al., 1998, A&A 338 (in press)
- (19) Schwarzenberg-Czerny A., 1989, MNRAS 241, 153
- (20) Schwope A.D., Beuermann K., Catalán M.S., Metzner A., Steeghs D., 1998, MNRAS (subm.)
- (21) Stellingwerf R.F., 1978, ApJ 224, 953
- (22) Warner B., 1995, Cataclysmic Variable Stars, Cambridge Univ. Press, Cambridge
- (23) Wheatley P.J., 1995, MNRAS 274, L51
- (24) Wickramasinghe D.T., Wu K., 1994, ApSS 211, 61
- (25) Woelk U., Beuermann K., 1996, A&A 306, 232
- (26) Zimmermann H.U., Becker W., Belloni T., et al., 1994, MPE report 257