13CO at the centre of M 82
Abstract
Using the IRAM interferometer, we have observed the nearby starburst galaxy M 82 with a resolution ( pc) in the 10 line of 13CO and in the 2.6-mm continuum.
The spatial distribution of the 13CO line shows the same gross features as the 12CO(10) map of Shen & Lo (shen (1995)), namely two lobes and a compact central source, though with different relative intensities. The lobes are more conspicuous and the central source is fainter in 13CO than in 12CO.
The velocity field observed around the nucleus shows a very steep gradient (140 km s-1 over 75 pc), which is very probably caused by the stellar bar visible in the near infrared. The dynamical centre coincides with the IR peak and is shifted north-east of the compact 13CO source. The two CO lobes appear to be associated with the ends of the bar and not with a molecular ring, as usually assumed. They are probably shaped by the strong UV radiation from the central region. 13CO must be more photodissociated than the self-shielded 12CO molecules in the central 250 pc region, which may explain the relative weakness of the 13CO central source.
A 130 pc-wide bubble of molecular gas has been identified, which happens to host the most luminous compact radio source in M 82. It lies 120 pc west of the IR peak between the central source and the western lobe and seems characterized by warmer gas, strong UV radio free-free radiation, and an enhanced cosmic ray production rate.
Key Words.:
ISM: bubbles – Galaxies individual: M 82 – Galaxies: ISM – Galaxies: kinematics and dynamics – Galaxies: starburst – Radio lines: galaxies1 Introduction
The central kpc region of M 82, the archetype of starburst galaxies, provides a unique laboratory to study intense star formation from an assembly of giant molecular clouds. The starburst, possibly triggered by a tidal interaction with M 81, manifests itself through a high far-infrared (far IR) luminosity and a high density of supernova remnants (SNR) (see e.g. Telesco & Harper telesco8 (1980); Kronberg et al. kronberg (1985)). The presence of copious molecular gas is obvious from the many single-dish studies of the CO mm lines (Nakai et al. nakai (1987); Olofsson & Rydbeck olofsson (1984); Loiseau et al. loiseau8 (1988), loiseau9 (1990)). A large fraction of this gas is concentrated in massive hot and dense clouds, which give rise to conspicuous emission in dozens of high-excitation molecular lines, such as the high-J lines of CO and the lines of CS and HCN (Henkel & Bally henkel (1985), Wild et al. wild (1992)). These clouds, according to multi-transition analysis, have temperatures of 40 K and densities of few 104 cm-3 (Wild et al. wild (1992); Güsten et al. guesten (1993)). Interferometric observations show that they have a patchy distribution (Lo et al. lo (1987); Brouillet & Schilke brouillet (1993); Shen & Lo shen (1995)).
The molecular gas at the centre of M 82 is usually thought to be concentrated in a rotating circumnuclear torus (e.g. Nakai et al. nakai (1987), Shen & Lo shen (1995)). The presence of a stellar bar (Telesco & Gezari 1992) may explain how gas is driven inwards in order to fuel the starburst. The main activity is however already subsiding according to Rieke et al. (rieke (1993), see also Shen & Lo shen (1995)); this may seem surprising given the large amount of molecular gas in the “ring”.
Multi-transition analysis show that the 12CO mm lines are optically thick in M 82 (Wild et al. wild (1992)), which makes it hazardous to study the gas distribution and kinematics of this edge-on galaxy from this isotopomer alone. The Hi line, moreover, gives little insight into the kinematics of the central regions as its profile shows a mixture of emission and absorption components.
M 82 has been mapped in the optically thin 13CO and C18O lines (Loiseau et al. loiseau8 (1988), loiseau9 (1990); Wild et al. wild (1992)), but with spatial resolutions of at best 150 pc. Both the 13CO brightness distribution and velocity field appeared markedly different from those observed in 12CO, an unusual result at such low resolutions. Single-dish studies of compact and weak extragalactic sources, however, are hampered by insufficient resolution and pointing errors. An interferometric study in the optically thin 13CO line was therefore mandatory. Here we present such a study carried out with the IRAM Plateau de Bure interferometer. In Sect. 2 we describe the observations and data analysis. Sect. 3 presents the distribution and kinematics of the 13CO emission. A prominent molecular arc-structure is described and dicussed in Sect. 4. Sect. 5 analyzes the observations in the frames of the circumnuclear torus and bar scenarios. Finally, we give our conclusions in Sect. 6.
2 Observations and data reduction
The central region of M 82 was observed in the 10 line of 13CO ( = 110.116824 GHz) with the IRAM interferometer at Plateau de Bure. The surveyed area is centred on the m nucleus (at B1950.0), Joy et al. (joy (1987)); see also Lester et al. (lester (1990)) and consists of three overlapping fields corresponding to three pointings of the FWHM primary beam, shifted, respectively, by ()=(), (), and () with respect to the nucleus. These fields were successively observed for 6 minutes each, the observing sequence being completed by a 4 min. integration on a phase calibrator (0716+714). We used the ‘compact’ CD antenna configuration, with a longest baseline of 176 m and a shortest one of 24 m. The six units of the correlator were combined to cover a 1500 km s-1-wide band, with a velocity resolution of 6.4 km s-1 and a 40 km s-1-wide band centred on the source systemic velocity, kms-1, with a 0.4 km s-1 resolution. The continuum level was derived in the lower sideband of the receiver (110 GHz) from the outer channels ( kms-1) of the broad band and in the upper sideband (113 GHz) from the entire 1500 km s-1-wide band.
The observations were carried out in August 1994 (4 antennas, D configuration) and October 1994 (3 antennas, C1+C2 configurations); the D configuration observations were repeated in April 1995 (4 antennas). For the calibration of the data we used 0923+392, 3C84, 3C345 and 3C454.3 as primary amplitude and RF bandpass calibrators. In the data reduction process, the transfer function was tapered with a 90-m (FWHP) Gaussian to yield a circular synthesized beam of size , which at the adopted distance of M 82 (3.25 Mpc). corresponds to 66 pc. The 3 fields were combined as a mosaic and subsequently cleaned using the MAPPING procedure of the GILDAS package; this yields a roughly constant sensitivity along the line joining the centres of the 3 fields.
3 Results
3.1 Continuum emission at 110 GHz

Fig. 1 shows the continuum map constructed from the line emission-free channels of the upper (113 GHz) and lower (110 GHz) receiver sidebands. The average wavelength is close to 2.7 mm. The rms noise in this map is 2.5 mJy/beam (14 mK), its resolution . Comparison with the continuum maps of Carlstrom & Kronberg (carlstrom (1991)), Brouillet & Schilke (brouillet (1993)) and Seaquist et al. (seaquist9 (1996)) shows a tight correspondence between all the four interferometric maps in the range 90–110 GHz.
The mm continuum emission in M 82 is a mixture of thermal free-free, nonthermal synchrotron, and thermal dust emissions (Klein et al. 1988). Free-free emission is expected to dominate largely at 3 mm, the relativistic electrons having lost too much energy to radiate significantly at this short wavelength; therefore, one expects a nearly flat spectrum (see Carlstrom & Kronberg carlstrom (1991)). Integrating the flux density over our 110 GHz map, we derive a value of Jy, in good agreement with the values measured at lower frequencies by other groups (Jura et al. jura (1978); Carlstrom & Kronberg carlstrom (1991); Brouillet & Schilke brouillet (1993); Seaquist et al. seaquist9 (1996)). This confirms the thermal free-free nature of the continuum radiation.
3.2 13CO line emission
In Fig. 2 we show the CLEANed velocity-channel maps111Unless specified otherwise, all velocities quoted in this paper are relative to the systemic velocity km s-1. between km s-1 and km s-1. The velocity resolution has been degraded to 12.8 km s-1 for the sake of clarity. These channel maps cover the velocity range within which strong 13CO emission was found. Significant emission was actually detected over a larger velocity range (+140 km s-1 to -190 km s-1). Positive velocity-channels are dominated by an emission “lobe”, centred 15′′E of the nucleus. This lobe stays at about the same place from +130 to km s-1, while its position angle turns from to . Near +100 km s-1, a spur is seen to emerge to the N of the lobe. Between km s-1 and km s-1 an arc-like structure is clearly visible. The negative velocity-channels are however dominated by a second emission lobe, W of the nucleus. It extends further out and to larger velocities than the eastern lobe; its orientation is almost E-W. Emission is also detected within 5′′ of the nucleus. It extends from km s-1 to km s-1, a remarkably large velocity range.


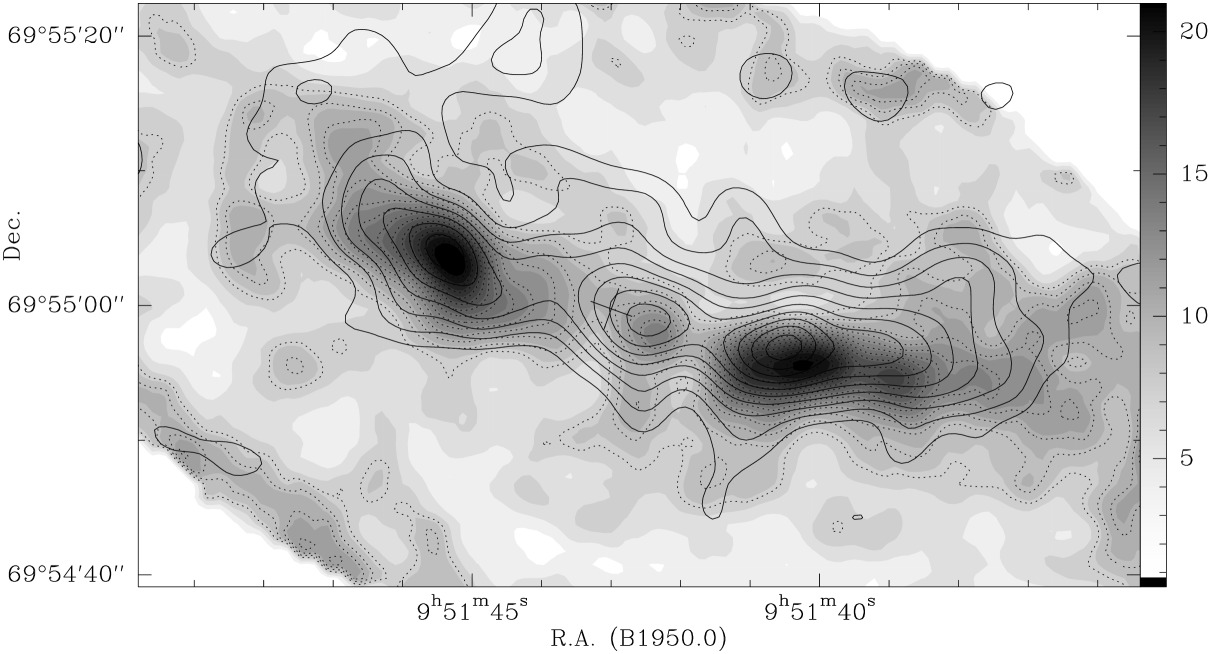
Fig. 3 shows the 13CO(10) velocity-integrated line intensity (zeroth moment of the data cube). Its distribution differs markedly from the continuum emission distribution of Fig. 1. The two emission lobes appear much broader and conspicuous than in the continuum emission, and the “central” source (, , B1950.0), much fainter. Note that the map is corrected for attenuation by the antenna primary beam and that its noise increases towards its edges. The reality of the weak features near , at the western edge, is thus questionable (see also Sect. 3.3).
A comparison with the 12CO(10) map of Shen & Lo (shen (1995)) shows good agreement of the most salient structures (see Fig. 4). There is an almost perfect spatial coincidence between the bright lobes in 13CO and 12CO which holds as well for the central peak, although this latter appears relatively brighter in 12CO than in 13CO. The faint outer extensions of the lobes in Figs. 2 and 3 are also present in 12CO. The weak 13CO extension, south of the nucleus near , , has a counterpart in 12CO; this structure seems to be made up by emission at km s-1 (see Fig. 2). Except for the stronger central source, the only marked difference between 12CO and 13CO is the absence of 13CO emission to the N, at . As a consequence, the CO/13CO (10) line intensity ratio is about constant over most of the map and is close to 10, a value marginally larger than those observed in the bright nearby galaxies (, see e.g. García-Burillo et al. santim51 (1993)). This ratio increases to near the central CO source (C 1 in Shen & Lo’s map), and could be even larger in the northern 12CO source. The minor differences between the 13CO and 12CO maps seem hardly compatible with the large ones reported by Loiseau et al. (loiseau9 (1990)). It has to be noted, however, that their analysis is based on (21) data so that a direct comparison is not possible.
Comparing our 13CO(10) with the HCN(10) map of Brouillet & Schilke (brouillet (1993)) we find an overall resemblance of the large-scale distribution, but also significant differences. Mainly, the central source is much more pronounced in all velocity channels in HCN than in 13CO; conversely the lobes appear dimmer. The faint 50 kms-1 extension south of the nucleus and the arc-like structure west of the nucleus, discussed in the next section, are also discernable, though less clearly.
The 13CO data cast doubts on the standard picture of a circumnuclear molecular torus. Firstly, the emission in Fig. 3 is strongly asymmetric with respect to the major and minor axes. Secondly, an edge-on torus should appear quite differently in the optically thin 13CO line and in the optically thick 12CO line. The 13CO(10) line, for which (Wild et al. wild (1992)), should exhibit limb-brightening, i.e. two distant lobes, whereas the optically thick 12CO line () should show a more uniform distribution, and emphasize the near side of the torus. Instead, we observe remarkably similar distributions, which suggests that the CO is mostly concentrated in two or three sources.
The observations seem better interpreted in terms of molecular gas condensations located at the ends and in the middle of a stellar bar. Such condensations or “armlets” have already been observed in several galaxies, including NGC 1530 (Reynaud & Downes reynaud (1998)) and NGC 891 (García-Burillo & Guélin santimichel (1995)); Achtermann & Lacy (achtermann (1995)) and Larkin et al. (larkin (1994)) have already proposed a similar model in order to explain the optical forbidden lines at the centre of M 82. We will see in the next sections that the kinematical data support this interpretation.
3.3 Kinematics of the 13CO gas
Fig. 5 shows the velocity field derived from 13CO(10) (first order moment), superimposed on the integrated intensity map. The dominant rotation pattern shows the eastern side receding (red-shifted) and the western side approaching (blue-shifted). There is a strong velocity gradient around the dynamical centre (offset (0,0) in Fig. 5), and the iso-velocity contours are systematically tilted by with respect to the minor axis. This tilt is visible along the whole major axis of M 82, suggesting that the gas flow is driven by a non-axisymmetrical potential within the inner 500 pc. On the other hand, the velocity field is rather asymmetric, possibly due to the tidal interaction with M 81. A detailed analysis of individual features is thus difficult – even the inclination of the disk to the line of sight is hard to determine; analyses of the outer disk and the outflow cones suggest a value of (Götz et al. mgoetz (1990)).
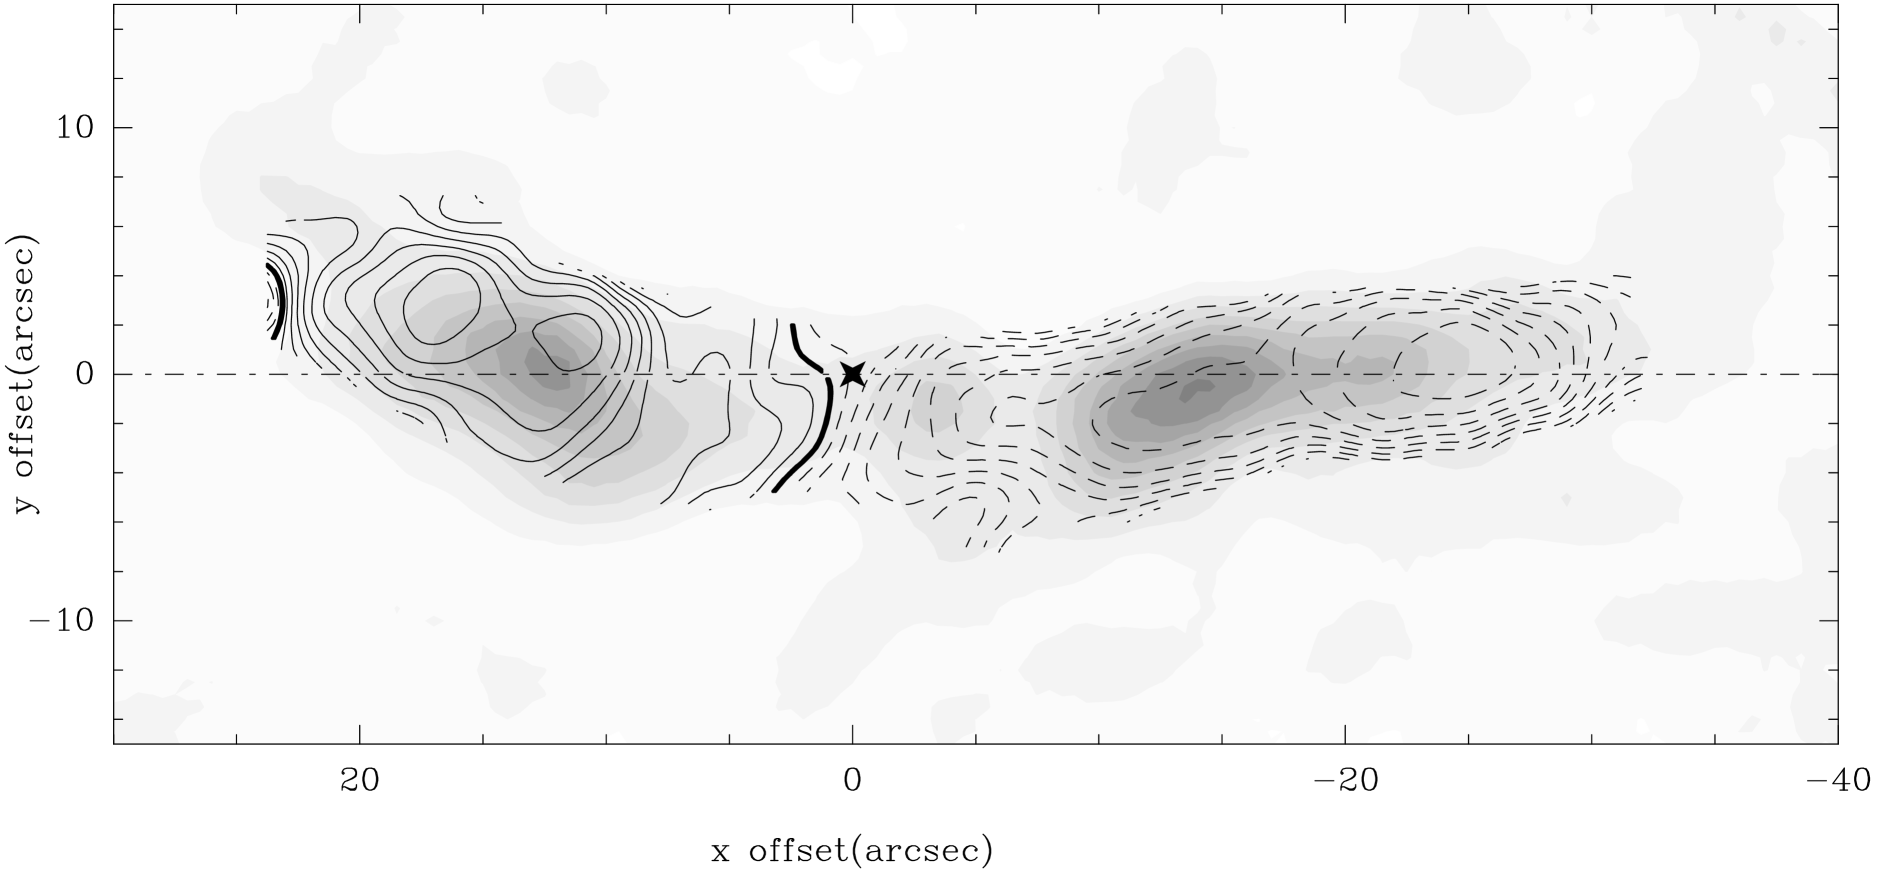
The position angle (PA) of the major axis is slightly varying depending on the tracer and method used. That of the optical disk is usually given as , but Götz et al. (mgoetz (1990)) used for their thorough kinematical analysis of the optical emission lines. Other angles are also used, e.g. Achtermann & Lacy (achtermann (1995)) use in the analysis of their Neii data. We re-determined the position of the kinematical major axis of the molecular gas from our data cube together with the position of the dynamical centre (see Fig. 5). The PA of this axis is , different from that of the outer disk. The dynamical centre is found to coincide with the m nucleus (, B1950.0, Joy et al. joy (1987)).
Fig. 6 shows the position-velocity (p-v) diagramme taken along the major axis (). Emission can be traced from km s-1 to km s-1. This implies a rotation speed – if this reflects simple rotation – of km s-1, exactly the same figure as derived by Shen & Lo (shen (1995)). We would then obtain the same indicative mass for the central pc region of M 82 as Shen & Lo ( M⊙).
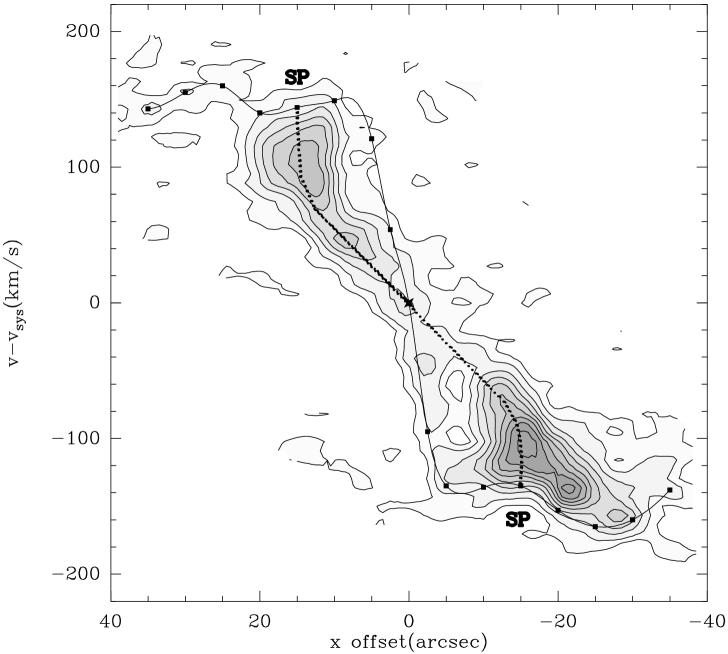
Although the 13CO brightness distribution is very asymmetric, the main pattern of the p-v diagramme and the ridge of terminal frequencies are rather symmetric with respect to the dynamical centre. We note that emission from gas at high velocities is detected on both sides of the nucleus, although with a higher intensity for . The rotation curve derived from the terminal-velocities method applied to p-v diagramme is very steep: we estimate km s-1 at pc. From pc to pc the estimated rotation curve stays flat ( km s-1) and reaches a relative maximum of km s-1 at pc. The rotation curve () and the related principal frequencies derived in the epicyclic approximation ( and -/2) are represented in Fig. 7 for the inner 500 pc.

A large amount of gas is detected at velocities lower than determined by the ridge of terminal velocities shown in Fig. 6. There is an S-shaped feature in the p-v diagramme going across the dynamical centre (denoted as SP in Fig. 6). The characteristic pattern of SP suggests the presence of a non-axisymmetric distribution of molecular gas in the form of nuclear mini-spiral arms, which extend from the centre to pc. Moreover, the ‘figure-eight’ pattern of the p-v diagramme formed by SP and the curve of terminal velocities is typical of a bar-driven gas flow (Kuijken & Merrifield kuijken (1995)). The existence of a nuclear stellar bar of 1 kpc diameter was already established by Telesco & Gezari (telesco9 (1992)), based on near-infrared observations in the J, K and I bands. Driven by a bar potential, gas clouds follow non self-intersecting ellipsoidal orbits. The major axes of these orbits precess as a function of radius, and hence end up delineating spiral arms, owing to orbit crowding. The precession of gas orbits is due to the dissipative nature of gas: molecular cloud-cloud collisions and the implied viscosity of the process cause a smooth transition between the bar-driven orbits (parallel to the bar major axis) towards orbits (perpendicular to bar major axis), when we go across the Inner Lindblad Resonance (ILR). Therefore, the presence of a nuclear bar potential and a spiral gas response are intimately related.
The existence of two ILRs in the nucleus of M 82 is clearly suggested by our observations (see Fig. 7). The ring-like appearance of the integrated intensity map (referred to in the literature as the molecular gas torus) indicates gas accumulation towards the outer ILR (oILR) at pc caused by the action of gravitational torques by the stellar bar on the gas. If we assume that corotation of the stellar bar is located near its end-points ( pc), we derive a bar pattern speed of kms-1 kpc-1 and from it, the location of two ILRs at (iILR) pc and (oILR) pc (see Fig. 7). The onset of a fast bar instability in the nucleus of M 82 is hardly surprising in view of the measured high values of within the inner 500 pc. Results of recent near-infrared surveys of galactic centres show that nuclear bar instabilities are ubiquitous and that the pattern speeds of these m=2 instabilities can reach high values on the derived kinematical major axis (see the case of M 100: García-Burillo et al. santimaria (1998)). The final output would be the formation of a two-arm gaseous trailing spiral across the oILR. The tilting of isovelocity contours towards the centre, the ring-like concentration of molecular gas and the ‘figure-eight’ pattern of the major axis p-v plot support this theoretical scenario for the nucleus of M 82.
The steep negative-velocity feature between and , which is linked to the bar, was also observed in HCN(10) by Brouillet & Schilke (brouillet (1993)) and in 12CO (10) by Shen & Lo (shen (1995)). It is more pronounced in HCN than in 12CO or 13CO, which probably denotes that the gas near the centre of the bar is dense.
4 A giant bubble
This steep negative-velocity feature merges into the western lobe at , leaving a prominent hole in the p-v diagramme at , . This “hole” is also visible in the velocity-channel maps of Fig. 2, where it appears as a -wide gap between the western lobe and the central source and centred at .

Fig. 8 shows a close-up view of velocity-channel maps around this hole. A faint arc-like structure (diameter , or 130 pc) delineates the southern border of the hole, while only very weak emission is visible to the north (at km s-1). The hole happens to host the young SNR 41.9+58 which is the strongest compact radio source in M 82 (Kronberg et al. kronberg (1985)). This SNR is however assumed to be only about 40 years old (Wilkinson & de Bruyn wilkinson (1990)) and hence cannot be the origin of such a large structure. We note that the arc-like structure and the hole are also visible in the 12CO velocity-channel maps shown by Lo et al. (lo (1987)) (e.g. in their map at km s-1, which corresponds to km s-1).
The gas in the CO hole seems largely ionized. The H41 (Seaquist et al. seaquist8 (1985)) and H (Seaquist et al. seaquist9 (1996)) recombination line emissions show both a maximum, and the wide associated Hii region fills the hole in our 13CO channel maps. The 3 mm continuum emission, which is essentially thermal free-free radiation, also peaks at this position. As concerns molecular lines, Wild et al. (wild (1992)) reported emission of high-J lines of HCO+ and HCN from the region of the arc+hole, while lower excitation lines are less pronounced. The maximum of the atomic Ci line falls close to this location (White et al. white (1994)). Those authors also argued that the enhanced Ci abundance in the central region of M 82 can be connected to a higher cosmic ray flux there. Copious cosmic rays could be delivered e.g. by the luminous compact source 41.9+58. Furthermore, as noted by Wild et al. (wild (1992)), the secondary peak in the 2.2m image as well as the FIR and submm dust emission peaks (Joy et al. joy (1987); Smith et al. smith (1990)) are found right there, and the maxima of the [Neii] line (Achtermann & Lacy achtermann (1995)) are both close to this position. Finally, a recent high-resolution map at 408 MHz (Wills et al. wills (1997)) clearly shows an emission-free circle of 100 pc diameter, right around this source, which is ascribed to a large photoionized zone. A realistic interpretation is that this is a region with an intense radiation field in which the atomic hydrogen has been ionized (see Wills et al. wills (1997)). Such a region might have been created by a large cluster of massive stars whose stellar winds and supernova explosions (of which 41.9+58 is just the latest) can easily clear a large hole in the interstellar matter. Therein hot gas will be the dominant constituent and the intense radiation of the remaining stars will dissociate molecules unless they are shielded within dense clouds. This is consistent with the finding that the gas deficiency is less pronounced here in the HCN line (Sect. 3.2).
5 The fueling of the starburst
In order to try to understand the remarkable morphology and kinematics of the central 700 pc region we briefly describe what could have happened since the probable close encounter of M 82 with M 81. Cottrell (cottrell (1977)) interpreted the observed large-scale kinematics of the neutral hydrogen gas in terms of tidal disruption of this gas from M 81 during the passage of M 82 on a hyperbolic orbit. The fact that the kinematic axis of the Hi surrounding M 82 lies parallel to the major axis was seen as evidence for the captured gas to be in a polar orbit around M 82. In this picture, gas would eventually fall into the centre of M 82 and thus feed the starburst of this presumably former gas-poor galaxy.
Recently, Yun et al. (yun (1994)) have proposed the opposite scenario: the large Hi streamers which they have found are interpreted as gas torn out of the outer gas-rich Hi disk of M 82. The question arises how in this case gas is transported to the centre to feed the starburst. There is of course no contradiction because the tidal forces that are responsible for gas disruption in the outer disk of M 82 will also have caused instabilities in the gas orbiting in its inner part. It is well known that tidal interactions induce the rapid formation of bars along which gas can then be transported to the central regions of the galaxies. In view of this, the hypothesis of Yun et al. seems more attractive, because in this scenario gas may be transported more efficiently to the centre of M 82 than from a polar orbit. We therefore investigate in the following whether the observed kinematics of the 13CO emission is consistent with this view.
The maps tracing the molecular gas in M 82 have been mostly interpreted in terms of a rotating molecular torus (e.g. Nakai et al. nakai (1987); Loiseau et al. loiseau8 (1988); Shen & Lo shen (1995)). As pointed out in Sect. 3.2, the 13CO high resolution maps reveal a patchy gas distribution and a disturbed kinematics characteristic of gas in orbit around a stellar bar. The bar forces the outer gas to flow towards the central region, where it is exposed to the intense radiation field produced by the starburst and becomes largely dissociated. This is when the denser and better shielded clouds get shaped into the two lobes and the central condensation of Fig. 3.

We have compared several p-v diagrammes and find that they support this picture. These are: 13CO (Fig. 6), [Neii] (Achtermann & Lacy achtermann (1995); their Fig. 4), H166 (Roelfsema & Goss roelfsema (1992)), H41 (Seaquist et al. seaquist9 (1996); their Fig. 5c), HCO+ (Seaquist et al. seaquist9 (1996); their Fig. 5), and HCN (Brouillet & Schilke brouillet (1993); their Fig. 5; Shen & Lo shen (1995); their Fig. 4). From this we summarize the following: The brightest [Neii] emission peaks (concentrated between and around km s-1, see Fig. 9) coincide with depressions in 13CO. The same holds true for the radio recombination lines, which shows that the effect does not just result from visual extinction variations. Finally, HCO+(10) closely follows the 13CO emission and HCN(10) is brighter near the nucleus and shows little evidence of a hole W of it.
The velocity-integrated emission maps of these lines show that the tracers of current star formation and the ionized gas are confined to radii of , which is also seen in the 3-mm continuum (free-free radiation) and the mid-infrared, the latter reflecting the heating of dust by young stars (Telesco & Gezari telesco9 (1992)). In contrast, the bulk of the CO gas is located beyond . The gas traced by the HCN molecule resides in very dense clouds that are better shielded against the radiation field.
6 Summary and conclusions
We have performed high-resolution observations of M 82 in the 13CO(10) line using the Plateau de Bure interferometer. The distribution and kinematics of this molecular species have been derived and analyzed, and a first comparison is made with existing interferometric data in the lines of 12CO(10) and HCN(10).
The complex kinematic structure unveiled in previous studies is confirmed. Together with the asymmetric morphology of the observed distribution of the molecular gas it makes it difficult to maintain the hypothesis of an edge-on molecular torus, an idea advanced when the first low-resolution single-dish maps of the CO gas in the centre of M 82 became available. We rather propose that what we observe is the signature of a bar, the central (projected) 200 pc portion of which is relatively void of CO gas and probably subject to strong dissociation.
A 130 pc-wide emission hole is seen in our 13CO data cube; it coincides with a region of enhanced high-J lines, recombination lines emission peak, and strong free-free and Ci emission. It also hosts the young SNR 41.9+58. We think that this CO hole reflects a bubble inside which the gas is ionized and the molecules dissociated.
Maps of several transitions of the rare CO isotopomers would be needed to better constrain the cloud properties. Together with one arcsec resolution maps of CO and HCN, which could be directly compared to the optical pictures, they could yield a real understanding of how is triggered and fueld the most spectacular starburst in the vicinity of the Galaxy.
Acknowledgements.
It is a pleasure to thank Drs. J. Shen and K.Y. Lo for making available to us their 12CO(1-0) data from BIMA. We are very grateful to the referee, Dr. D. Jaffe, for his many helpful suggestions. UK is very indebted to IRAM for the warm hospitality and financial support.References
- (1) Achtermann J.M., Lacy J.H., 1995, ApJ 439, 163
- (2) Brouillet N., Schilke P., 1993, A&A 177, 381
- (3) Carlstrom J.E., Kronberg P.P., 1991, ApJ 366, 422
- (4) Cottrell G.A., 1977, MNRAS 178, 577
- (5) García-Burillo S., Guélin M., Cernicharo J., 1993, A&A 274, 123
- (6) García-Burillo S., Guélin M., 1995, A&A 299, 657
- (7) García-Burillo S., Sempere M.J., Combes F., Neri R., 1998, A&A, 333, 864
- (8) Götz M., McKeith C.D., Downes D., Greve A., 1990, A&A 240, 52
- (9) Güsten R., Serabyn E., Kasemann C., et al., 1993, ApJ 402, 537
- (10) Henkel C., Bally J., 1985, A&A 150, L25
- (11) Joy M., Lester D.F., Harvey P.M., 1987, ApJ 319, 314
- (12) Jura M., Hobbs R.W., Maran S.P., 1978, AJ 83, 153
- (13) Klein U., Wielebinski R., Morsi H.W., 1988, A&A 190, 41
- (14) Kronberg P.P., Biermann P., Schwab F. 1985, ApJ 291, 693
- (15) Kuijken K., Merrifield M.R., 1995, ApJL, 443, L13
- (16) Larkin J.E., Graham J.R., Matthews K., et al., 1994, ApJ 420, 159
- (17) Lester D.F., Carr J.S., Gaffney N., Joy M., 1990, ApJ 352, 544
- (18) Lo K.Y., Cheung K.W., Masson C.R., et al., 1987, ApJ 312, 574
- (19) Loiseau N., Reuter H.-P., Wielebinski R., Klein U. 1988, A&A 200, L1
- (20) Loiseau N., Nakai N., Sofue Y., et al., 1990, A&A 228, 331
- (21) Nakai N., Hayashi M., Handa T., Sofue Y., Hasegawa T., 1987, PASJ 39, 685
- (22) Olofsson H., Rydbeck G., 1984, A&A 136, 17
- (23) Reynaud D., Downes D., 1997, A&A 337, 671
- (24) Rieke G.H., Loken K., Rieke M.J., Tamblyn P., 1993, ApJ 412, 99
- (25) Roelfsema P.R., Goss W.M., 1992, ARA&A 4, 161
- (26) Seaquist E.R., Bell M.B., Bignell R.C., 1985, ApJ 294, 546
- (27) Seaquist E.R., Carlstrom J.E., Bryant P.M., Bell M.B., 1996, ApJ 465, 691
- (28) Shen J., Lo K.Y., 1995, ApJ 445, L99
- (29) Smith P.A., Brand P.W.J.L., Puxley P.J., Mountain C.M., Nakai N., 1990, MNRAS 243, 97
- (30) Telesco C.M., Gezari D.Y., 1992, ApJ 395, 461
- (31) Telesco C.M., Harper D.A., 1980, ApJ 235, 392
- (32) White G.J., Ellison B., Claude S., Dent W.R.F., Matheson D.N., 1994, A&A 284, L23
- (33) Wild W., Harris A.I., Eckart A., et al., 1992, A&A 265, 447
- (34) Wilkinson P.N., de Bruyn A.G., 1990, MNRAS 242, 529
- (35) Wills K.A., Pedlar A., Muxlow T.W.B., Wilkinson P.N., 1997, MNRAS 291, 517
- (36) Yun M.S., Ho P.T.P., Lo K.Y., 1994, Nature 372, 530