1(08.05.1; 08.19.2; 08.16.3; 10.07.3 M 15)
U. Hopp 11institutetext: Universitätssternwarte München, Scheiner Str. 1, D 81679 München, FRG, email: hopp .at. usm.uni-muenchen.de
Distance, structure and bright stellar content of the dwarf irregular galaxy UGC 685
Abstract
B and R CCD images and J NICMOS3 frames taken with the Calar Alto 3.5m telescope of the dwarf irregular galaxy UGC 685 are presented. The brightest part of the stellar population is resolved in B and R, very few also in J. The stellar color-magnitude diagram is discussed. An estimate of the distance to UGC 685 of Mpc is derived based on the brightest blue supergiant stars. Most of the resolved bright stars show colors in the range .
The continuum light of the unresolved stars is distributed rather regular in B, R, and J, showing only minor irregularities. This surface brightness distribution follows an exponential law in all three colors with a scale length kpc. The central surface brightnesses are , , and , in B, R, and J, respectively. The surface brightness can be traced out to 5 in B and R. Thus, UGC 685 belongs to the class of dwarfs where the HI distribution is much more extended (here 2.6 times) than the optical (stellar) light distribution, but contrary to many objects of this type, it does not belong to the class of low-surface brightness objects. No color gradient was detected in UGC 685 except that the very center is slightly bluer. The overall colors are , and the magnitude is B = 14.55 ( = -14.5).
The classification as an irregular dwarf from survey plates results from the few HII regions of UGC 685 which are all concentrated to the South-East of the center of the galaxy. On an H Calar Alto 2.2m telescope CCD image, I identified only 5 HII regions, one of them being rather bright. The total H flux corresponds to a mildly on-going star formation with a rate of 0.003 yr-1, a low rate even in comparison to other dwarfs. The available (and limited) data do not indicate any major deviation from this rather low star formation rate within the last yr.
keywords:
Galaxies - dwarfs; galaxies - structure; galaxies - distances1(fill in)
1 Introduction
Isolated dwarf irregular galaxies are good laboratories to study the star formation history as well as the evolution of galaxies in the absence of external triggers and without the influence of large-scale internal triggers like density waves (see Hunter, 1997, for a review). Understanding local dwarfs constrains the models which were developed for a description of the large population of sub-luminous, irregular systems at medium redshifts (see Babul & Ferguson, 1996; Ferguson & Babul 1998). Very nearby galaxies of this type are best suited for detailed analysis of their star formation histories as they can be resolved into individual stars (see e.g. Gallart et al, 1996, their table 1, and Greggio, 1994 and references in these papers). Inside the Local Group (distance up to roughly 1 Mpc), ground-based deep images under excellent seeing conditions can be used for this type of investigation while for more distant galaxies (up to about roughly 5-10 Mpc), HST data are essential (e.g. Schulte-Ladbeck et al., 1998). For galaxies in this distance range, radial velocities are very crude distance estimators as the peculiar velocities are in the order of or larger than the Hubble flow. A quick and in-expensive method to reject more distant interlopers from the 10 Mpc sample is the identification of the brightest stars which can be done with ground-based images of good seeing (see the discussion by Karachentsev & Tikhonov, 1993, K&T hereafter), and Rozanski & Rowen-Robinson, 1994, R&RR). Further, the ground based images indicate the regions of recent high star formation activities (HII regions, star clusters), thus allowing a pre-selection for the pointing of the HST or adaptive optic observations with their rather small field of view.
UGC 685 (=CGCG0104.7+1625), which belongs to the 10 Mpc sample of Kran-Korteweg & Tammann (1979), was classified as a late type dwarf galaxy (Sm). Kran-Korteweg & Tammann could not associate UGC 685 to one of their groups and therefore called it a field galaxy. This indicates that at least the recent evolution and star formation history of UGC 685 was free of important triggers by interaction, albeit small mass HI companions as found in several cases by Taylor et al. (1996) can not be ruled out. The available optical data as recently compiled by Schmidt & Boller (1992a,b) indicate a rather normal and absolutely faint dwarf galaxy at a systemic velocity (corrected for the local group flow) of . The galaxy was included in various HI surveys which indicate an amount of in neutral gas and a ratio of neutral gas to blue luminosity of (Schmidt & Boller, 1992a,b), also rather normal for its type. As this dwarf galaxy appears relatively regular on survey plates and was indicated to be nearby, I selected it for a kinematic study of its stars and its ionized gas as well as for a study of its chemical abundances through optical long slit spectroscopy.
Only a radial velocity exists as distance indicator for UGC 685. Surface photometry which is necessary for the analysis of kinematic data is still missing. Finally, no colors or other values which hint at the star formation history, are published yet. I therefore included this dwarf galaxy in photometric CCD observations with the Calar Alto 3.5m and 2.2m telescopes to obtain multi-color surface photometry of the galaxy, its structural parameters and HII morphology and to resolve the brightest supergiants. These can yield an independent distance estimate, following the recent update of the calibration for the brightest blue supergiants by K&T and R&RR. The limitation and error budget of this techniques has been discussed in detail by R&RR.
The observations and their reductions are described in section 2. The structure and HII morphology, the color-magnitude diagram of the resolved stars and the distance estimate are presented in section 3 and I conclude in section 4.
2 Observations and Reductions
2.1 B and R band observations
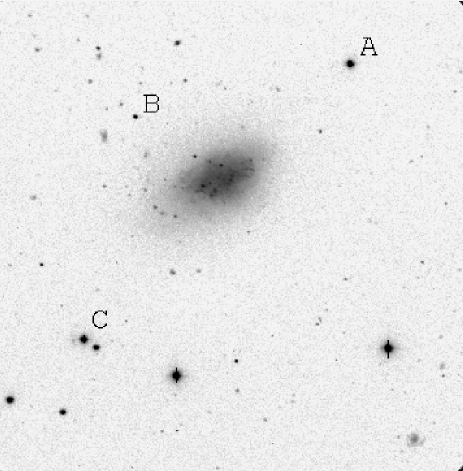
Prime focus CCD images were obtained with the Calar Alto 3.5 m telescope during a photometric night, the details are given in table 1. After debiasing and flatfielding in the usual manner, I constructed an image which contains only the underlying smooth light distribution of the unresolved fainter stars as described by Hopp & Schulte-Ladbeck (1991). This ’smooth mask’ was used to derive the structural parameters by applying the ellipticity fit of Bender & Möllenhoff (1987). Then, the ’smooth masks’ were subtracted from the original B and R images which yielded frames with the resolved stars only. To these frames, DAOPHOT in its MIDAS version was applied, again following Hopp & Schulte-Ladbeck (1991). The frames of both colors were searched independently by DAOPHOT and only those objects were accepted, which were found in both frames. Figure 1 shows the B image of UGC 685.
2.2 H observations
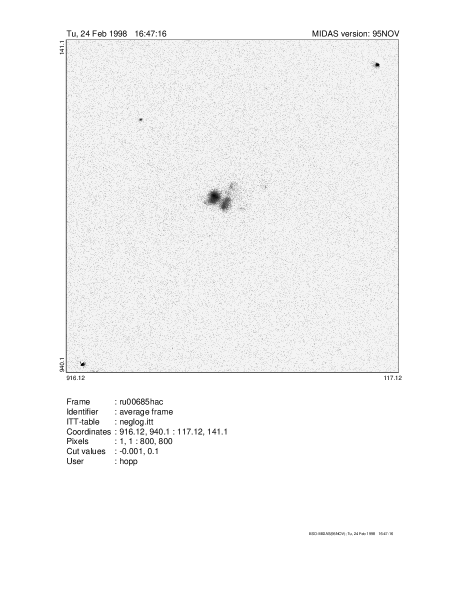
The Calar Alto 2.2m telescope and its CCD camera were used to obtain H- and R-images of UGC 685. The night was of poor photometric quality, thus only a preliminary calibration through the R band observations was applied. Details are given in table 1. As above, the usual CCD calibration frames were obtained and applied and the individual exposures in each filter were added. The R image was flux-scaled to the H-image with the aid of several medium-bright stars and then subtracted, yielding a continuum free H frame of UGC 685 (for more technical details see Bomans et al, 1997). Figure 2 shows the H image of UGC 685.
2.3 J band observations
J-band observations were taken with the Calar Alto 3.5m telescope and its IR camera MAGIC during a photometric night. The set-up details can be found in table 1. After every five object frames, nearby night sky data were taken at 4 different positions around UGC 685. The sets of object frames were slightly shifted against each other. The individual 10 sec. exposures were corrected for bias, dark current, night sky pattern and fixed-pattern noise with the usual calibration data. Then they were transformed into a common reference frame and finally added.
As the on-line facility did not show any signal of UGC 685, no K data were obtained. For the same reason, centering was not perfect and the eastern outskirt of UGC 685 was therefore not mapped within the tiny field of view available with this set-up.
| observations | B,R(c) | H,R | J |
|---|---|---|---|
| date | Oct 12, 1994 | Oct 04, 1994 | Sep. 06, 1995 |
| telescope | CA 3.5m Prim | CA 2.2m Cas | 3.5 m Cas |
| detector | Tektronix CCD | Tektronix CCD | NICMOS3 HgCdTe |
| pixels | 1024 x 1024 | 1024 x 1024 | 256 x 256 |
| pixel size [\arcsec] | 0.53 | 0.28 | 0.33 |
| field of view [\arcmin] | 7 | 4.7 | 1.4 |
| (circle) | (square) | (square) | |
| total exp. time [sec] | 360, 240 | 900, 680 | 1200 |
| seeing [FWHM \arcsec] | 1.1, 1.3 | 1.7, 1.7 | 1.5 |
| standard stars | NGC 2419, NGC 7790 | - | Elias et al |
| Christian et al, 1985 | 1982 |
| property | value | reference |
| RA (1950) | 01 04 43 | NED |
| Decl. (1950) | +16 25 01 | NED |
| Galactic latitude | -46.02 | UGC |
| EB-V | 0.10 | Burstein & Heiles 1982 |
| distance | 0.27 DVirgo | Kran-Korteweg 1986 |
| 6 Mpc | ||
| distance [Mpc] | 5.5 30% | this paper |
| HI [Jy km/s] | 12.6 | Lu et al 1993 |
| HI velocity [km/s] | 157 1 | Lu et al 1993 |
| HI W50 width [km/s] | 73 1 | Lu et al 1993 |
| HI mass [ ] | 8.5 107 | Hoffman et al 1996 |
| Vmax [km/s] | 75 | Hoffman et al, 1996 |
| FIR Iras flux | below limits | Schmidt & Boller 1992a |
| B | 14.55 0.08 | this paper |
| -14.48 | this paper | |
| -14.92 | this paper | |
| B-R | +0.97 0.05 | this paper |
| B-I | +1.39 | Lu et al 1993 and here |
| B-J | +1.55 0.15 | this paper |
| [mag/\arcsec] | 21.57 0.09 | this paper |
| [mag/\arcsec] | 20.65 0.06 | this paper |
| [mag/\arcsec] | 20.11 0.10 | this paper |
| scale length B [pc] | 338 16 | this paper |
| scale length R [pc] | 330 26 | this paper |
| scale length J [pc] | 338 21 | this paper |
| a | 55” (1.46 kpc) | this paper |
| Elipticity | 0.33 | this paper |
| Number of HII regions | 5 | this paper |
| lg LHα [erg s-1] | 38.6 | this paper |

3 Results and Discussion
3.1 Morphology and total fluxes
The B (Fig. 1), R, and J images show a mostly regular galaxy of elliptical shape. Only few brighter and extended knots in a region to the South-East of the center can be seen. The H (Fig. 2) image reveals that these knots are HII regions. To the limits of the images, one bright and 4 fainter, smaller HII regions were identified. The largest one has a diameter of about 9.3\arcsec(0.25 kpc). These few HII regions are clumped in an area of no more than 25\arcsec(0.65 kpc) diameter. This blob of HII regions is off-set from the center by 11\arcsec(0.31 kpc) or about one scale length of the stellar light distribution. Very little diffuse H emission outside the HII regions is visible, but the image which was taken for selecting proper long slit settings might have an exposure time which was too short to detect very faint structures like those describes for example in the case of NGC 4449 by Bomans et al (1997). The long slit spectra along the major axis of UGC 685 cross some of the identified HII regions and indeed reveal the typical emission line pattern of HII regions. Outside these HII regions, but still well inside the low surface brightness envelope, sources with the shape of the point-spread function are visible. These objects trace the resolved brightest stars - mostly supergiants - in UGC 685 even though it is easily possible that some of these ’stars’ may be in reality composed objects like blends of stars or stellar clusters.
A mask was constructed at the 25.0 mag/\arcsec level in B and the flux in B and R inside this isophote was determined, yielding B = 14.55 and B-R = + 0.97 (table 2). Errors are less than 0.1 and are mostly of systematic nature. The B magnitude is in good agreement with those in the literature (see Schmidt & Boller, 1992a). The absolute values derived from these observed magnitudes were computed using the distance estimate of 5.5 Mpc from chapter 3.4 and a correction for galactic foreground extinction as given by Burstein & Heiles (1982). No attempt was done to correct for internal reddening. As already mentioned, the J frames exclude a small part of the faint eastern outskirt, less than 4% of the total area. These outskirts contribute little light, nevertheless the derived J magnitude of 13.00 is more like a good lower limit to the total flux.
I measured the flux in the continuum-free H image and found a flux of which converts to an absolute flux in the H line as given in table 2 (using D = 5.5 Mpc). The Poisson error of this value is small, less than 1%, but almost negligible compared to the error of the zero point calibration of about 20%. Hunter et al. (1994) observed H line fluxes for a sample of late-type galaxies, mostly dwarf irregulars. In comparison to this sample, the H line flux of UGC 685 is normal for an irregular dwarf of its total magnitude and indicates a relatively low recent star formation rate (see below).
3.2 Surface photometry
Figure 3 shows the surface brightness profile, the radial color profil and the variation of the ellipticity with major axis for B and R. UGC 685 has a rather elliptical shape with a mean ellipticity value of 0.33 for both colors. The ellipticity varies only slightly with radius while the (not shown) position angle increases steadily by the small, but significant amount of 20 degree from 10 to 70\arcsec. The surface brightness profile can be traced out to about 70\arcsec in B and 65\arcsec in R. It is interesting to note that in neutral hydrogen, the profile of UGC 685 was traced to a 2.6 times larger radius than here in the optical (see Hoffman et al, 1996 for the HI data). In J, the galaxy was traced down to 23.1 mag/\arcsecand to a distance of 35\arcsec. Within this more limited range, the ellipticity is essentially the same (0.32) as in the CCD color bands.
In all three colors, the profile can be well described by an exponential law outside a central region of about 10\arcsec. The central profiles are significantly flatter. One should remember that in the very center, several knots (HII regions, stars, clusters) were removed, therefore it is difficult to trace the profile there. Outside 10\arcsec, I fitted an exponential brightness profile to the data and got a scale length of 12.4\arcsecto 12.7\arcsec(table 2). Thus, the scale length of the stellar distribution is 10 times smaller than the one of the HI distribution (Hoffman et al, 1996). The obtained parameters, already converted to metric values with the distance estimated below, are given in table 2. They are quite normal for a galaxy of this size and luminosity111The R band data from the 2.2m telescope yielded very similar results: The profile is detected out to about 55\arcsec, is flat in the center, and shows an exponential distribution law with a scale length of 16 1.2\arcsec.. The central surface brightnesses are relatively high for an irregular dwarf with only moderate signs of recent star formation. A color profile was calculated (Fig. 3). Most of the body has the same color while the central part is slightly bluer. B-J, albeit having a larger systematic error, shows no significant variation with radius.
The exponential law parameters were used to calculate asymptotic total magnitudes of 14.11, 13.14, and 12.60 in B, R, and J, respectively.
H emission was only detected in a small area near to the center of UGC 685, slightly off towards the south-east. Thus, the recent places of star formation activity show a strong asymmetry in the angular distribution and are well localized. I measured the H surface brightness as a function of radius and averaged over the azimuth (for a better comparison with similar profiles for other irregular galaxies presented by Hunter et al, 1998). Naturally, this radial H profile is only valid for the small sector (Fig. 2). Outside, the H surface brightness is below the detection limits (about ). Assume that the H flux is a good measure of the total number of ionizing photons emitted in a galaxy. This number can be compared to the photons expected from massive stars for a given initial mass function (IMF). Taking into account the lifetimes of the massive stars, a formation rate of hot stars can be derived and extended to a total star formation rate (SFR) by extrapolating to all stars with the IMF. Hunter & Gallagher (1986, see also Gallagher et al., 1984) used a Salpeter function to establish a conversion formula which I used to transform the observed H surface brightness of UGC 685 into a star formation rate per . A distance of 5.5 Mpc was used. Fig. 4 show the radial profile. Given the uncertainty in the H flux calibration, the only secure feature is the off-center peak in the recent specific star formation activity, and an overall trend that the recent star formation activity drops to larger radii. The shape of the radial distribution of the recent star formation activity in UGC 685 is similar to the one observed in Sex A and IC 1613 (Hunter et al, 1998), even though its overall value is lower than in those two dwarfs. As discussed in more detail by van Zee et al (1998), an azimutal average of the local SFR (as measured by the H flux) can be misleading for irregular dwarf galaxies where the star formation often takes place at only a few places. UGC 685 is obviously a good example for this case. Using again the derivation of Hunter & Gallagher (1986), the total H flux from chapter 3.1 can be transformed into an average SFR over the last yr. I derived 0.003 yr-1 with an error based on the measurement alone of about 20%. Here again, the result depends on the applied distance value of 5.5 Mpc.

The radial color gradient shows no indication that the average SFR varies strongly with location (Fig. 3). A B-R color map shows a quite homogeneous distribution with only small (5% level) deviations in the central area, where recent (and localized) star formation is already indicated by the HII regions.
3.3 Resolved stellar population
A total of 209 stars are detected in both (B and R) frames, down to a limiting magnitude of 24 in both filters. These stars are identified in table 3222An upper flux limit had been set when running DAOPHOT to avoid saturated stars. Therefore, the brightest stars visible in fig. 1 can not be found in table 3, but they are Milky Way objects anyway.. Fainter than 22.5 in R and 23.0 in B, the photometric errors as estimated by the DAOPHOT PSF fitting algorithm are larger than 0.1. 73 of these stars are projected on or belong to UGC 685. As the CCD frames are by far larger than the galaxy, I can determine the surface density of fore- and background objects with stellar PSF. A statistical correction of 5.1 stars was calculated which leaves about 68 stars belonging to UGC 685. The color distribution of the field stars outside UGC 685 (see Fig. 5) shows that most of the contamination contributes in the red while practically all detected blue objects (B-R 0.5) belong to the young population in UGC 685.
Artificial star tests were applied inside DAOPHOT to estimate the completeness of the star detection especially in the magnitude range of the supergiants of UGC 685. 50 stars were added in 1 magnitude bins in several experiments for each of these bins. The recovery rate indicates that the completeness starts to drop from almost 100 % at 21.9 (22.7) in R (B) and the 50% completeness magnitudes are about 22.9 (23.7) in R (B).
| No. | X | Y | B | R | B-R | ||
|---|---|---|---|---|---|---|---|
| arc sec | arc sec | mag | mag | mag | mag | mag | |
| 12 | 323.7 | 11.2 | 22.19 | 0.05 | 21.08 | 0.06 | 1.11 |
| 13 | 280.5 | 11.6 | 22.85 | 0.05 | 20.63 | 0.08 | 2.22 |
| 18 | 106.1 | 16.4 | 23.77 | 0.21 | 22.42 | 0.11 | 1.35 |
| 29 | 221.1 | 28.6 | 23.58 | 0.11 | 21.39 | 0.07 | 2.19 |
| 31 | 287.6 | 29.6 | 21.94 | 0.05 | 20.22 | 0.04 | 1.73 |
| 32 | 213.5 | 31.6 | 20.14 | 0.05 | 18.74 | 0.05 | 1.40 |
| 35 | 3.4 | 32.9 | 23.38 | 0.13 | 21.54 | 0.09 | 1.84 |
| 39 | 272.6 | 35.7 | 20.28 | 0.02 | 18.91 | 0.02 | 1.37 |
| 40 | 318.5 | 36.9 | 21.67 | 0.04 | 20.08 | 0.05 | 1.59 |
| 45 | 271.9 | 41.5 | 21.72 | 0.07 | 20.78 | 0.09 | 0.93 |
| 52 | 2.0 | 53.1 | 22.80 | 0.09 | 20.87 | 0.08 | 1.93 |
| 53 | 108.7 | 56.7 | 23.52 | 0.11 | 21.99 | 0.07 | 1.53 |
| 55 | 181.2 | 60.1 | 23.42 | 0.16 | 21.50 | 0.07 | 1.91 |
| 56 | 207.6 | 59.7 | 21.30 | 0.03 | 20.39 | 0.03 | 0.91 |
| 58 | 278.5 | 60.1 | 21.83 | 0.04 | 20.81 | 0.03 | 1.02 |
| 59 | 218.1 | 61.5 | 22.72 | 0.07 | 21.10 | 0.07 | 1.62 |
| 60 | 318.8 | 61.0 | 23.80 | 0.23 | 21.67 | 0.09 | 2.13 |
| 62 | 241.1 | 61.8 | 22.34 | 0.07 | 21.33 | 0.07 | 1.01 |
| 66 | 178.0 | 65.5 | 22.22 | 0.05 | 21.86 | 0.07 | 0.37 |
| 68 | 304.9 | 67.1 | 23.35 | 0.14 | 21.78 | 0.09 | 1.56 |
| 67 | 138.3 | 66.9 | 22.55 | 0.06 | 21.15 | 0.09 | 1.40 |
| 69 | 6.2 | 67.9 | 22.26 | 0.05 | 20.60 | 0.06 | 1.66 |
| 79 | 158.0 | 75.4 | 23.31 | 0.14 | 21.86 | 0.12 | 1.45 |
| 81 | 160.3 | 77.4 | 23.32 | 0.13 | 22.79 | 0.18 | 0.53 |
| 82 | 57.8 | 78.1 | 23.06 | 0.07 | 21.59 | 0.09 | 1.47 |
| 83 | 255.6 | 77.6 | 21.66 | 0.07 | 20.88 | 0.09 | 0.77 |
| 87 | 266.5 | 80.8 | 22.45 | 0.04 | 20.72 | 0.03 | 1.73 |
| 91 | 244.8 | 86.7 | 18.73 | 0.02 | 17.16 | 0.03 | 1.58 |
| 95 | 199.8 | 91.2 | 23.25 | 0.11 | 21.66 | 0.08 | 1.59 |
| 96 | 26.5 | 94.2 | 22.69 | 0.07 | 22.00 | 0.10 | 0.70 |
| 97 | 165.2 | 94.5 | 22.67 | 0.10 | 20.87 | 0.06 | 1.81 |
| 98 | 106.7 | 97.8 | 20.94 | 0.02 | 20.06 | 0.03 | 0.88 |
| 99 | 270.5 | 98.6 | 22.52 | 0.09 | 21.27 | 0.09 | 1.26 |
| 104 | 267.9 | 101.4 | 21.62 | 0.09 | 19.74 | 0.08 | 1.87 |
| 111 | 222.3 | 107.0 | 22.81 | 0.11 | 20.59 | 0.03 | 2.22 |
| 113 | 246.3 | 108.1 | 24.09 | 0.19 | 22.98 | 0.18 | 1.11 |
| 114 | 324.0 | 107.9 | 23.42 | 0.11 | 22.14 | 0.10 | 1.28 |
| 123 | 236.5 | 114.3 | 22.45 | 0.08 | 20.25 | 0.06 | 2.20 |
| 124 | 157.4 | 114.8 | 23.50 | 0.15 | 22.27 | 0.11 | 1.22 |
| 128 | 31.1 | 116.5 | 22.68 | 0.07 | 20.82 | 0.05 | 1.86 |
| 133 | 200.5 | 116.4 | 20.22 | 0.02 | 19.29 | 0.02 | 0.94 |
| 134 | 237.3 | 116.1 | 22.21 | 0.05 | 20.06 | 0.06 | 2.15 |
| 135 | 144.2 | 117.6 | 24.13 | 0.28 | 23.27 | 0.24 | 0.86 |
| 138 | 149.4 | 118.4 | 22.68 | 0.06 | 21.48 | 0.07 | 1.20 |
| 143 | 158.7 | 119.4 | 21.66 | 0.04 | 20.97 | 0.03 | 0.70 |
| 145 | 39.3 | 120.2 | 22.80 | 0.09 | 21.87 | 0.10 | 0.93 |
| 146 | 189.2 | 120.3 | 21.11 | 0.03 | 20.65 | 0.05 | 0.46 |
| 149 | 165.2 | 121.4 | 21.77 | 0.04 | 21.43 | 0.05 | 0.34 |
| 157 | 184.6 | 123.9 | 22.71 | 0.09 | 22.57 | 0.20 | 0.14 |
| 155 | 180.9 | 123.1 | 20.54 | 0.02 | 19.61 | 0.01 | 0.92 |
| 165 | 158.8 | 125.9 | 22.05 | 0.04 | 21.39 | 0.06 | 0.66 |
| 166 | 161.9 | 125.5 | 22.00 | 0.08 | 21.62 | 0.11 | 0.37 |
| 169 | 173.7 | 126.2 | 21.91 | 0.04 | 21.62 | 0.08 | 0.30 |
| 171 | 156.7 | 126.7 | 22.15 | 0.06 | 22.26 | 0.12 | -0.11 |
| 176 | 171.9 | 128.7 | 22.18 | 0.08 | 20.82 | 0.06 | 1.36 |
| No. | X | Y | B | R | B-R | ||
|---|---|---|---|---|---|---|---|
| arc sec | arc sec | mag | mag | mag | mag | mag | |
| 180 | 68.5 | 129.3 | 23.25 | 0.13 | 21.81 | 0.06 | 1.44 |
| 186 | 167.9 | 130.2 | 22.43 | 0.06 | 21.69 | 0.10 | 0.74 |
| 189 | 173.9 | 130.7 | 21.77 | 0.04 | 21.24 | 0.07 | 0.52 |
| 193 | 162.6 | 130.9 | 22.46 | 0.07 | 21.61 | 0.11 | 0.85 |
| 194 | 172.4 | 131.3 | 21.42 | 0.05 | 21.27 | 0.04 | 0.16 |
| 195 | 189.2 | 131.0 | 23.31 | 0.10 | 22.35 | 0.14 | 0.97 |
| 198 | 209.9 | 132.6 | 22.29 | 0.06 | 21.88 | 0.07 | 0.41 |
| 200 | 179.2 | 133.2 | 22.34 | 0.06 | 21.55 | 0.06 | 0.79 |
| 203 | 165.0 | 133.5 | 24.14 | 0.29 | 22.11 | 0.16 | 2.02 |
| 206 | 222.8 | 133.6 | 22.03 | 0.04 | 21.36 | 0.04 | 0.67 |
| 207 | 173.8 | 134.1 | 20.67 | 0.03 | 20.15 | 0.03 | 0.52 |
| 208 | 180.1 | 134.3 | 22.51 | 0.07 | 21.12 | 0.05 | 1.39 |
| 212 | 195.6 | 135.5 | 23.11 | 0.14 | 22.59 | 0.17 | 0.51 |
| 214 | 209.4 | 134.7 | 22.66 | 0.11 | 22.00 | 0.10 | 0.66 |
| 216 | 188.9 | 136.3 | 21.23 | 0.02 | 19.55 | 0.02 | 1.68 |
| 217 | 175.7 | 136.8 | 21.73 | 0.04 | 21.32 | 0.06 | 0.40 |
| 221 | 182.1 | 137.7 | 23.54 | 0.22 | 22.14 | 0.15 | 1.40 |
| 222 | 204.4 | 138.2 | 22.48 | 0.08 | 21.29 | 0.05 | 1.19 |
| 223 | 92.9 | 138.4 | 23.38 | 0.13 | 21.65 | 0.05 | 1.73 |
| 226 | 251.9 | 138.7 | 23.37 | 0.12 | 21.64 | 0.05 | 1.73 |
| 227 | 268.1 | 138.7 | 21.90 | 0.05 | 21.03 | 0.07 | 0.87 |
| 229 | 215.3 | 138.9 | 22.04 | 0.07 | 21.98 | 0.06 | 0.06 |
| 232 | 209.5 | 140.2 | 21.85 | 0.04 | 21.49 | 0.04 | 0.35 |
| 233 | 176.2 | 140.8 | 22.48 | 0.06 | 22.71 | 0.20 | -0.22 |
| 238 | 198.6 | 142.4 | 21.79 | 0.05 | 21.36 | 0.05 | 0.43 |
| 237 | 237.3 | 141.6 | 21.67 | 0.03 | 20.82 | 0.04 | 0.85 |
| 239 | 205.4 | 142.0 | 22.91 | 0.14 | 22.30 | 0.15 | 0.61 |
| 241 | 200.7 | 142.6 | 22.67 | 0.09 | 22.32 | 0.10 | 0.34 |
| 243 | 173.0 | 143.4 | 23.21 | 0.15 | 22.94 | 0.24 | 0.27 |
| 247 | 177.5 | 143.7 | 23.71 | 0.18 | 22.92 | 0.29 | 0.80 |
| 245 | 193.0 | 143.4 | 23.27 | 0.29 | 22.32 | 0.13 | 0.95 |
| 246 | 168.9 | 143.8 | 22.92 | 0.13 | 21.83 | 0.10 | 1.09 |
| 249 | 249.6 | 145.1 | 22.45 | 0.06 | 21.81 | 0.08 | 0.64 |
| 250 | 188.3 | 145.9 | 21.10 | 0.05 | 21.06 | 0.07 | 0.04 |
| 262 | 320.8 | 147.2 | 22.05 | 0.07 | 20.59 | 0.07 | 1.46 |
| 263 | 180.0 | 148.7 | 23.52 | 0.14 | 22.39 | 0.16 | 1.13 |
| 265 | 203.5 | 150.1 | 22.75 | 0.09 | 22.23 | 0.08 | 0.52 |
| 269 | 178.6 | 151.0 | 22.08 | 0.05 | 21.77 | 0.09 | 0.31 |
| 270 | 12.9 | 151.3 | 21.77 | 0.04 | 19.92 | 0.03 | 1.85 |
| 271 | 207.0 | 151.4 | 23.99 | 0.21 | 22.20 | 0.08 | 1.79 |
| 273 | 149.0 | 153.7 | 23.10 | 0.10 | 22.23 | 0.10 | 0.88 |
| 274 | 230.0 | 154.2 | 20.90 | 0.03 | 19.96 | 0.03 | 0.95 |
| 279 | 224.9 | 158.8 | 22.08 | 0.06 | 20.68 | 0.10 | 1.40 |
| 282 | 215.1 | 161.3 | 20.97 | 0.02 | 20.02 | 0.02 | 0.95 |
| 286 | 69.3 | 164.8 | 23.24 | 0.12 | 21.80 | 0.10 | 1.44 |
| 290 | 65.5 | 166.3 | 23.35 | 0.12 | 21.87 | 0.08 | 1.49 |
| 293 | 245.5 | 167.6 | 23.88 | 0.21 | 22.79 | 0.18 | 1.09 |
| 297 | 160.4 | 172.7 | 21.86 | 0.04 | 20.82 | 0.04 | 1.03 |
| 302 | 247.2 | 175.9 | 22.45 | 0.06 | 20.63 | 0.03 | 1.82 |
| 304 | 276.8 | 179.4 | 23.61 | 0.14 | 22.57 | 0.14 | 1.03 |
| 306 | 211.7 | 180.1 | 22.79 | 0.07 | 21.51 | 0.05 | 1.28 |
| 310 | 246.9 | 185.4 | 24.06 | 0.22 | 22.72 | 0.13 | 1.34 |
| 313 | 330.5 | 189.1 | 22.97 | 0.09 | 22.03 | 0.10 | 0.94 |
| 317 | 30.8 | 195.2 | 21.58 | 0.03 | 19.87 | 0.04 | 1.72 |
| 320 | 315.0 | 197.2 | 19.56 | 0.03 | 17.75 | 0.06 | 1.81 |
| 323 | 338.5 | 197.5 | 22.46 | 0.06 | 20.74 | 0.04 | 1.71 |
| 325 | 2.6 | 201.0 | 23.17 | 0.08 | 22.25 | 0.14 | 0.91 |
| 327 | 197.8 | 202.1 | 21.80 | 0.03 | 21.05 | 0.03 | 0.76 |
| 328 | 26.0 | 202.7 | 23.35 | 0.08 | 21.89 | 0.07 | 1.46 |
| 331 | 216.9 | 203.0 | 21.25 | 0.06 | 20.36 | 0.08 | 0.89 |
| 336 | 33.7 | 207.1 | 23.44 | 0.12 | 22.11 | 0.08 | 1.33 |
| 337 | 88.0 | 207.9 | 21.55 | 0.05 | 19.70 | 0.04 | 1.84 |
| No. | X | Y | B | R | B-R | ||
|---|---|---|---|---|---|---|---|
| arc sec | arc sec | mag | mag | mag | mag | mag | |
| 340 | 300.9 | 210.1 | 23.89 | 0.20 | 21.80 | 0.08 | 2.09 |
| 342 | 125.2 | 212.0 | 23.11 | 0.08 | 21.87 | 0.09 | 1.24 |
| 343 | 44.4 | 213.9 | 23.39 | 0.09 | 21.93 | 0.11 | 1.46 |
| 345 | 273.3 | 216.0 | 23.05 | 0.06 | 21.47 | 0.08 | 1.58 |
| 349 | 178.3 | 220.8 | 23.41 | 0.07 | 21.95 | 0.09 | 1.46 |
| 351 | 134.5 | 224.3 | 24.10 | 0.23 | 22.85 | 0.19 | 1.25 |
| 353 | 300.2 | 227.9 | 21.99 | 0.05 | 20.98 | 0.08 | 1.01 |
| 354 | 56.7 | 229.2 | 23.39 | 0.09 | 22.01 | 0.09 | 1.38 |
| 356 | 102.1 | 231.0 | 22.67 | 0.06 | 21.96 | 0.08 | 0.70 |
| 357 | 6.9 | 232.2 | 22.76 | 0.09 | 21.65 | 0.07 | 1.10 |
| 358 | 24.5 | 232.2 | 23.80 | 0.21 | 21.63 | 0.07 | 2.18 |
| 361 | 199.6 | 234.5 | 23.72 | 0.17 | 22.50 | 0.12 | 1.22 |
| 366 | 107.5 | 237.5 | 22.19 | 0.08 | 21.35 | 0.06 | 0.84 |
| 372 | 251.9 | 239.4 | 22.32 | 0.07 | 21.42 | 0.07 | 0.91 |
| 375 | 109.1 | 241.6 | 20.93 | 0.05 | 19.31 | 0.05 | 1.62 |
| 380 | 233.7 | 247.2 | 23.03 | 0.09 | 21.59 | 0.07 | 1.44 |
| 384 | 249.6 | 247.9 | 24.72 | 0.30 | 23.40 | 0.26 | 1.32 |
| 387 | 303.2 | 248.1 | 23.48 | 0.13 | 22.13 | 0.12 | 1.35 |
| 385 | 89.2 | 248.2 | 22.22 | 0.07 | 21.27 | 0.07 | 0.96 |
| 391 | 16.9 | 251.3 | 23.06 | 0.11 | 21.79 | 0.10 | 1.27 |
| 396 | 262.6 | 254.3 | 23.64 | 0.16 | 22.20 | 0.07 | 1.44 |
| 400 | 166.7 | 261.7 | 23.57 | 0.14 | 21.79 | 0.06 | 1.79 |
| 402 | 1.1 | 262.8 | 23.24 | 0.12 | 22.64 | 0.14 | 0.61 |
| 405 | 227.4 | 264.3 | 23.45 | 0.15 | 22.37 | 0.13 | 1.09 |
| 407 | 169.6 | 269.2 | 19.40 | 0.04 | 17.72 | 0.05 | 1.68 |
| 409 | 128.4 | 271.3 | 23.47 | 0.13 | 21.27 | 0.06 | 2.21 |
| 408 | 62.0 | 271.6 | 23.25 | 0.09 | 22.38 | 0.14 | 0.87 |
| 410 | 15.9 | 272.9 | 22.40 | 0.08 | 20.66 | 0.07 | 1.74 |
| 417 | 15.1 | 280.2 | 20.44 | 0.05 | 18.80 | 0.07 | 1.65 |
| 418 | 277.1 | 282.8 | 23.59 | 0.16 | 22.20 | 0.09 | 1.39 |
| 421 | 82.3 | 285.4 | 23.57 | 0.16 | 22.02 | 0.08 | 1.56 |
| 424 | 314.4 | 287.2 | 23.74 | 0.17 | 22.54 | 0.15 | 1.20 |
| 427 | 52.8 | 290.5 | 22.80 | 0.08 | 21.65 | 0.11 | 1.15 |
| 428 | 168.9 | 291.4 | 21.66 | 0.05 | 20.60 | 0.07 | 1.07 |
| 430 | 43.8 | 292.8 | 23.52 | 0.12 | 22.66 | 0.16 | 0.85 |
| 432 | 126.9 | 294.7 | 23.26 | 0.10 | 21.77 | 0.08 | 1.49 |
| 433 | 215.1 | 294.8 | 22.93 | 0.05 | 22.48 | 0.14 | 0.45 |
| 436 | 36.8 | 297.6 | 23.58 | 0.14 | 21.53 | 0.09 | 2.04 |
| 440 | 127.7 | 299.4 | 23.02 | 0.09 | 22.10 | 0.08 | 0.92 |
| 444 | 322.7 | 303.2 | 23.92 | 0.25 | 22.53 | 0.14 | 1.39 |
| 446 | 299.2 | 307.4 | 16.62 | 0.05 | 15.45 | 0.04 | 1.17 |
| 445 | 190.3 | 307.2 | 23.20 | 0.09 | 22.22 | 0.13 | 0.98 |
| 447 | 346.9 | 309.9 | 23.24 | 0.15 | 21.68 | 0.09 | 1.55 |
| 451 | 148.0 | 313.2 | 22.37 | 0.07 | 20.87 | 0.07 | 1.50 |
| 457 | 211.1 | 316.6 | 23.08 | 0.11 | 21.15 | 0.04 | 1.92 |
| 461 | 73.4 | 319.8 | 23.33 | 0.12 | 22.26 | 0.10 | 1.07 |
| 464 | 225.1 | 321.8 | 22.37 | 0.07 | 20.68 | 0.06 | 1.69 |
| 465 | 231.2 | 323.7 | 23.32 | 0.10 | 22.20 | 0.13 | 1.12 |
| 467 | 36.9 | 324.4 | 22.31 | 0.12 | 21.58 | 0.10 | 0.73 |
| 471 | 48.5 | 325.9 | 22.43 | 0.07 | 21.35 | 0.07 | 1.08 |
| 478 | 144.2 | 331.5 | 23.59 | 0.14 | 22.12 | 0.10 | 1.48 |
| 485 | 45.8 | 336.9 | 23.22 | 0.13 | 22.28 | 0.11 | 0.94 |
| 488 | 142.9 | 340.0 | 24.18 | 0.17 | 23.05 | 0.21 | 1.12 |
| 499 | 183.8 | 349.1 | 22.58 | 0.07 | 21.77 | 0.07 | 0.81 |
Figure 5 shows the color-magnitude diagram of the UGC 685. The left part shows all 209 detected points sources and indicates the 50% completeness limit while the right panel presents only those 173 stars where the photometric errors are less than 0.2 in B and R. The open symbols indicate the 136 sources which belong to the field around UGC 685 while the filled dots indicate the 73 sources in UGC 685. 56 of the UGC 685 objects have photometric errors less than 0.2 in both bands.
A comparison with Geneva evolutionary tracks (fig. 6) as well as with the Padua isochrones (Meynet et al, 1994; Bertelli et al, 1994) indicates that several blue supergiants and fewer yellow supergiants have been resolved in the mass range 15 to 60 (ZAMS). Given the higher field contamination, is difficult to detect a red supergiant population. Again, one should remember that some of these objects, especially of the blue ones, might be unresolved clusters. Having only one color in most cases, clusters (or blends) can not be distinguished. Naturally, clusters of blue stars can be brighter than individual stars. Contrary, HII regions have been identified unambiguously with the H image.


3.4 The distance of UGC 685
The brightest blue supergiants (BBSG’s) have a long tradition as distance indicators (K&T, R&RR). It is usual to determine the mean of the three brightest blue supergiants, , and apply a calibration as provided by K&T and R&RR to derive the distance modulus of the considered galaxy. The detailed analysis of R&RR clearly shows that one is limited to an accuracy of 0.8 mag. at best. Thus, can give only a first estimate of the true distance. This still excludes uncertainties which are introduced by the selection of the candidates as interlopers from the fore- and background as well as unresolved blends or clusters. Furthermore, the luminosity of the BBSG’s depends on the luminosity of the host galaxy. This dependance has been explained through numerical simulations as a statistical effect (Greggio, 1986, and references therein). The simulation further showed that deviations from the mean relation between and up to 1 mag. can be expected in the B band for galaxies which are as faint as UGC 685. This explains the rather low accuracy of the method as derived from empirical data by R&RR. The errors given in the following are based on the derivation by R&RR.
I identified the four brightest candidates for supergiants (No. 146, 194, 217, and 250 in table 3) where I used B-R 0.4 as color selection criterion for blue supergiants, approximating the B-V color selection of K&T. The three brightest candidates yield a mean magnitude of = 20.9 0.6. To get an estimate of the uncertainty introduced by clusters or blends, I also calculated from the second to fourth brightest blue objects and got 21.4 0.3. The values corrected for the Milky Way foreground extinction are 20.6 and 21.1, respectively. Following R&RR, their relation and fig. (10f), and using the above values for and total magnitude after reddening correction, I obtain an absolute magnitude for the brightest blue supergiants of about -7.9 and a distance modules (distance) of 28.7 (5.5 Mpc). According to R&RR, the minimum error of a distance modulus derived from their relation (10f) is 0.88. To this value, I added quadratically the error of and the - almost negligible - error in total magnitude. This yields a total error of 1.0 in distance modulus or about 35% in distance. The derived distance value was used to convert observed to absolute values as given in table 2 and to adjust the tracks (fig. 6). Following the calibration of K&T yields almost identical values.
I was able to identify four individual sources in the J frame which could be cross-correlated with the objects from the B and R frames (table 4). The colors were corrected for the Milky Way foreground reddening. Assuming that these four objects are supergiants and that UGC 685 itself does not contribute internal reddening, one can translate the position in the B-Rc, B-J color-color diagram to a spectral type using the table of Johnson (1966). The Johnson table was transfer into Cousins R with Bessels (1987) relation. Using the blue absolute magnitudes of supergiants for these spectral types as listed by Schmidt-Kaler (1982), one gets distance moduli as also given in table 4. Three objects combine to m-M = 28.8 (5.8 Mpc), including the fourth one yields 29.1 (6.7 Mpc). I take this as a consistency check for the B3 method. The deviating result for the fourth object shows the limitation of this approach and may be caused by a blend or one of the above assumptions may not be valid in this case.
| star number | B | B-R | B-J | Spectral | m-M0 |
|---|---|---|---|---|---|
| from table 3 | type | ||||
| 155 | 20.54 | 0.93 | 0.66 | F1I: | 28.78 |
| 176 | 22.18 | 1.36 | 1.47 | F9I | 30.12 |
| 207 | 20.67 | 0.52 | 0.43 | A5I | 28.91 |
| 216 | 21.33 | 1.68 | 2.18 | G5I | 28.71 |
The two distance estimates presented here are in rather good agreement with an estimate based on the observed HI velocity and a Virgo infall model which yields about 6.0 Mpc (Schmidt & Boller, 1992a). Thus, UGC 685 really belongs to the 10 Mpc sample and is quite isolated in space.
3.5 Star formation history
According to the results described so far, UGC 685 is in the right distance for an HST multicolor study which would provide the data for a detailed reconstruction of the star formation history (Schulte-Ladbeck et al. 1998, see also the review by Grebel, 1997). Even though the ground-based data presented in this paper have a much more limited resolution, they already indicate that the recent star formation rate (SFR) is rather low and that it varied only slightly during the past.
According to the results in chapter 3.2 and 3.3, the observed total H flux corresponds to a recent (within the last yr) SFR of 0.003 yr-1. As shown, this activity is spatially highly concentrated. The resolved supergiants and the underlying light distribution are related to slightly older star formation activities. The resolved supergiants are almost all inside 26 arc sec (major axis) which corresponds to 0.70 kpc or 2 scale lengths of the overall light distribution. This indicates that averaged over a longer time interval of yr, the SF took place all over the central part of UGC 685. This is supported by the absence of significant color gradients in B-R and B-J and the very limited deviation from the average in the color map.
A further estimator of the SFR of an actively star forming galaxy is its total blue luminosity. As described by Gallagher et al. (1984), this estimator is strictly valid only for a constant SFR and depends on the assumed IMF and its upper and lower mass cut-offs. It also slightly depends on the chemical composition of the system (see Gallagher et al., 1984, for complete references). The blue light is dominated by stars of ( yr). Applying the Gallagher et al. formula (7) yields the same SFR as derived from the H flux. Thus, I have little evidence for strong variations of the SFR with time up to yr.
To strengthen this point, I used the total optical colors B-R and B-I (table 2). I compared the observed, dereddened colors with Bruzual & Charlot (1994) models with exponential declining star formation rate of e-folding time . Models with Gyr do not fit the colors at all and are far too red. A Gyr model can reproduce the colors rather well with deviations of less than 0.1333A formation time of , h = 0.6, and are assumed; B-J is not used because of some uncertainties of the NIR model colors.. Models with an exponential decay and a recent, even small, burst are in conflict with the data. Therefore, also the colors support the scenario of a simple star formation history.
In other words, the isolated dwarf irregular galaxy UGC 685 seems to have an approximately constant and low SFR, roughly stable for the past yr. The SFR is also quite low when compared to other galaxies of the same morphological type – actually, UGC 685 ranges at the lower end of measured SFR values of irregular galaxies. As I applied the formulae of Gallagher et al (1984), Hunter & Gallagher (1985, 1986), it is straightforward to compare the obtained SFR’s of UGC 685 to the values for their sample galaxies. For dwarf irregular galaxies, they found SFR values between 0.5 and 0.0002 yr-1 (giant irregulars: 0.3 to 1.1). The SFR correlate with the absolute blue magnitude. Galaxies which have the similar M as UGC 685 show similar SFR values.
As indicated by the amount of detected HI gas, this galaxy can continue with star formation at its today rate for quite a long time. To do so, the reservoir of far outlying HI gas has to be moved into those central regions where conditions obviously support star formation. As no external trigger seems to be present, this might be a very slow process, depending on the dynamical evolution of the extended HI disk. It might even be possible that the stellar body of todays UGC 685 will already be totally dimmed to an object resembling a dwarf spheroidal before this outlying gas is able to move in. In this context, it is interesting to note that Carignan et al. (1998) found some outlying HI gas in the Sculptor dwarf spheroidal galaxy.
4 Conclusions
Optical broad and narrow band as well as NIR imaging data were presented and used to derive the structural parameters of the isolated dwarf galaxy UGC 685 which show very little signs of irregularities. UGC 685 is one of those dwarfs where the HI gas is reaching to far greater distances than the stars, and might be, like DDO 154, a good case for dark matter halo studies. In a separate paper, I will show that the stellar and ionized gas kinematics fit quite well to the HI rotation curve established by Hoffman et al (1996). Total fluxes and colors, the color distribution, and the especially H flux and morphology point to a low star formation rate. Even for dwarf irregular galaxies, it is at the lower boundary of the observed values (Hunter& Gallagher, 1985, 1986). The overall star formation history seems to be calm at a level of 0.003 yr-1 over the last yr, but this particular irregular dwarf was nevertheless able to establish a surface brightness at the upper boundary of dwarfs of this size (compare to Binggeli, 1993, his Fig. 4, or Hopp, 1994, Fig. 1). Over short intervals ( yr), the star formation activity appears strongly localized. Data with much better resolution are needed for a more detailed study and reconstruction.
A new distance estimate was established based on the resolved brightest supergiants. This new estimates confirms that UGC 685 belongs to the 10 Mpc sample of the very nearby universe and is indeed a very isolated galaxy.
Acknowledgements.
I would like to thank the Calar Alto staff for his kind support during the observations. Drs. Ralf Napiwotzki and Sabine Moehler helped with the electronic version of the Kurucz tables. I acknowledge many useful discussions with Drs. Bender, Greggio, Rosa, and Schulte-Ladbeck. Niv Drory did the Bruzual & Charlot model calculations. I was supported by the DFG (hopp/1801-1) and by the SFB 375.References
- [1] Babul,A., Ferguson,H., 1996, ApJ 458, 100
- [2] Bender,R., Möllenhoff,C., 1987, A&A 177, 71
- [3] Bessel, M.S., 1987, PASP 99, 642
- [4] Bertelli,G., Bressan,A., Chiosi,C., Fagotto,F., Nasi,E., 1994, A&AS 106,275
- [5] Binggeli, B., 1993, in: ’Panchromatic View of Galaxies’, G. Hensler, Ch. thies, J.S. Gallagher (eds.), Edition Frontieres, p. 173
- [6] Bomans,D., Chu,Y.H., Hopp, U., 1996, AJ 113, 1678
- [7] Bruzual, A.G., Charlot, S., 1993, ApJ 405, 538
- [8] Burstein D., Heiles C., 1982, AJ 87, 1165
- [9] Carignan, C., Beaulieu, S., Cote, S., Demers, S., Mateo, M., 1998, AJ in press (astro-ph/9807222)
- [10] Christian C.A., Adams M., Barnes J.V., Butcher H., Mould J.R., Siegel M., 1985, PASP 97, 363
- [11] Elias,J.H., Frogel,J.A., Matthew,K., Neugebauer,G., 1982, AJ 87, 1029
- [12] Ferguson,H., Babul,A., 1998, MNRAS, preprint, astro-ph/9801057
- [13] Gallart,C, Aparicio,A., Vilchez,J.M., 1996, AJ 112, 1928
- [14] Gallagher, J. S., Hunter, D. A., Tutukov, A.V., 1984, ApJ 284, 544
- [15] Grebel, E.K., 1997, Rev. in Modern Astron. 10, 29
- [16] Greggio,L., 1986 A&A 160, 111
- [17] Greggio,L., 1994, ESO Conf. Workshop Proc. 51, 72
- [18] Hoffman,G.L., Salpeter,E.E., Farhat,B., Roos,T., Williams,H., Helou,G., 1996, ApJS 105, 269
- [19] Hopp,U., 1994, ESO Conference & Workshop Proc. 49, 37
- [20] Hopp,U., Schulte-Ladbeck,R.E., 1991, A&A 248, 1
- [21] Hunter,D., 1997, PASP 109, 937
- [22] Hunter, D. A., Gallagher, J. S., III, 1985, ApJS 58, 533
- [23] Hunter, D. A., Gallagher, J. S., III, 1986, PASP 98, 5
- [24] Hunter, D. A., Hawley, W. N., Gallagher, J. S., III, 1994, AJ 106, 1797
- [25] Hunter,D., Elmegren,B.G.., Backer,A.L., 1998, ApJ 493, 595
- [26] Johnson, H.L., 1966, ARA&A 4, 193
- [27] Karachentsev,I.D., Tikhonov, N.A., 1993, ESO Conf. Workshop Proc. 49, 109 (K&T)
- [28] Kran-Korteweg,R., 1986, A&AS 66, 255
- [29] Kran-Korteweg,R., Tammann,G.A., 1979, AN 300, 181
- [30] Kurucz, R.L., 1992, in: The Stellar Populations of Galaxies, eds. B. Barbuy & A. Renzini, Dordrecht, Kluwer, p. 255
- [31] Lu,N.Y., Hoffman,G.L., Groff,T., Roos.T., Lamphier,C., 1993, ApJS 88, 383
- [32] Meynet,G., Maeder,A., Schaller,G., Schaerer,D., Charbonnel,C., 1994 A&AS 103, 97
- [1994] Rozanski,R., Rowen-Robinson,M., 1994, MNRAS 271, 530 (R&RR)
- [33] Schaller, G., Schaerer, D., Meynet, G., Maeder, A., 1992 A&AS 96, 269
- [34] Schmidt,K.H., Boller, Th., 1992a, AN 313, 190
- [35] Schmidt,K.H., Boller, Th., 1992b, AN 313, 330
- [36] Schmidt-Kaler,Th., 1982, in: Landolt-Börnstein, Numerical Data and Functional Relationships in Science and Technology, N.S. VI, 2b, ed. K.H. Hellwege, Springer-Verlag, Berlin
- [37] Schulte-Ladbeck,R.E., Crone,M.M., Hopp,U., 1998, ApJ 493, L23
- [38] Taylor, C.L., Brinks, E., Grashuis, R.M., Skillman, E.D., 1996 ApJS 102, 189
- [39] van Zee, L., Skillman, E. D., Salzer, J. J., 1998, AJ in press (astro-ph/9806246)