Search for new YSOs in Large Molecular Clouds and extinction mapping using DENIS and optical data
Abstract
I present new results on the extinction and on the YSO content of the Chamaeleon I cloud using the star count method that I have implemented and applied to DENIS and optical data. Application of this method to other nearby Large Molecular Clouds is in progress and is briefly outlined.
Observatoire de Paris, DESPA, 5 place Jules Janssen, F-92195 Meudon Cedex, France
1. Introduction
I recently reported on an original method to produce accurate extinction maps of large nearby molecular clouds. This method, based on adaptive star counts and wavelet decomposition, has been successfully applied to the nearby Chamaeleon I molecular cloud using massive –band star counts provided by DENIS (Cambrésy et al. 1997, Cambrésy 1998). The combination of an extinction map and multicolour photometric near–infrared data such as those provided by DENIS, are powerful tools to investigate the young stellar populations of a star–forming region. In this poster I present, on one side, new identifications of YSO candidates in Cha I and, on the other side, further applications of my method to optical data and their use to draw out extensive maps of moderate extinction.
2. New YSO candidates in the Chamaeleon I cloud
The detection of an infrared excess in a star, after removing the effect of cloud reddening, is a classical, but powerful method to discover new YSO candidates within a dark cloud. Every star detected in the Cha I cloud by DENIS has been dereddened using the extinction map previously drawn out. These values of extinction must be considered as an upper limit of the extinction suffered by the stars. To select new YSO candidates, I have represented all stars in a colour–magnitude diagram ( versus ) and picked up stars which are off the main sequence by a distance corresponding to more than 8 magnitudes of visual extinction. Fifty four new YSO candidates have been selected in this way (Cambrésy et al 1998).
These new candidates are clearly concentrated in regions where the visual extinction is greater than 2. This argues in favour of their youth. Extinction could be underestimated if small size globules, not resolved in the extinction map (i.e. smaller than approximately 2 arcminutes) would lie on the line of sight of the object.
Assuming that the new candidates are mainly T Tauri stars, I can trace, together with already known T Tauri stars their luminosity function, and attempt to derive their basic properties such as their mass and age. Applying theoretical evolutionary tracks of D’Antona & Mazzitelli (1994) and assuming the Miller and Scalo initial mass function, I can derive theoretical luminosity functions (KLF), , for different ages ranging from to years. I applied a singular value decomposition in order to solve the following system of equations :
where is the observed KLF.
Figure 1 represents the observed and the best fitted theoretical KLFs. This best fitting method suggests that two critical ages can be derived. One, corresponding to years, is consistent with the end of an active star formation period in the cloud. The other, years, represents the maximum lifetime of the disc, since I assume that the criterion of infrared excess used to select new candidates yields only stars surrounded by massive circumstellar discs.

3. Extinction mapping with optical data
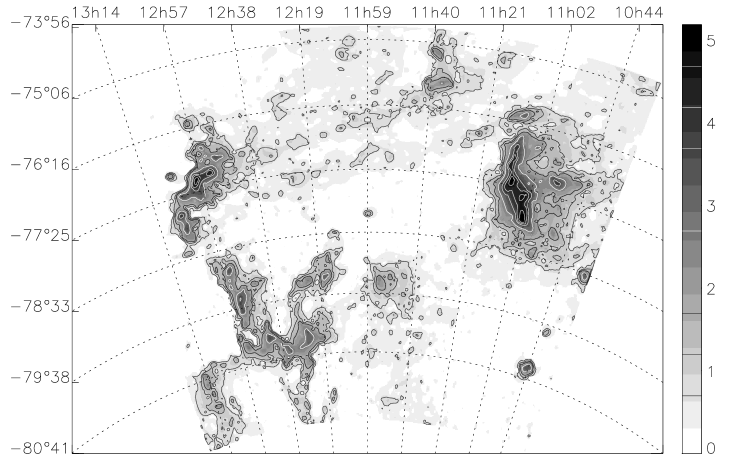
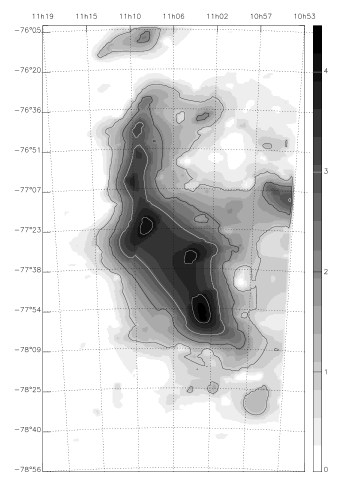
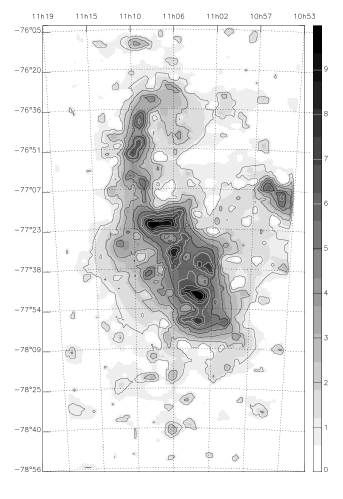
The method that I have developed to produce maps of the extinction can be applied to optical data provided by the digitisation of Schmidt plates. The USNO catalogue (Monet 1996) provides and photometry for the all sky. These data allow large scale mapping of (moderate) extinction and are useful to identify the most obscured areas where near–infrared data are required to provide further information, basically when the optical extinction is greater than 5 magnitudes. Figure 2 and 3 represents the extinction map of the whole Chamaeleon complex ( square degrees) and the comparison between and extinction maps of the Chamaeleon I cloud, respectively. Comparison of the Chamaeleon map derived from and star counts (Cambrésy et al 1997) shows significant differences. Optical data indicate a maximum of visual extinction of about 5 magnitudes, while a maximum of 10 AV is reached when using counts. Moreover 4 different cores with AV greater than 7 can be separated thanks to counts. Since the extinction in band is only one third of the visual extinction, near–infrared data allow deeper investigations of the cloud. For areas with low extinction, optical data are the most useful. The large scale map of the Chamaeleon complex shows the possible dust connection between the different components of the whole cloud.
 |
 |
4. Conclusion
Large scale multi–wavelengths optical and near–infrared digitised surveys provide immense databases that contain unprecedented numbers of stars with good photometry. They provide the observational material that dramatically renew the interest of the classical, but powerful star count method to derive interstellar extinction. I have implemented new computer tools that allow to take maximum benefit of these huge databases to draw out arcminute resolution map of extinction and applied them to the freshly recorded DENIS data on the Cha I cloud. These maps are very useful to identify intrinsically red objects which are likely to be YSOs and T Tauri stars. I have started to extend this method to most of the large molecular clouds such as the all Chamaeleon complex, Carina Nebula, Coalsack, Corona Australis, Lupus, Musca, Orion, Ophiuchus, Rosetta, Taurus, Serpens, etc… using the incoming DENIS data, and, at larger scale, the optical data for moderate absorptions. I expect that the combination of extinction maps based on B, R, I, J, K counts will strongly improve our knowledge of the distribution and physical properties of the dust within clouds and in the Milky Way, in general.
References
Cambresy, L., Epchtein, N., Copet, E., de Batz, B., Kimeswenger, S., Le Bertre, T., Rouan, D., & Tiphène, D. 1997, A&A, 324, L5
Cambresy, L. 1998, in The Impact of Near-Infrared Sky Surveys on Galactic and Extragalactic Astronomy, Ed. N. Epchtein, Kluwer ASSL ser. 230, 157
Cambresy, L., Copet, E., Epchtein, N., de Batz, B., Borsenberger, J., Fouqué, P., Kimeswenger, S. & Tiphène, D. 1998, A&A, in press
D’Antona, F. & Mazzitelli, I. 1994, ApJS, 90, 467
Lawson, W.A., Feigelson, E.D., Huenemoerder, D.P. 1996, MNRAS, 280,1071
Monet, D. 1996, BAAS, 188, 5404
Whittet, D.C.B., Kirrane, T.M., Kilkenny, D., Oates, A.P., Watson, G. 1987, MNRAS, 224, 497