email: stefan@mso.anu.edu.au, wood@mso.anu.edu.au, bessell@mso.anu.edu.au
Be stars in and around young clusters in the Magellanic Clouds
Abstract
We present the results of a search for Be stars in six fields centered on the young clusters NGC 330 and NGC 346 in the SMC, and NGC 1818, NGC 1948, NGC 2004 and NGC 2100 in the LMC. Be stars were identified by differencing R band and narrow-band H CCD images. Our comparatively large images provide substantial Be star populations both within the clusters and in their surrounding fields. Magnitudes, positions and finding charts are given for the 224 Be stars found. The fraction of Be stars to normal B stars within each cluster is found to vary significantly although the average ratio is similar to the average Be to B star ratio found in the Galaxy. In some clusters, the Be star population is weighted to magnitudes near the main sequence turn-off. The Be stars are redder in than normal main-sequence stars of similar magnitude and the redness increases with increasing H emission strength.
Key Words.:
Stars: emission-line – Stars: Be – Galaxies: clusters – Galaxies: Magellanic Clouds1 Introduction
In this paper we present the results of a photometric survey for Be stars within and around six young clusters in the Magellanic Clouds. Such studies have been carried out on Galactic clusters but they are limited there by the relative paucity of Be stars. The young populous Magellanic Cloud clusters examined in this paper present us with large samples of Be stars in a range of metallicity environments and the opportunity to further examine the mechanism for formation of Be stars.
Searches for Be stars in the Magellanic Clouds have been made by Feast (fea72 (1972)) using objective prism techniques, and the more recently by Grebel et al. (gre92 (1992)), Bessell and Wood (bes92 (1992)) (who gave a brief description of some of the results presented in this paper) and Grebel (gre97 (1997)) using CCD-based imaging photometry. These latter searches involved imaging through an H filter so that Be stars, which show strong H emission, stand out in comparison to normal stars. Photometric techniques such as these are very efficient methods of identifying Be stars, in particular within dense clusters where spectroscopy is difficult.
The main purpose of the present study is to provide a sample of Be stars for follow-up spectroscopy and to see if there are differences in Be star populations between different clusters and between clusters and the local field population. The results of the follow-up spectroscopy will be presented in a subsequent paper. Because the present study is ground-based, its spatial resolution is seeing limited, which means that we are unable to search for Be stars in the cluster cores. In another paper, we will present the results of a search for Be stars in the cluster cores using HST imaging. The present paper provides the comparison sample of Be stars in the local field and the outer cluster zones. The complete data set of ground-based and HST images will allow an accurate comparison of field and cluster Be stars properties. In this paper, however, we make some initial comparisons with the more limited data set described herein.
2 Observations and Data Reduction
The photometric search method we used to detect Be stars involved taking a CCD image through a narrow-band (15 Å) H filter and comparing this image with a similar image obtained in the Cousins band. Stars with strong H emission should appear brighter in the H image than in the R image. Given that a typical Be star has H emission with a full width at half maximum of 7 Å and peak H flux 5 times the local continuum flux, this sort of search with a 15 Å filter is readily capable of detecting Be stars.
The observations were obtained using direct CCD imaging on the 1-m telescope at Siding Spring Observatory from September to November 1991. All H images were 900 second exposures. images were obtained immediately before or after each H image in order to avoid the possibility of stellar variability affecting our measure of emission strength. A Tektronix 10241024 CCD with pixels of scale 0.6″ was used for these observations, giving us an imaged area of typically 10′10′ (compared with 5.7′5.7′ in Grebel gre97 (1997)). and images were obtained at the same time for some fields, and in some cases on other nights using a GEC 7701152 CCD. A log of the observations is presented in Table 1.
The CCD images were processed with IRAF and the photometry of the fields was done using the DoPHOT photometry package (Mateo and Schechter mat89 (1989)). Standard magnitudes in and were derived from the standards used in Sebo and Wood (seb94 (1994)) and from magnitudes given by Walker (wal96 (1996)). The and H magnitudes were not standardised and H colours have an arbitrary zeropoint.
| Cluster | Date(1991) | Filter | Exposure Time |
|---|---|---|---|
| NGC 330 | Sept. 04 | V | 300s |
| I | 150s | ||
| Oct. 31 | R | 300s | |
| H | 900s | ||
| NGC 346 | Nov. 29 | V | 150s |
| I | 100s | ||
| R | 150s | ||
| H | 900s | ||
| NGC 1818 | Sept. 04 | V | 80s |
| I | 150s | ||
| Oct. 31 | R | 300s | |
| H | 900s | ||
| NGC 1948 | Oct. 30 | V | 120s |
| I | 120s | ||
| R | 200s | ||
| H | 900s | ||
| NGC 2004 | Nov. 29 | V | 20s |
| V | 150s | ||
| I | 15s | ||
| I | 100s | ||
| R | 15s | ||
| R | 100s | ||
| H | 900s | ||
| NGC 2100 | Nov. 29 | V | 120s |
| I | 100s | ||
| R | 100s | ||
| H | 900s |
3 Selection of Be and other H emitting stars
In order to detect stars with H emission, plots were made of the colour index H against for all the stars which were common to the , , and H frames. Figs. 1 (NGC 330), 2 (NGC 346), 3 (NGC 1818), 4 (NGC 1948), 5 (NGC 2004) and 6 (NGC 2100) show the (H, ) diagrams produced. As noted in Section 2, the H zero-point is arbitrary in these plots, although the zero-point was chosen so that normal main-sequence stars had H 0.


The stars with strong H emission were selected from the above figures. Using Fig. 1c as a typical case, we note that most main-sequence stars lie in a tight clump around H=0.0 and =, while nearly all cooler stars form an almost horizontal band. These two groups of stars do not have detectable H emission. However, there is another group of stars extending up and slightly to the red of the main-sequence clump: these stars clearly show significant H emission and they are Be stars. Occasional cooler (giant) stars also exhibit strong H emission.
The dispersion in H of normal MS stars about the centre of the clump is determined largely by the photometric errors in the narrow-band H magnitude, and this uncertainty will depend on the magnitude of the star. We limit our Be star selection process to stars with 17.5, which corresponds approximately to an error in H colour of 0.2 magnitudes. In order to select a sample of Be stars, we draw a line in each of the H diagrams parallel to the sequence of non-emission line stars and at a distance of 0.4 magnitudes above it, which gives a high probability that we exclude all members of the clump of normal main-sequence stars.
Our observations were made under seeing conditions of 1.5–2″, and as a consequence the central regions of the clusters suffer from crowding. We therefore exclude the innermost 15″ (in radius) of each cluster from the Be star search. On each image taken, we select a radius at which the stellar density drops to a value indistinguishable from that of the surrounding field. Stars within this radius are assumed to belong to the cluster, and those outside to the field. The radius selected for each cluster is given in the captions of Figs. 1 to 6.
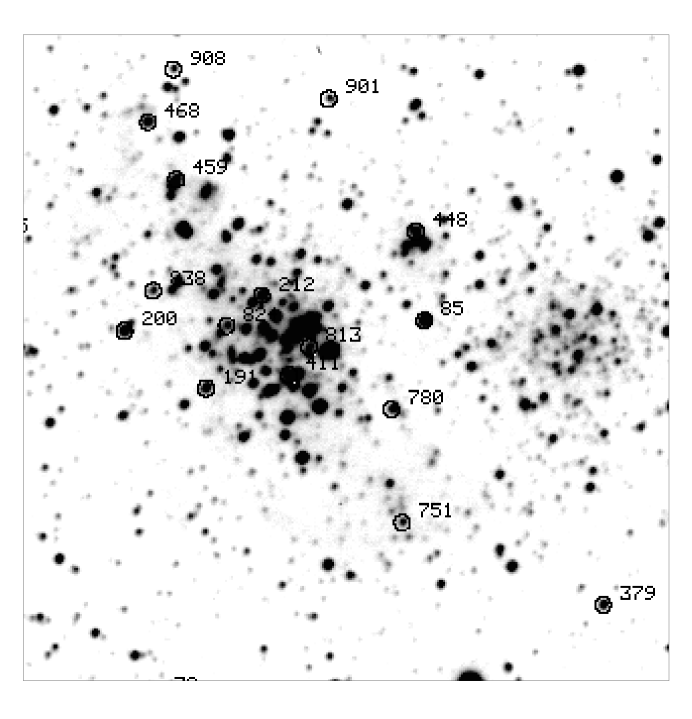
The positions, magnitudes and colours of the Be stars selected as described above are listed in Tables 2 (NGC 330), 3 (NGC 346), 4 (NGC1818), 5 (NGC 1948), 6 (NGC 2004) and 7 (NGC 2100). Tables 2-7 are available in electronic form from the CDS. The astronomical coordinates in these tables were derived from the secondary astrometric standards of Tucholke et al. (tuc96 (1996)). Finding charts for the Be stars are given in Figs. 14 and 15 (NGC 330), 16 and 17 (NGC 346), 18 and 19 (NGC 1818), 20 (NGC 1948), 21 and 22 (NGC 2004), and 23 and 24 (NGC 2100).
4 Comparison with past surveys for Be stars
We now compare the results of our study to those of previous Be star surveys within NGC 330 and NGC 1818 in order to get some idea of our detection efficiency. Although there have been a few reports of detections of Be stars in other clusters (e.g. Kjeldsen and Baade kje94 (1994)), it is only for NGC 330 and NGC 1818 that any information is available regarding the identity of the Be stars.
4.1 NGC 330
Grebel et al. (gre92 (1992)) have searched the region close to NGC 330 for Be stars using narrow-band H photometry. Within 50″ of the cluster centre they find 29 Be stars while we find 32. However, the Be star samples found in the two respective searches are not completely identical. Of the 18 Be stars for which Grebel et al. provide identifications (they list names from Robertson rob74 (1974) and Arp arp59 (1959)), we find 16. We suspect that variability of the Be phenomenon may account for the differences in the two Be star samples (see Section 4.2). Overall, however, the two searches find similar numbers of stars. Our search area is considerably larger than that of Grebel et al. which will allow us to compare the properties of reasonable samples of both field and cluster Be stars.
NGC 330 and its surroundings have been searched extensively for variable stars by Sebo and Wood (seb94 (1994)) and Balona (bal92 (1992)). A number of the Be stars and one of the H emitting red giants found here are known variables. The variable star identifications are listed in Table 2. A spectrum of the variable red giant was obtained by Sebo and Wood (seb94 (1994)) and it does indeed show a broad H emission line.
4.2 NGC 1818
Grebel (gre97 (1997)) presents the results of a Be star search within a 5.7′ 5.7′ field around NGC 1818. Outside a radius of 15″ from the cluster centre, a total of 48 Be stars were found. The study of Grebel (gre97 (1997)) was made under excellent seeing conditions and has a limiting magnitude of 20. Grebel’s selection criterion required Be stars to be 0.2 magnitudes above the main-sequence clump in the (H, ) diagram, compared to our 0.35 magnitudes (see Grebel’s Fig. 3 with our Fig. 3b). However, given our H filter bandpass of 15 Å and Grebel’s bandpass of 33 Å, the sensitivities of the two surveys should be similar, at least for the brighter stars where photon noise in the H filter is 0.35 magnitudes in our case, or 0.2 magnitudes in Grebel’s case.
Grebel (gre97 (1997)) finds 21 Be stars with 17.5 (the magnitude limit of our study), of which we have identified 13 in common. Of the 8 unidentified stars, 7 are near our magnitude limit and have 17.1 17.5: furthermore, most lie in crowded regions. More interestingly, we detected 6 Be stars that have no counterparts in the survey of Grebel. This is perhaps surprising given the fainter magnitude limit and better seeing of the Grebel survey. These stars, which are all comparatively bright and lie in uncrowded regions, are unlikely to be misidentifications. We thus seem to have strong evidence for the episodic nature of the Be phenomenon in Magellanic Cloud stars: such behaviour is frequently seen in galactic Be stars (Hanuschik et al. han93 (1993)). It is also possible that some of the Be stars found by Grebel, but which we failed to detect, were not exhibiting H emission at the time of our observation.
In summary, both the present survey and the surveys of Grebel et al. (gre92 (1992)) and Grebel (gre97 (1997)) find similar numbers of Be stars, although our survey may be incomplete near the magnitude limit of 17.5 in crowded regions. Because of the episodic nature of the Be phenomenon, single-epoch surveys may miss a significant fraction of the total Be star population (20% appears to have been missed in the case of NGC 1818).
5 Photometric properties of the Be star population
There are a number of interesting correlations between the photometric indices of Be stars observed here which may shed some light on the nature of the Be star phenomenon. Starting with Figs. 1 to 6, we see that within the clusters, as well as in the field, Be stars exist over a wide range of luminosities. Since the Be stars in the clusters are all of essentially the same age (field contamination of the cluster Be star populations should be 10% based on the small cluster area), the wide range in Be star luminosities means that the Be phenomenon can occur at any time throughout the main-sequence lifetime, and need not be confined to particular evolutionary phases such as the core contraction phase at the end of the main-sequence.
Another interesting correlation is seen in the (H, ) plots (Figs. 1c to 6c). Here we see a significant trend for the strongest emitters, as measured by the H colour, to be those with the reddest . This effect was also noted by Grebel (gre97 (1997)). The fact that Be stars are redder in than normal B stars is also obvious from Figs. 1a,b to 6a,b where, at a given , the Be stars are clearly redder than the normal main-sequence stars. An increase in redness of Be stars with increased strength of H emission has also been noted in the infrared (e.g. Dachs et al. dac88 (1988)).
It is widely accepted that the Be phenomenon is associated with rapid rotation of the stellar photosphere and the presence of a circumstellar disk of comparatively cool material which gives rise to the observed H emission. The observed increase in of Be stars with increased strength of H emission is almost certainly the result of one or more of four factors: a real reduction in stellar effective temperature due perhaps to rotation, a changed spectral energy distribution due to rotational distortion of the stellar atmosphere, continuum and line emission from the disk, or absorptive reddening caused by circumstellar matter. The first two factors result from changes in the structure of the star, while the latter two involve circumstellar matter only. The viewing angle will also effect the colours in the non-spherical geometry.
In this regard our photometric colours do not constitute a conclusive test of the mechanism responsible for the apparent reddening of Be stars. Fig. 7 shows plots of and against for Be stars and normal B stars within and around the cluster. The values come from Balona and Jerzykiewicz (jerky (1993)). The zero point of is arbitrary (since the magnitude has not been zero-pointed) but has been adjusted to be close to the value expected for the normal hot B stars.
In the (, ) plot, the Be stars fall on a sequence that is essentially indistinguishable from the sequence followed by non-H emitting stars. This overlap is coincidental and is the consequence of the spectral distribution of the continuum emission from the circumstellar envelope (Kaiser kaiser (1989)) within the and bands. The position of the Be stars in the (, ) in Fig. 7 is suggestive of a systematic shift to the right of the sequence of normal main-sequence stars, shown by the continuous line. In this case significant emission due to Paschen continuum emission from the circumstellar envelope is located in the band alone. Hence the Be stars appear shifted to the right relative to the non-Be stars.
Also shown in Fig. 7 are the reddening lines from Taylor(tay86 (1986)). On the (, ) plot, it is clear that the Be stars do not follow the reddening line, suggesting that the red colours of the Be stars are not due to circumstellar dust absorption.

The effect on colour of rotational distortion of the atmosphere of a Be star has been examined by Collins et al. (col91 (1991)). However, even in the case of a star rotating near breakup, the maximum predicted change in colour (from the colour of a non-rotating B star) is only 0.05 magnitudes (Zorec & Briot zor97 (1997)), compared to changes of up to 0.15 magnitudes seen in Fig. 7. It therefore seems that this effect is not a major contributor to the reddening of Be stars.
The final possibility is that the red colours of the Be stars compared to the colours of non-Be stars at the same luminosity (as seen in Figs. 1a to 6a) are due to a real change in the photospheric flux distribution through the bands caused by a change in stellar effective temperature. However, since the bulk of the flux of these stars is emitted shortward of , it remains to be seen whether the Be stars really do have lower effective temperatures than B stars of similar luminosity. This question will be examined in forthcoming papers which will give spectral types of the stars, and HST ultraviolet magnitudes from which values can be accurately compared between the Be and normal B stars.
6 Comparison of cluster and field Be star populations
The Magellanic Clouds offer us an opportunity to examine the field population of Be stars in different localities in an unbiased way - a task which is virtually impossible from within our own galaxy due to depth and reddening effects. For the purposes of our survey we can regard each CCD image as essentially a volume and magnitude limited sample of the population.
We have defined the cluster extent by a direct examination of the radial variation in surface density of bright blue stars ( 17 and 0.6), as described in Section 3. Some stars co-eval with the cluster stars probably exist outside our adopted radii. In particular, we note that Elson et al. (els87 (1987)) have examined the surface density of stars around a sample of young LMC clusters and suggested that some of these clusters are tidally unbound with up to 50% of their total mass in an unbound halo (although the halo is of very low surface density compared to the background).
The CMDs for both the cluster and field of NGC 330, NGC 346, NGC 1948, NGC 2004 and NGC 2100 are very similar (see Figs. 1b to 6b). This indicates that the field populations contain stars of age similar to that of the cluster. We have investigated the fraction of stars along the main-sequence that are Be stars by binning both emission-line and non-emission-line stars with 0.5 into 1/2 magnitude bins in . Figs. 8 to 13 show our results. In Table 2, we give the numbers of Be stars and main-sequence stars with 17 for each cluster and its surrounding field: we also give the ratio of Be to main-sequence stars (with a 1- error).
Here we have made the assumption that comparison of the number of Be stars to B stars within a certain luminosity range is a valid comparison. This assumption is challenged by the study of Zorec & Briot (zor97 (1997)) who claim that the location of Be stars within the CMD is the result of a visual luminosity excess. The excess described by Zorec & Briot rises from 0.0 at B9 to -0.5 at B0 in a linear manner. Here we do not adjust for excess as we consider the size of the associated uncertainties in the correction similar to the size of the correction itself.


The fraction of Be stars in the field populations lies in the range 0.10 to 0.27. The mean value is a similar to the fraction of Be stars in the Galactic field which is 0.17 (Zorec and Briot zor97 (1997)). The fractions of Be stars in the clusters is quite variable. The clusters NGC 330 (see also Grebel et al. gre92 (1992)) and NGC 2100 are particularly rich in Be stars, NGC 1818 has a moderate richness, while NGC 346, NGC 1948 and NGC 2004 have low Be star fractions. In the Galaxy, Zorec and Briot (zor97 (1997)) noted that the Be star fraction reached a maximum of 0.34 at spectral type B1. The fraction of Be stars in NGC 330 (0.340.08) is perfectly consistent with this value. In a forthcoming paper, the correlation of Be star ratio with spectral type will be examined.
| cluster stars | field stars | |||||||||
| 17 | 16 17 | 16 | 17 | 16 17 | 16 | |||||
| Cluster | NMS | NBe | NBe/NMS | NBe/NMS | NBe/NMS | NMS | NBe | NBe/NMS | NBe/NMS | NBe/NMS |
| NGC 330 | 79 | 27 | 0.340.08 | 0.250.08 | 0.480.15 | 128 | 27 | 0.210.04 | 0.120.04 | 0.190.08 |
| NGC 346 | 78 | 11 | 0.140.05 | 0.190.08 | 0.110.05 | 127 | 23 | 0.180.04 | 0.190.06 | 0.170.05 |
| NGC 1818 | 92 | 19 | 0.210.05 | 0.160.06 | 0.270.10 | 38 | 10 | 0.270.10 | 0.160.09 | 0.500.2 |
| NGC 1948 | 81 | 11 | 0.140.04 | 0.100.05 | 0.190.08 | 100 | 10 | 0.100.03 | 0.100.04 | 0.110.06 |
| NGC 2004 | 124 | 16 | 0.130.03 | 0.080.04 | 0.180.06 | 224 | 26 | 0.110.02 | 0.090.03 | 0.120.03 |
| NGC 2100 | 67 | 19 | 0.280.07 | 0.260.10 | 0.330.11 | 185 | 25 | 0.140.03 | 0.130.04 | 0.150.05 |
In order to compare the Be star fraction near the main-sequence turnoff with the Be fraction for less evolved stars, we have divided the stars into two groups: the brighter stars with 16 and the fainter stars with 17 16, all stars having 0.6. The Be star fractions for these groups are given for the clusters and their surrounding fields in Table 2. From these ratios, and looking at Figs. 8 to 13, it seems that for most of the clusters and fields there is no statistically significant difference between the Be star fractions near the main-sequence turnoff and further down the main-sequence. There are a few distinct exceptions to this rule: the clusters NGC 330 and NGC 2004 show a significantly higher fractions of Be stars near the main-sequence turnoff than at fainter magnitudes, as does the field of NGC 1818 (where the four brightest main-sequence stars are all Be stars).
7 Discussion
We now examine what our observations imply about the Be mechanism. In the literature, binarity, pulsation and rotation have been suggested as the mechanism for the establishment and maintainence of the circumstellar material seen in Be stars.
Harmanec and Ki (har76 (1976)) have suggested that Be stars comprise a population of interacting binaries. In this model, elaborated upon by Pols et al. (pol91 (1991)), emission arises from material in accretion onto the secondary component. The difficulty that remains with this model is that the expected number of close interacting binaries is too few to account for the observed population of Be stars (VanBever and Vanbeveren van97 (1997)). Our observations, particularly the high Be star ratio in NGC 330, do not favour the interacting binary hypothesis as the population of stars required to be in mass exchanging binary systems near the MS turnoff (Abt abt87 (1987)) is too high.
The non-radial pulsator model for Be activity (Vogt and Penrod vog83 (1983); Baade baa87 (1987)) has gained support from the recent work of Dziembowski et al. (dzi93 (1993)). In their models, Dziembowski et al. have shown that an instability domain exists on the main-sequence that almost fills the gap between Sct and Cep variables. These slowly pulsating B-type stars span a range of mass from 3 to 6 . The Be star Cen has been intensively studied by Rivinius et al. (riv98 (1998)). From their analysis of photospheric radial velocity variations they have discerned six discrete periods between 0.27-0.51 days. Rivinius et al. suggest that when the majority of these modes are in constructive interference, expulsion of material and a line emission outburst occurs.
There are problems with associating the Magellanic Cloud Be stars observed here with the pulsation instability mechanism described above. Firstly, in conditions of reduced metallicity such as those within the Magellanic Clouds, the extent of the pulsation instability domain is reduced (Dziembowski et al. dzi93 (1993)) and Cep instability is seemingly extinguished (Balona bal92 (1992)). Most importantly, the Be stars observed here are by no means confined to a range 6 M⊙. Indeed our observations show that the largest proportion of Be stars occurs at 14–15 M⊙.
The most widely accepted explanation for the Be phenomenon is that it is a result of the rapid rotation of the B star. This explanation was originally put forward by Struve (str31 (1931)). In its modern incarnation, due to Bjorkman and Cassinelli (bjo93 (1993)), the stellar wind from a rapidly rotating star is concentrated and confined to a disk around the equatorial plane of the star. The model of Bjorkman and Cassinelli predicts a maximum likelihood for disk formation near spectral type B2 (where the stellar angular velocity required for disk formation is 55% that of the critical breakup velocity). Observations of Galactic Be stars find that the highest Be star fraction does indeed occur at early spectral types (B1 according to Zorec and Briot zor97 (1997)). Within our sample spectral types are available for only five of our flagged Be candidates. We will present further spectral types in a forthcoming paper.
Assuming the Be phenomenon is related to the formation of an equatorial disk caused by rapid rotation, we would expect that clusters which form from gas that has a high angular momentum content would contain a high fraction of Be stars. Indeed, the evidence is suggestive that Galactic clusters whose stars present a higher than average rotational velocity have larger populations of Be stars (Mermilliod mermill (1982)). In the Magellanic Clouds, the cluster NGC 330 has a noticeably ellipsoidal shape which may suggest that the cluster as a whole formed from material of higher angular momentum and that, as a consequence, the cluster stars have a rapid rotation rate. This would certainly be consistent with the high Be star content of NGC 330. In a future paper we will examine the rotation velocities of samples of stars within and around the clusters NGC 330 and NGC 2004 to see if the overall Be star fraction is related to average cluster star rotation velocity.
The tendency for there to be a higher Be star fraction near the main-sequence turnoff in some clusters also appears consistent with the rapid rotation hypothesis for Be star formation. The evolution of rapidly rotating stars has been examined by Endal and Sofia (end79 (1979)) and Endal (end82 (1982)). These models explicitly follow the radial exchange of angular momentum with evolution.
In the models of Endal and Sofia, stars commencing their main-sequence lives with relatively slow angular velocity remain slow rotators throughout the whole of the main-sequence evolutionary phase (although there is a marked increase in angular velocity of all stars during the core contraction phase associated with exhaustion of hydrogen in the core, this evolutionary phase is far too short to account for the observed proportion of Be stars). Thus slow rotators will never evolve into Be stars.
In contrast to the slow rotators, the models of Endal and Sofia show that stars commencing their lives with an angular velocity greater than 56-76% of the critical breakup velocity spin up to the critical velocity over a moderate fraction of the main-sequence lifetime. In a cluster where some fraction of the stars is formed with angular velocity greater than 50% of , those stars nearer the main-sequence turnoff are more likely to be Be stars since they will have been more spun up by evolution than the less luminous stars that have not evolved as far through the main-sequence phase. This process could explain the concentration of Be stars to the main-sequence tip seen in NGC 330, NGC 2004 and NGC 1818. We add the cautionary note that Endal and Sofia (end79 (1979)) and Endal (end82 (1982)) made a detailed study of only a single star which had a mass of 5 M⊙, much less than the turnoff masses of 15 M⊙ which is appropriate for the clusters observed here. For comparison with Magellanic Cloud data, models such as those of Endal and Sofia need to be made at higher masses and lower metallicities.
Other factors which might influence the Be star fraction are metallicity and age. However, neither of these factors seem to influence the Be star fractions in our data. To examine abundance dependence, we note that the two SMC clusters are probably more metal poor than the LMC clusters by a factor of about two (Russell and Bessell rus89 (1989)). However, in the SMC, NGC 330 has a high Be star content while NGC 346 does not. At the higher abundance of the LMC, clusters with a range of Be star content are present, and the range is similar to the range in the SMC in spite of the abundance difference between SMC and LMC. Turning to age, we note that the clusters studied here have ages of 1–3107 years, although these ages are uncertain by factors of 2–3 because of uncertainties in the amount of convective core overshoot which occurs in real stars. For comparison of Be star fractions with age, we take from the literature the following ages: NGC 330, 20 Myr (Chiosi et al. chi95 (1995)); NGC 346, 13 Myr (Massey et al. mas89 (1989)); NGC 1818, 30 Myr (Will et al. will2 (1995)); NGC 1948, 155 Myr (Vallenari et al. val93 (1993)); NGC 2004, 20 Myr (Caloi and Cassatella cal95 (1995)); NGC 2100, 15 Myr (Cassatella et al. cas96 (1996)). There does not appear to be any correlation of Be star fraction with age: the cluster NGC 330 with the highest Be star fraction has an intermediate age and the oldest cluster (NGC 1818) has an intermediate Be star fraction. This result contrasts with the results of Mermilliod (mermill (1982)) who noted a trend of decreasing Be fraction with increasing age amongst young Galactic clusters.
8 Summary
We have presented the results of a photometric survey for Be stars in six fields centred on NGC 330 and NGC 346 in the SMC, and NGC 1818, NGC 1948, NGC 2004 and NGC 2100 in the LMC. In all six of these young populous clusters we find large numbers of Be stars.
The Be stars are shown to be redder in than main-sequence stars of similar . Furthermore, the displacement to the red increases with increasing H emission line strength. Some suggested causes for the redness of Be stars were examined using the widely accepted model that Be stars are main-sequence stars with a surrounding disk. Our photometric observations suggest that the redness of the stars is due to emission from the circumstellar envelope, in line with the results of detailed spectrophotometric studies based upon galactic samples.
The fraction of main-sequence stars that are Be stars varies significantly between the various clusters from 0.10–0.34. The average value is close to the average fraction of 0.17 seen in the Galaxy, and the maximum value is also similar to the maximum Galactic value, which occurs at spectral type B1. It was noted that the cluster with the maximum Be star fraction, NGC 330, is distinctly elliptical, suggesting that the stars in it formed out of rapidly rotating material and that there is a connection between rapid rotation and the Be phenomenon. No connection between Be star fraction and age or metallicity was evident. In some clusters, the Be stars tend to be concentrated toward the main-sequence turnoff. This is consistent with evolutionary models which predict that stars which form with rotation velocities more than 50% of the breakup value spin up as they evolve, reaching the breakup velocity over a moderate fraction of the main-sequence lifetime.
Acknowledgements.
We thank Alistair Walker for making available his photometry prior to publication. SCK acknowledges the support of an Australian Postgraduate Award scholarship. We thank our referee Eva Grebel for her useful comments.References
- (1) Abt H.A., 1987, in IAU Colloquium 92, The Physics of Be Stars, eds. A. Slettebak and T.P. Snow (CUP:Cambridge), p.470
- (2) Arp H., 1959, AJ 64, 245
- (3) Baade D., 1987, in IAU Colloquium 92, The Physics of Be Stars, eds. A. Slettebak and T.P. Snow (CUP: Cambridge), p.361
- (4) Balona L.A. 1992, MNRAS 256, 425
- (5) Balona L.A., Jerzykiewicz M., 1993, MNRAS 260, 782
- (6) Bessell M.S., Castelli F., Plez B., 1998, A&A 333, 231
- (7) Bessell M.S., Wood P.R., 1992, in New Aspects of Magellanic Cloud Research, eds. B. Baschek, G. Klare, J. Lequeux (Springer: Berlin), p.271
- (8) Bjorkman J.E., Cassinelli J.P., 1993, ApJ 409, 429
- (9) Caloi V., Cassatella A., 1995, A&A 295, 63
- (10) Cassatella A., Barbero J., Brocato E., Castellani V., Geyer E.H., 1996, A&A 306, 125
- (11) Chiosi C., Vallenari A., Bressan A., Deng L., Ortolani S., 1995, A&A 293, 710
- (12) Collins G.W., Truax R.J., Cranmer S.R., 1991, ApJS 77, 541
- (13) Dachs J., Poetzel R., Kaiser D., 1989, A&AS 78, 487
- (14) Dachs J., Engels D., Kiehling R., 1988, A&A 194, 167
- (15) Dziembowski W.A., Moskalik P., Pamyatnykh A.A., 1993, MNRAS 265, 588
- (16) Elson R.A.W., Fall S.M., Freeman K.C., 1987, ApJ 323, 54
- (17) Endal A.S., 1982, in IAU Symposium 98, Be Stars, eds. M. Jaschek, H.-G. Groth (Reidel: Dordrecht), p. 299
- (18) Endal A.S., Sofia S., 1979, ApJ 232, 531
- (19) Feast M.W., 1972, MNRAS 159, 113
- (20) Grebel E.K., Richtler T., de Boer K.S., 1992, A&A 254, L5
- (21) Grebel E.K., 1997, A&A 317, 448
- (22) Hanuschik R.W., Dachs J., Baudzus M., Thimm G., 1993, A&A 274, 356
- (23) Harmanec P., Ki S., 1976, in IAU Symposium 70, Be and Shell Stars, ed. A. Slettebak (Dordrecht: Reidel), p.3
- (24) Kaiser D., 1989, A&A 222, 187
- (25) Kjeldsen H., Baade D., 1994, in IAU Symposium 162, Pulsation, Rotation and Mass Loss in Early-Type Stars, eds. L.A. Balona, H.F. Hendrichs, J.M. le Contel (Kluwer: Dordrecht), p.271
- (26) Massey P., Parker J.W., Garmany C.D., 1989, AJ 98, 1305
- (27) Mateo M., Schechter P., 1989, in Proc. 1st ESO/ST-ECF Data Analysis Workshop, eds. F. Murtagh, R.H. Warmels (ESO: Garching), p.69
- (28) Mermilliod J.-C., 1982 A&A, 109, 48
- (29) Pols O.R., Cote J., Waters L.B.F.M., Heise J., 1991, A&A 241, 419
- (30) Rivinius T., Baade D., S̆tefl S., Wolf B., Kaufer A., 1998, A&A 336, 177
- (31) Robertson J.W., 1974, A&AS 15, 261
- (32) Russell S.C., Bessell M.S., 1989, ApJS 70, 865
- (33) Sebo K.M., Wood P.R., 1994, AJ, 108, 932
- (34) Struve O., 1931, ApJ 73, 94
- (35) Taylor B.J., 1986, ApJS 60, 577
- (36) Tucholke H.-J., de Boer K.S., Seitter W.C., 1996, A&AS 119, 91
- (37) Vallenari A., Bomans D.J., de Boer K.S., 1993, A&A 268, 137
- (38) Van Bever J., Vanbeveren D., 1997, A&A 322, 116
- (39) Vogt S.S, Penrod G.D., 1983, ApJ 275, 661
- (40) Walker A., 1996, private communication
- (41) Will J-M., Bomans D.J., de Boer K.S., 1995, A&A 295, 54
- (42) Zorec J., Briot D., 1991, A&A 245, 150
- (43) Zorec J., Briot D., 1997, A&A 318, 443