Studying the Evolution of Field Galaxies Using NICMOS/HST Parallel Imaging And Grism Data
Abstract
We present results from our analysis of F160W NICMOS Parallel images. These data cover 9 sq. arcminutes and reach 3 depths of H 24.3 25.5 in a diameter aperture with integration times of 2,000 to 13,000 seconds. We derive the first deep H band galaxy counts. The slope of the counts for H 20 is 0.31, consistent with various K-band measurements from the Keck telescopes. The measured number counts vs. magnitude relation is reasonably well fitted with no-evolution models with a low value. The half-light radii of the galaxies declines steeply with apparent magnitude and reaches the NIC3 resoltion limit at H23.5. Deep ground-based VRI imaging of one NICMOS field has revealed an extremely red galaxy with RH 6 and H of 18.8. Our analyses of the grism data show that we can reach 3 flux limits of of to ergs/sec/cm2 for integration times of 2,000 to 21,000 seconds. We have detected a total of 33 emission line galaxies. The comoving number density is . The detected emission lines are probably Hα 6563Å. Thus, the derived star formation rates, without extinction correction, are per year for galaxies at redshifts between 0.7 and 1.9.
keywords:
Near Infrared, Cosmology, Galaxy Evolution1 Introduction
The NICMOS parallel observations, taken in parallel with one of the other science instruments on HST, has provided us for the first time a wealth of data at near infrared wavelengths with HST resolution. Small background at wavelengths of 0.8 and 1.6 and HST high angular resolution make NICMOS a very efficient instrument in studying the faint galaxy population at high redshifts.
The NICMOS parallel imaging and grism observations were both made with Camera 3 with a field of view 52 52′′. The imaging data were taken with broad band filters F110W and F160W at 1.1 (J band) and 1.6 (H band). The grism data has a spectral resolution of 200 per pixel and covers wavelength regions from 0.8 to 1.2 (G096) and 1.1 to 1.9 (G141). Currently, for high galactic fields (l 20 degrees), the NIC3 parallel imaging data cover an area of 167 sq. arcminutes and the grism data 65 sq. arcminutes. The final expected total areal coverage is close to 200 sq. arcminutes for the imaging data and 100 sq. arcminutes for the grism data.
Despite the less than optimal focus, we achieve depths that are very close to the normal NIC3 performance. With exposure times of 2,000 to 13,000 seconds we reach 3 of in an aperture of 0.6′′ diameter in the direct imaging data. The measured FWHM for stellar objects is 0.23′′ in the imaging data. The grism data reaches 3 flux limits of 1 to 2 ergs/sec /cm2 for integration times of 2,000 to 21,000 seconds.
2 Deep H-band Galaxy Counts and Half-light Radii
The first result from these deep images is the number magnitude relation (Yan et al. 1998). The deviations in faint galaxy number counts from the no-evolutionary predictions mostly reflect the dynamical and luminosity evolution, although number counts also probe the geometry of the Universe. The relative importance of the two primary forms of evolution, density and luminosity evolution, can only be properly assessed with spectroscopic redshifts. The near-IR pass-bands, however, are better suited than visible colors to purely photometric surveys as they are less sensitive to star formation and extinction. The weak dependence of the K-correction on Hubble type and its slow change with redshift further enhance the value of observing at wavelengths beyond m.
2.1 Observations and Data Reduction
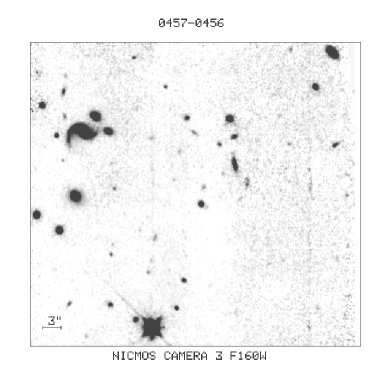
We have completed analyses of a small set of H band images, which covers 9 sq. arcminutes at high galactic latitutes ( 25 degrees). Our data reduction approach relies heavily on McLeod’s NICREDv1.5 package (McLeod 1998). We made observed sky+dark frames fro each read in the multiaccum sequence by computing the median of all of the independent fields. These median sky+dark images were subtracted from each read and each pixel was then corrected for nonlinearities and cosmic ray events. The individual linearized and cleaned images were then corrected for the flat field response, block replicated to a 2x2 finer scale, shifted by integer () pixel shifts and combined with a final 3 cosmic ray rejection applied. The deepest of our NIC3 parallel images reaches a 1 surface brightness limit of 26 H magnitude per square arcsecond. The 3 point-source detection limits for our fields range from H of 24.3 to 25.5 in a diameter aperture. The 50% completeness limits are H of 23.5 to 24.5. More detailed information can be found in Yan et al. 1998. Figure 1 shows an image with a typical integration time from the parallel program. It has 4500 seconds and reaches a 1 surface brightness limit of 25.7 magnitude/sq. arcsec in H band. The deepest field to date, shown in Yan et al. 1998, has an additonal 0.5 magnitudes of depth.
2.2 Galaxy Photometry and Incompleteness Modeling
We performed the object detection and photometry using SExtractor version 1.2b10b (Bertin & Arnouts 1996). We used isophotal magnitudes to define total magnitudes for galaxies with isophotal diameters . For faint galaxies with isophotal diameters , we use their aperture magnitudes. These two magnitudes are both corrected to a 2 diameter aperture to get the total magnitudes. The aperture corrections are obtained from an average of 1530 galaxies in the corresponding magnitude range.
The raw counts have been corrected for false detections and incompleteness. We selected several well detected galaxies from an image, dimmed them by various factors, and added these images into the original image at random locations. We then apply the same detection and photometry algorithms as in the original analyses. Detailed information can be found in Yan et al. (1998). We adopted a 50% completeness as the cutoff and the simulations show that this corresponds to depths of H 23.8 to 24.8 for our chosen fields. As described in Yan et al. (1998), the false detection rate is of order 5%.
2.3 Results and Discussion
In Figure 2, we plot our raw and corrected counts with the open circles and solid dots (Yan et al. 1998). We have converted K band magnitudes to the NICMOS F160W magnitude using the models from Gardner (1998). The open diamond and triangle represent the K band galaxy counts by Bershady et al. (1998) and Djorgovski et al. 1995 respectively. The solid and dashed lines correspond to the no-evolution models by Gronwall & Koo (1995) with of 0.5 and 0.05. This figure shows that our number counts are consistent with what measured in the deep K-band images from the Keck telescope. Our data cover 9 sq. arcminutes, whereas the two Keck K band surveys only imaged roughly 11.5 sq. arcminutes.
Yan-figure2.eps4.5truecm0.03030-120-50
The slope of our counts is 0.31 0.02 for for 20H24.5. We find no significant change in the slope for H . At an H magnitude of 24.5, the galaxy number-magnitude relation does not strongly departure from no-evolution models, in contrast to what we see in the optical bands. The integrated number of galaxies H, including the incompleteness corrections, is per sq. degree, or 2 galaxies over the entire sky. This is about 3 times larger than the total implied from integration of the local luminosity function (Lin et al. 1996) to 0.01L∗ over an all-sky co-moving volume for (, ) cosmological model. If the bulk of the galaxies that we detect at H are faint dwarf galaxies with luminosity much less than at low redshifts instead of galaxies at , the counts slope of implies a H band luminosity function .
Yan-figure3.eps5truecm0.04030-150-55
We charcterize the size of the detected objects in terms of their half-light radii. Figure 3 plots the derived half-light radii versus H magnitude for all detected galaxies. The solid symbols are the median sizes in bins of 0.5 or 1 magnitude. The dotted line corresponds to a uniform surface brightness of 22 mag/arcsec2. The star symbols represent the measurements from a globular cluster field. At H of 23.5 we reach the HST resolution limit. For H 22, fainter galaxies have smaller apparent sizes.
3 Galaxy Colors and Extremely Red Objects
Figure 4 is JH vs. H diagram. The open circles are the data measured from the NIC3 images; the solid line indicates the color-magnitude track for no-evolution elliptical galaxies; the dashed line is for star forming galaxies with a flat spectral energy distribution (SED). The solid dots are the median colors. In this plot , the object indicated by an arrow has a VH 6, with V 25, R 24.8, I 23.2, F110W(J) 20.5 and F160W(H) 18.8. In the H-band image, this object is well resolved and appears fairly regular. Its morphology is well fitted by a law profile of an elliptical galaxy. This is in contrast to the distorted morphology reported for another ERO by Graham & Dey (1996).
Yan-figure4.eps5truecm0.04030-150-57
Although several groups have discovered a number of EROs with RK 6 (McCarthy, Persson & West 1992; Hu & Ridgeway 1994), the statistics of EROs is still very poor and the nature of these objects remains unclear. These objects could be old ellipticals formed in the monolithic collapse at high redshifts (Hu & Ridgway 1994); they could also be dust shrouded star forming galaxies (Graham & Dey 1996; Cimatti et al. 1998). Combining ground-based optical photometry with NICMOS parallel observations, our survey will search for EROs over a large area of sky ( 200 sq. arcminutes.) with an unprecedented depth.
4 Preliminary Results from Grism Data
Currently there are 65 sq. arcminutes of high galactic latitute fields which have grism observations covering = . We have reduced all of the data and the detailed analyses are under way. The grism data reaches 3 flux limits of to ergs/sec/cm2 for integration times of 2,000 to 21,000 seconds. We have detected a total of 33 emission line galaxies with line fluxes of ergs/s/cm2 to ergs/s/cm2. These detected lines are likely Hα 6563Å, which put these emission line galaxies in the redshift range between 0.7 and 1.9. The derived Hα luminosity ranges from ergs/s. The implied star formation rates, without extinction correction, are per year with the median of 24. Figure 5 shows the spectrum in both 2D and 1D form for a typical emission line galaxy. This galaxy has H magnitude of 20.5.
Yan-figure6.eps5truecm0.07070-220-80
Acknowledgements.
We thank the NICMOS team at the Space Telescope Institute, and acknowledge useful discussions with B. McLeod, I. Smail, J. Gardner, H. Teplitz, R. Thompson, M. Rieke and David Hogg. This research is supported by grants from Space Telescope Science Institute, AR-07972.01-96A, GO-7499.01-96A and PO423101.References
- [1] ershady, M., Koo, D.C. & Lowenthal, J. 1998, ApJ, in press
- [2] ertin, E. & Arnouts, S. 1996, A&AS, 117, 393
- [3] imatti, A., Andreani, P., Rottgering, H. & Tilanus, R. 1998, Nature, 392, 895
- [4] jorgovski, S. et al. 1995, ApJ, 438, L13
- [5] ardner, J.P. 1998, PASP, 110, 291
- [6] raham, J.R. & Dey, A. 1996, ApJ, 471, 720
- [7] ronwall, C. & Koo, D.C. 1995, ApJ, 440, L1
- [8] u, E. & Ridgway, S.E. 1994, AJ, 107, 1303
- [9] in, H., et al. 1996, ApJ, 464, 60
- [10] cCarthy, P.J., Persson, S.E. & West, S. 1992, ApJ, 386, 52
- [11] cLeod, B. 1997, Proceedings of the 1997 HST Calibration Workshop, 281
- [12] an, L. McCarthy, P.J., Storrie-Lombardi, L.J. & Weymann, R.J. 1998, ApJ, 503, L19