Correlation Between Gas and Dust in Molecular Clouds: L977
Abstract
We report observations of the (1–0) C18O molecular emission line toward the L977 molecular cloud. To study the correlation between C18O emission and dust extinction we constructed a Gaussian smoothed map of the infrared extinction measured by Alves et al. (1998) at the same angular resolution (50′′) as our molecular–line observations. This enabled a direct comparison of C18O integrated intensities and column densities with dust extinction over a relatively large range of cloud depth (2 AV 30 mag) at 240 positions inside L977. We find a good linear correlation between these two column density tracers for cloud depths corresponding to AV 10 magnitudes. For cloud depths above this threshold there is a notable break in the linear correlation. Although either optically thick C18O emission or extremely low ( 5 K) excitation temperatures at high extinctions could produce this departure from linearity, CO depletion in the denser, coldest regions of L977 may be the most likely cause of the break in the observed correlation. We directly derive the C18O abundance in this cloud over a broad range of cloud depths and find it to be virtually the same as that derived for IC 5146 from the data of Lada et al. (1994).
In regions of very high extinction (A 10 mag), such as dense cores, our results suggest that C18O would be a very poor tracer of mass. Consequently, using C18O as a column density tracer in molecular clouds can lead to a 10 to 30% underestimation of overall cloud mass.
We estimate the minimum total column density required to shield C18O from the interstellar radiation field to be 1.6 0.5 magnitudes of visual extinction.
keywords:
ISM: abundances — dust, extinction — ISM: structure — ISM: individual (L977, L981) — ISM: molecules — Molecular Clouds: structure1 Introduction
Molecular clouds are the coolest (T 10 K) objects in the known Universe. They contain about half of the mass of the Interstellar Medium (ISM) and hence an important fraction of the mass of the Galaxy. Yet, the most important characteristic of molecular clouds is that they are the sites of all galactic star formation. To understand how stars are formed one needs to understand how molecular clouds evolve. A prerequisite to this understanding is the detailed knowledge of the physical and chemical structure of molecular clouds.
About 99% of the mass of a molecular cloud is composed of hydrogen and helium making such clouds virtually inaccessible to direct observation. For this reason, the traditional method used to derive the basic physical properties of these objects (e.g., sizes, masses, temperatures) is the spectroscopic observation of rare but detectable trace molecules (CO, CS, NH3) which are several orders of magnitude ( 4–9) less abundant than the primary mass component, molecular hydrogen (H2). However, the interpretation of such molecular–line observations is not always straightforward. Several poorly constrained effects (e.g., deviations from local thermodynamic equilibrium, opacity variations, chemical evolution, small scale cloud structure, depletion) compromise the derivation of such important properties such as the distribution of mass and structure of a molecular cloud. A better quantitative understanding of the relationship of these tracers to H2 is necessary not only for the derivation of reliable masses but also for knowledge of the chemical structure of molecular clouds.
Because of the apparent constancy of the gas–to–dust ratio in interstellar clouds (e.g., Lilley 1955; Jenkins & Savage 1974; Bohlin et al. 1978) the most reliable way to trace the total gas content of a molecular cloud may be to measure the distribution of dust through it. The recent development of sensitive near-infrared array cameras has enabled measurements of the dust distribution in certain molecular clouds over an unprecedented range of depth and angular scale (Lada et al. 1994; Alves et al. 1998). With current detectors and small telescopes (1–2m) we can readily detect reddened field stars behind a molecular cloud with as much as 25–30 magnitudes of visual extinction, approximately an order of magnitude improvement over previous measurements. This allows the mapping of the distribution of dust at an angular resolution and optical depth that are suitable to probe directly the inner, denser regions of a molecular cloud where star formation takes place. Combined with molecular spectroscopy, such observations open a new window on molecular cloud research enabling direct measurements of molecular abundances to cloud depths not previously accessible. Such observations will have important consequences for understanding molecular cloud chemistry. For example, Lada et al. (1994) in their study of the IC 5146 molecular cloud found that the ratio 13CO/C18O appears to be a strong function of extinction — suggesting that one or both CO species are unstable in the outer regions (AV 10 mag) of the cloud — probably due to active chemical processing by UV radiation. Their results also suggested the presence of C18O depletion in the densest regions of the IC 5146 cloud which was recently confirmed by higher resolution C18O and C17O observations by Kramer et al. (1998) obtained with the IRAM 30m telescope.
Recently, Alves et al. (1998) used measurements of near-infrared color excess of 2000 stars to directly measure and map dust extinction through the L977 molecular cloud. L977 is a well defined dark cloud lying against a rich background of field stars towards the warped plane of the Galaxy (∘, ∘). It was mapped in 13CO, with 2′.7 resolution, as part of a large scale survey of the region (Dobashi et al. 1994). The 13CO survey showed that L977 is a relatively isolated molecular cloud, free from confusion with other clouds along the line–of–sight. Alves et al. (1998) were also able to derive a distance, , of 500 pc towards L977 and a mass of M⊙.
The main goal of this article is to study the variation of C18O molecular abundance with dust extinction (e.g., AV) over a large range of cloud depth (2 AV 30 mag). C18O is often optically thin in molecular clouds and widely used as a tracer of molecular hydrogen, H2. We perform a direct comparison of C18O integrated intensity and column density with measurements of dust extinction with the same angular resolution (50′′), for 240 positions in molecular cloud L977.
We describe the acquisition and reduction of the observations in Section 2 of the paper. In Sec. 3 we present the results of the observations and in Sec. 4 we present the analysis and discussion. In Sec. 5 we summarize our conclusions.
2 Observations and Data Reduction
We employed the 14m Five College Radio Astronomy Observatory (FCRAO) telescope in New Salem, MA, to obtain observations of the 109 GHz 1–0 C18O molecular emission line toward L977. Observations at FCRAO 111The Five College Radio Astronomy Observatory is operated with the support of the National Science Foundation, under grant AST 94-20159 and with permission of the Metropolitan District Commission of Massachusetts. were made in November 1995 and February 1996 utilizing the QUARRY 15 element focal plane array (Erickson et al. 1992) and the FAAS autocorrelator to generate a single beam-sampled map ( 50′′ resolution) covering an area on the sky of 1015 arcmin centered on the L977 molecular cloud. We used the 40 MHz bandwidth that yielded a channel spacing of 78 kHz and a velocity resolution of 0.215 kms-1 at 109 GHz. The observations were frequency switched, with the reference frequency displaced from the signal frequency by 4 MHz. System temperatures during observations ranged from 480 to 620 K. Integration times were adjusted so that the rms noise temperatures in the 78 kHz channels was 0.13 K for the C18O observations. The half-power beam width ((109 GHz) 46.1′′) and beam efficiency ( 45%) were taken from Ladd & Heyer 1996. All observations were calibrated by a chopper wheel which allowed switching between the sky and an ambient temperature load. All data were reduced using the SPA and CLASS spectral line reduction packages. The spectra were folded and linear baselines were removed from the spectra. An rms pointing uncertainty of less than 5′′ was determined from repeated observations of SiO maser sources U Her and T Cep.
3 Results
3.1 Molecular-Line Observations
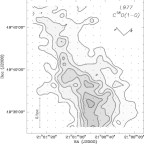
The area surveyed for (1–0) C18O molecular–line emission is represented in Figure 1 as the central rectangle overlaid on the Digitized Sky Survey red POSS plate 222Based on photographic data of the National Geographic Society – Palomar Geographic Society to the California Institute of Technology. The plates were processed into the present compressed digital form with their permission. The Digitized Sky Survey was produced at the Space Telescope Science Institute under US Government grant NAG W-2166.. The L977 molecular cloud is readily seen as the zone of obscuration against the rich star field that characterizes this region of the galaxy. The map of the integrated C18O (1–0) emission observed towards L977 is given in Figure 2. The intervals of integration ( vLSR 0.0 kms-1) were chosen from analysis of the average of all 240 observed positions to include the region in the spectra where most of the signal is detected. The contours start at 20% (4 ) and go up to 95% in steps of 15% (3 ) of the peak integrated intensity (2.0 K kms-1). The (0,0) point in this map corresponds to []. The straight line at the lower left corner of the map represents 0.5 pc at an assumed distance to L977 of 500 pc. The galactic coordinates reference frame is shown at the upper left corner. Comparison to the Palomar red plate (Figure 1) reveals a good correlation between C18O emission and the shape of the more opaque regions in L977. The emission follows closely the NE—SW elongated dark lane that characterizes this molecular cloud at optical wavelengths.
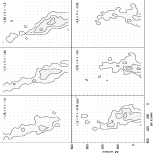
The C18O (1–0) kinematics are presented in Figure 3. Each of the six maps were integrated over 0.25 kms-1 intervals from 1.75 to 0.25 kms-1 respectively. Contours start at 4 (0.13 K kms-1) and increase in steps of 4 . Most of the emission is found in the narrow range 2 to 0 kms-1 with an average systemic velocity of 1.0 kms-1. Although we are looking near a complicated region of the galaxy there appears to be no confusion with foreground/background molecular clouds. L977 C18O emission appears narrowly confined in both space and velocity. These results are consistent with the Dobashi et al. (1994) 13CO survey of the same region.
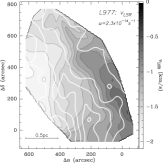
Figure 4 shows in grayscale the variation of the LSR velocity across the surveyed area. The solid white contours represent the C18O integrated intensity (smoothed to a 100′′ resolution for the sake of the clarity of the Figure. See below for more discussion on the smoothing procedure). It is clear from Figure 4 that the line velocities show a systematic spatial pattern with a well defined linear gradient ( kms-1 pc-1 for an assumed distance to the cloud of 500pc) along the East–West direction, essentially orthogonal to the dark filament. This systematic motion could be either the result of rotation or shear. If we assume the filament to be in solid–body rotation (uniform angular velocity about the axis of symmetry of the filament) we can derive an angular velocity for this cloud of s-1.
3.2 A Gaussian Convolved Map of Dust Extinction
The near–infrared data used in this paper is taken from Alves et al. (1998). A detailed description of the near–infrared data acquisition and data reduction can be found in the latter paper. The area surveyed in the 3 near–infrared bands ( (1.25 m), (1.65 m), and (2.20 m)) towards L977 is presented in Figure 1 of Alves et al. (1998) and is similar to the molecular–line survey presented in this paper (Figure 1).
The main goal of this paper is to study the variation of molecular abundance of C18O with dust extinction for the L977 molecular cloud. While the CO observations are obtained with a radio–telescope with a diffraction limited Gaussian beam ( FWHM) the infrared observations are obtained with an imaging camera and colors and extinctions are measured along individual, very high resolution 333The expected angular size of a stellar disk of a field star behind the cloud is arcsec., pencil–beams towards individual background stars. In order to enable a direct comparison between these two observables we constructed a new extinction map by spatially convolving the near–infrared measurements with a 2D Gaussian filter with a FWHM of 50′′ — similar to the beam–size of the FCRAO radio-telescope — and centered on the positions of the molecular–line data. The Gaussian filter was truncated at , where is the distance from the pixel center (the peak of the 2D Gaussian) and is its standard deviation. To improve the signal to noise ratio we constructed a second set of maps by smoothing both the dust extinction and the C18O measurements to an angular resolution of 100′′. The smoothing was done in the following manner: for molecular–line data, every contiguous 22 set of spectra were averaged into one spectrum that was taken to be at the central position of the set, equally distant from the original positions of the four spectra (the outcome of this procedure is a new, Nyquist sampled, map of the molecular–line data with an effective resolution of 100′′); for the extinction data, an extinction map with a FWHM resolution of 100′′ was then constructed to match the re-gridded molecular–line data.
In Figure 5 a) we present a Gaussian convolved map of the dust extinction towards the L977 molecular cloud. Contours start at 5 magnitudes of visual extinction and increase in steps of 2.5 magnitudes. In Figure 5 b) we present the integrated C18O molecular–line emission map as derived from the observations presented in this paper. Contours start at 0.5 K kms-1 and increase in steps of 0.25 K kms-1. Both maps are presented at a 100′′ resolution. A visual comparison between between these two column density tracers reveals a notably good correlation. Also, both maps correlate well with the visual opaque regions of the L977 cloud as seen in Figure 1.
4 Analysis and Discussion
4.1 Comparison Between Gas and Dust in L977
The correlation between visual extinction and C18O integrated intensity is displayed in Figure 6 a). It compares 240 positions where common data were obtained at an angular resolution of 50′′. The errors in the extinction measurements were estimated from the Gaussian weighted rms dispersion of dust column density measurements falling inside each “beam” while the errors in the integrated intensities were directly derived from the noise in molecular–line spectra. In Figure 6 b) we present the same data as in Figure 6 a) but smoothed to a 100′′ resolution. The observed smaller maximum in the extinction measurements is a consequence of the smoothing.
At first approximation there is a clear correlation between these two column density tracers. A bivariate linear least–squares fit over the entire data set, represented on Figure 6 by the solid straight line, gives for the two resolutions:
| (1) |
| (2) |
which within the uncertainties of the fit, are the same. We note that the derived slopes for both correlations are affected by the deviant points and they become somewhat steeper ( 10%) if data above A mag are excluded from the bivariate fit.
However, there is also a notable deviation from this linear correlation for AV 10 magnitudes. There are three effects that could account for this deviation: either 1) C18O becomes optically thick at cloud depths AV 10 magnitudes, 2) there is a systematic decrease of the excitation temperature down to extremely low values ( K at AV 10 mag), or 3) CO depletion onto dust is occurring in the high extinction regions of this cloud. The present study cannot discriminate between these three possible different explanations. Still, simple considerations can be used for a preliminary evaluation of these alternatives:
-
1.
Line saturation: Observations of CO isotopomers optically thinner than C18O (e.g., C17O, 13C18O) are required to test whether the C18O lines are beginning to saturate for AV 10 magnitudes. Unfortunately such observations are not yet available and we cannot rule out this possibility.
-
2.
Extremely low temperature: If the C18O emission were optically thin, then a possible alternative explanation for the relative decrease in line intensity at high AV could be that the C18O excitation temperature at high extinction is so low ( h/k 5 K) that the gas is too cold to emit significantly above the 3 K background. We cannot easily rule out this alternative as a viable explanation for the observed deviation from the linear correlation. However this would likely require a significant drop in the gas heating rate at high extinction. Cosmic rays are believed to be the dominant heating mechanism of molecular clouds for A magnitudes. In order for the gas to cool below 5 K, cosmic rays would have to be very effectively shielded from the cloud’s interior. For example, we can estimate the cosmic ray ionization rate () required to maintain the gas at 5 K, by balancing the heating and cooling rates in the cloud. The cosmic ray heating is given by:
(3) where is the cosmic ray ionization rate of H2, is the energy deposited as heat as a result of this ionization, and is the molecular hydrogen density. The cooling rate for cm-3 can be expressed as (Goldsmith & Langer 1978):
(4) Balancing the two rates, , we derive the cosmic ray ionization rate necessary to keep the cloud temperature at T 5 K to be s-1.
Theoretical calculations show that cosmic rays are not easily shielded. They can easily penetrate substantial amounts of molecular cloud material (A magnitudes) and maintain ionization rates of s-1 through out a cloud (Cesarsky & Völk 1978; Léger, Jura, & Omont 1985) sufficient to maintain cloud temperatures at 10 K (Williams et al. 1998). Moreover, if the cosmic ray flux were to be strongly attenuated in cloud regions of high column density, the electron density (ne) would decrease and ambipolar diffusion would be expected to take place providing an important additional source of heating from the friction between ions and neutrals as the magnetic lines diffuse out of these dense regions (Mouschovias 1978; Lizano & Shu 1987). Finally, in the case of higher densities (n 108 cm-3) where cosmic ray heating might have a reduced role it is believed that natural radioactivity will become an important heating mechanism (Nakano & Tademaru 1972). These considerations suggest that cloud core temperatures below 5 K are unlikely.
-
3.
CO depletion: Solid–state CO absorption features have been observed in the infrared spectra of stars background to dense molecular clouds suggesting that an appreciable fraction (%) of the total CO abundance may be depleted onto grains inside the cold, high extinction regions of these clouds (e.g., Whittet & Duley 1991). Also, chemical models of the interaction between gas phase molecules and grain surfaces inside molecular clouds show that significant depletion of molecules should occur for T 20 K (Bergin, Langer, & Goldsmith 1995). The observed break in the C18O versus AV relation for L977 could be then the result of depletion at high extinctions. For example, comparison of C18O observations with extinction measurements of the IC5146 molecular cloud (Lada et al. 1994) shows a similar departure from a linear relation at AV 10 magnitudes. Recently, Kramer et al. (1998) measured both C18O and C17O lines in the high extinction regions of IC5146 molecular cloud and found the C18O emission to be optically thin, thus suggesting that the C18O abundance is depleted by factors of 3 to 4 in the high extinction portions of that cloud. The similarity between our results and those of IC5146 may indicate that appreciable depletion is also occurring in L977. Presently, we favor the CO depletion alternative as the most likely cause of the break in the observed correlation. However, a determination of the opacity of the C18O emission would be required to conclusively test this suggestion.
The derived slope in the C18O versus AV relation for L977 (0.190.01) is nearly twice as steep as the one derived for the IC5146 molecular cloud (0.100.01) from a similar set of observations. However, we do not believe that this difference is real. Two different aspects of our analysis procedure can explain the observed differences in slope between these two clouds: 1) we performed a bivariate least–squares fit (hence we are not as sensitive to the less accurate, most deviant, measurements at high extinction), and 2) we used a Gaussian beam to smooth the extinction measurements which allows a better comparison with the radio observations than the square spatial filter used by Lada et al. (1994). When the IC5146 data is analyzed in the same manner as the L977 data (the effective resolution of the Lada et al. (1994) molecular–line data is 102′′), the correlation between dust extinction and C18O integrated intensity is found to be:
| (5) |
which within the uncertainties is indistinguishable from the one derived for L977 cloud. The difference between the earlier Lada et al. fit and that presented here is almost entirely a result of the use of a Gaussian spatial filter which was well matched to the radio beam. Moreover, the improved fit is in better agreement with the higher resolution C18O observations of Kramer et al. (1998) obtained with the IRAM 30m telescope.
In the present study, we derive a negative intercept in the relations for both clouds which implies that the survival of the C18O molecule in the ISM requires a shielding from the interstellar radiation field (ISRF) equal to a dust column density equivalent of 1.60.5 magnitudes of visual extinction.
4.2 Molecular Abundance of C18O
Our extinction measurements toward the L977 molecular cloud allow us to directly determine the abundance of C18O over a broad range of cloud depths. To do this we need to convert the C18O integrated intensities to column densities at each position in the map and compare the derived column densities with the extinction measurements derived from the near–infrared data. Because we have single–transition molecular–line data (C18O (1–0)) we can only derive LTE column densities for this molecule. This is an approximation and we expect non–LTE effects to be operating in this cloud which in turn will cause our derived column densities to be somewhat inaccurate. Still, column densities determined in this way can be compared to similar existing studies and even to future studies that make use of this standard approximation.
LTE column densities were derived for each point of the molecular–line grid assuming a C18O excitation temperature of 10 K (Dobashi et al. 1994). In Figure 7 we plot the derived abundances as function of cloud depth for our 100′′ resolution data. The errors in N(C18O)LTE are smaller than the size of the symbols. In order to quantify the observed correlation we performed a least–squares fit with errors on both coordinates. The derived fit, shown as a straight line in Figure 7, is:
| (6) |
The same fit performed on the re–analyzed IC5146 data returns:
| (7) |
which once again is indistinguishable from the fit done to the L977 data. These results are also compatible with the range of values derived for comparable optical depths by Frerking et al. (1982). These authors performed pointed radio observations toward known reddened single background stars in Taurus and Oph molecular cloud complexes and found the slope of the N(C18O) vs. AV relation to be 2.4 for Taurus and 1.7 for Oph (uncertainties not quoted).
4.3 How Much Mass is C18O Missing?
In section 4.1 of this paper we concluded that there is a break in the correlation between dust extinction and the C18O integrated intensity at large cloud depths. This could be due to C18O opacity effects, extremely low ( 5 K) excitation temperatures, or, more likely (see Section 4.1), to the depletion of this molecule onto the dust grains in the denser regions of L977. In any event, the observed break implies that above a certain threshold of cloud depth C18O cannot be taken as a reliable tracer of molecular cloud mass. Since C18O emission is widely used as good tracer of column density in molecular clouds it is important to account for this limitation and to make an estimation of its magnitude.
Figure 8 shows the distribution of cloud mass derived from the near–infrared extinction measurements as a function of cloud depth for both L977 and IC5146 molecular clouds. The data points are the cumulative binning, in intervals of 2 magnitudes of visual extinction, of the normalized cloud masses contained in the extinction map pixels with average extinctions above 2.5 magnitudes. There is a remarkable similarity between the two molecular clouds (Alves et al. 1998). Note that the results in Figure 8 are independent of distance. Since in the most dense regions of both clouds we cannot measure extinction — our observations are not sensitive enough to detect heavily reddened (A 30 mag) stars — this plot is not complete at the high extinction end. Nevertheless, the solid angles occupied by these regions are very small when compared to the total solid angle of the cloud. So, although we are missing the densest regions in each cloud their contribution to the overall distribution of mass is negligible.
From Figure 6 we concluded that a break in the correlation between dust and C18O integrated intensity occurs as early as cloud depths of about 10 magnitudes of visual extinction and that this same correlation appears to flatten out for cloud depths 20 magnitudes. According to the distribution of molecular cloud masses displayed in Figure 8 for clouds L977 and IC5146 this fact implies that when using C18O integrated intensity as a column density tracer we may be missing between 10 to 30% of a cloud’s mass. In the case of L977 and for A 2.5 mag, the mass as traced by C18O is 15% smaller than that traced by dust. Nevertheless, this systematic error in the determination of L977 mass or other molecular clouds masses is still small when compared to the systematic uncertainty introduced in the same determination by the poorly known distances to these objects (typically a factor of 2). However, the systematic error introduced by using C18O emission to trace mass is a function of cloud depth. For example, C18O would be a very poor mass tracer of dense (A) cores inside a molecular cloud.
5 Summary
We studied the correlation between (1–0) C18O emission and dust extinction for the L977 molecular cloud over a large range of cloud depth (2 AV 30 mag). Our main findings are as follow:
-
•
There is a good linear correlation between these two column density tracers for cloud depths AV 10 magnitudes; for cloud depths above this threshold there is a notable break in the correlation of the two mass tracers.
-
•
Although either optically thick C18O emission or extremely low ( 5 K) excitation temperatures could produce this break, CO depletion in the denser, coldest regions of L977 may be the most likely cause of the departure from linearity at high extinctions in the observed correlation. Observations of rarer CO isotopomers are needed to distinguish between these alternatives.
-
•
Both the C18O abundance and its variation over a broad range of cloud depths (AV 10 magnitudes) is directly derived and found to be virtually the same as that derived for the IC 5146 molecular cloud in a similar study by Lada et al (1994). It is also in agreement with previous determinations in other clouds.
-
•
In regions of very high extinction (A 10 mag), such as dense molecular cores, our results suggest that C18O would be a very poor tracer of mass. Consequently, using C18O as a column density tracer in molecular clouds can lead to a 10 to 30% underestimation of overall cloud mass.
-
•
We estimate the minimum shielding required for the survival of the C18O from the interstellar radiation field to be 1.6 0.5 magnitudes of visual extinction.
Acknowledgements.
It is a pleasure to acknowledge Mario Tafalla for discussions and for assistance on the reduction of the molecular–line data. We acknowledge Ted Bergin and Jonathan Williams for fruitful discussions. We also acknowledge an anonymous referee for pointing out extremely low temperature gas as a possible explanation to our results. This study was supported by the Smithsonian Institution Scholarly Studies Program SS218–3–95. J. Alves acknowledges support from the Fundação para a Ciência e Tecnologia (FCT) Programa Praxis XXI, graduate fellowship BD/3896/94, Portugal.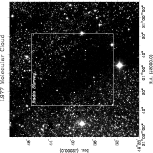


References
- (1) Alves, J., Lada, C.J, Lada, E.A, Kenyon, S., & Phelps, R. 1998, ApJ, 506, (10 October 1998)
- (2) Bergin, E.A., Langer, W.D., & Goldsmith, P.F. 1995, 441, 222
- (3) Blitz, L. 1991 in The Physics of Star Formation and Early Stellar Evolution, eds. C.J. Lada and N. Kylafis (Kluwer: Dordrecht), 3
- (4) Bohlin, R. C., Savage, B. D. and Drake, J. F. 1978, ApJ, 224, 132
- (5) Breger, M. 1968, AJ, 73, 84
- (6) Cesarsky, C.J., & Völk, H.J. 1978, A&A, 70, 367
- (7) Dobashi, K., Bernard, J., Yonekura, Y., Fukui, Y. 1994, ApJS, 95, 419
- (8) Erickson, N.R., Goldsmith, P.F., Novak, G., Grosslein, R.M., Viscuso, P.J., Erickson, R.B., & Predmore, C.R. 1992, IEEE Trans. Microwave Theory & Techniques, 40, 1
- (9) Frerking, M. A., Langer, W. D. and Wilson, R. W. 1982, ApJ 262, 590
- (10) Freudenreich, F., Berriman, G., Dwek, E., Hauser, M, Kelsall, T., Moseley, S., Silverberg, R., Sodroski, T., Toller, G., & Weiland, J. 1994, ApJL, 429, 69
- (11) Goldsmith, P.F., & Langer, W.D. 1978, ApJ, 222, 881
- (12) Kramer, C., Alves, J., Lada, C.J., Lada, E.A., Sievers, A., Ungerechts, H., Walmsley, M. 1998, A&A, submitted
- (13) Jenkins, E. B. & Savage, D. B. 1974, ApJ, 187, 243
- (14) Lada, C.J., Lada, E.A., Clemens, D.P., & Bally, J. 1994, ApJ, 429, 694
- (15) Ladd, E., & Heyer, M. 1996, in “Characterization of the FCRAO 14-m Telescope with QUARRY”, FCRAO Technical Memorandum, October 1996
- (16) Léger, A., Jura, M., & Omont, A. 1985, A&A, 144, 147
- (17) Lilley, A. E. 1955, ApJ, 121, 559
- (18) Lizano, S., & Shu, F.H. 1987, in NATO/ASI Physical Processes in Interstellar Clouds, ed. M. Sholer. Dordrecht: Reidel
- (19) Lynds, B. 1962, ApJS, 7, 1
- (20) Mouschovias, T.C. 1978, In Protostars and Planets, ed. T. Gehrels, p. 209. Tucson: Univ. Arizona Press
- (21) Nakano, T., Tademaru, E. 1972, ApJ, 173, 87
- (22) Neckel, H. 1974, A&AS, 18, 169
- (23) Padoan, P., Jones, B., & Nordlund, A. 1997, ApJ, 474, 730
- (24) Rohlfs, K., & Wilson, T. 1996, in “Tools of Radio Astronomy”, 2nd edition (Springer–Verlag), p. 334
- (25) Schneider, S., & Elmegreen, B.G. 1978, ApJS, 41, 87
- (26) Strassmeier, K.G., Handler, G., Paunzen, E., & Rauth M. 1994, A&A, 281, 855
- (27) Wainscoat, R.J., Cohen, M., Volk, K., Walker, H.J., Schwartz, D.E. 1992, ApJS, 83, 111
- (28) Williams, J.P., Bergin, E.A., Caselli, P., Myers, P.C., & Plume, R. 1998, ApJ, 503, 689
- (29) Whittet, D.C., & Duley, W.W. 1991, ARAA, 2, 167