AGES AND METALLICITIES OF YOUNG GLOBULAR CLUSTERS
IN THE MERGER REMNANT NGC 7252111
Based on observations made at the Cerro Tololo Inter-American
Observatory, National Optical Astronomical Observatories, operated by AURA,
Inc., under a cooperative agreement with the National Science Foundation.
Abstract
Ultraviolet-to-visual spectra of eight young star clusters in the merger remnant and protoelliptical galaxy NGC 7252, obtained with the Blanco 4-m telescope on Cerro Tololo, are presented. These clusters lie at projected distances of 3 – 15 kpc from the center and move with a velocity dispersion of km s-1 in the line of sight. Seven of the clusters show strong Balmer absorption lines in their spectra [EW(H) = 6 – 13 Å], while the eighth lies in a giant H 2 region and shows no detectable absorption features. Based on comparisons with model-cluster spectra computed by Bruzual & Charlot and Bressan, Chiosi, & Tantalo, six of the absorption-line clusters have ages in the narrow range of 400 – 600 Myr, indicating that they formed early on during the recent merger. These clusters, and probably also the 7th absorption-line cluster, are globular clusters as judged by their small effective radii and ages corresponding to 102 core crossing times. The one emission-line object is 10 Myr old and may be a nascent globular cluster or an OB association. The mean metallicities measured for three clusters are solar to within about 0.15 dex, suggesting that the merger of two likely Sc galaxies in NGC 7252 formed a globular-cluster system with a bimodal metallicity distribution. Since NGC 7252 itself shows the characteristics of a 0.5 – 1 Gyr old protoelliptical, its second-generation solar-metallicity globulars provide direct evidence that giant ellipticals with bimodal globular-cluster systems can form through major mergers of gas-rich disk galaxies. A puzzling property of the observed young globulars are their high masses of 1 – 35 ( Cen) implied by the luminosities and ages (for an assumed Salpeter IMF). A spectrum of a candidate superluminous globular cluster in the elliptical galaxy NGC 1700, obtained with the Hiltner telescope at MDM Observatory, shows this object to be a foreground star.
keywords:
galaxies: abundances — galaxies: formation — galaxies: individual (NGC 7252, NGC 1700) — galaxies: interactions — galaxies: star clusters1 INTRODUCTION
Our knowledge of the formation and evolution of globular-cluster systems is advancing rapidly at present. Observations with the Hubble Space Telescope (HST) have led to a slew of discoveries of young star clusters in merging and starburst galaxies. Many of these clusters appear to be globular in nature based on their compactness, high luminosities, and ages inferred from broad-band colors. Spectroscopic observations of select young clusters tend to confirm this view, but are still sparse. Even though in many starburst galaxies the mechanism triggering a burst remains unknown, the process of cluster formation is becoming clearer. It now appears that star clusters in general—and globular clusters specifically—may form preferentially in high-density regions of starbursts (e.g., Meurer et al. (1995)), likely from Giant Molecular Clouds squeezed by the surrounding hot gas (Jog & Solomon (1992); Elmegreen & Efremov (1997)).
Galactic mergers offer a special opportunity for learning more about the cluster-formation process. Not only do they appear to have been an integral part of hierarchical galaxy building in the past (e.g., Larson (1990)), but they also continue to the present date (see reviews by Kennicutt, Schweizer, & Barnes 1998), produce the most vehement known starbursts (Sanders & Mirabel (1996)) and can lead to the wholesale formation of new subsystems of globular clusters (Schweizer (1987); Ashman & Zepf (1992), 1998; Whitmore (1998)). Observations of the cluster systems in recent merger remnants such as NGC 1275 (Carlson et al. (1998)), NGC 3597 (Holtzman et al. (1996)), NGC 3921 (Schweizer et al. (1996)), and NGC 7252 (Miller et al. (1997)) are especially valuable because in such remnants the starbursts have largely subsided, dense gas and dust hindering optical observations have diminished, and most of the freshly minted clusters have evolved sufficiently to reveal their true nature. Over the several 10yr a galactic merger takes to complete, loose star clusters and associations tend to disperse, while gravitationally bound dense clusters (globular or open depending upon their richness) survive as a fossil record of the merger’s star-formation history. Hence, determining the ages and metallicities of these surviving clusters is an important step in trying to reconstruct that history.
The discovery of bimodal color and metallicity distributions in the globular-cluster systems of many giant ellipticals, predicted from merger models of E formation by Ashman & Zepf (1992), clearly signals the occurrence of a second event (e.g., Zepf & Ashman (1993); Whitmore et al. (1995); Geisler et al. (1996)). Opinions differ whether this second event was a major merger of two gas-rich galaxies or not (see detailed review by Ashman & Zepf (1998)), and any additional evidence for or against such a merger origin of cluster bimodality would be valuable. Since in elliptical galaxies with bimodal cluster-color distributions the red globulars typically have near-solar metallicities (Forbes, Brodie, & Grillmair 1997; Cohen, Blakeslee, & Ryzhov 1998; Kissler-Patig et al. 1998), a question of great interest is just how metal-rich the second-generation globular clusters formed during major disk–disk mergers are. Preliminary evidence that such clusters may have approximately solar metallicities stems from relatively strong metal features observed in the spectra of two young globulars in NGC 7252 (Schweizer & Seitzer (1993); Fritze–von Alvensleben & Burkert (1995)) and of one such cluster in NGC 1275 (Zepf et al. 1995b ; Brodie et al. (1998)). However, this evidence is not based on quantitative estimates, and the need for such estimates persists.
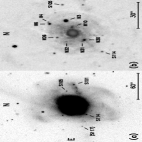
The present paper describes new spectroscopic observations aimed at deriving ages and metallicities for a small sample of candidate young globular clusters in NGC 7252. A prototypical remnant of two merged disk galaxies, NGC 7252 has been observed extensively (see review by Schweizer (1998)) and is the only remnant so far to have been modeled in detail via -body simulations (Hibbard & Mihos (1995)). Both the observations and the model strongly suggest that NGC 7252 is a 0.5 – 1 Gyr old protoelliptical. Although over the next 10 Gyr the galaxy will fade by about 1 – 1.6 mag from its present-day , it is likely to remain a luminous field elliptical. Young star clusters of exceptional luminosity were discovered in it first from the ground (Schweizer (1982); see also Fig. 1 here) and then in larger numbers with HST (Whitmore et al. 1993, hereafter W+ (93)). A recent HST study of NGC 7252 yields about 500 candidate clusters more luminous than (), which appear to belong to three populations: a prominent halo population of young blue globulars, a fainter halo population of old reddish globulars, and a central disk population of very young, but more diffuse clusters resembling OB associations (Miller et al. (1997)). Our spectroscopic observations are restricted to candidate clusters of the young halo population.
NGC 7252 is located at , (Miller et al. (1997)) and has a recession velocity relative to the Local Group of km s-1 (Schweizer (1982)), which places it at a distance of 64.4 Mpc (for km s-1 Mpc-1, adopted throughout the present paper). At that distance, the projected scale is pc. The corresponding true distance modulus is , and the apparent visual distance modulus is for a Milky Way foreground extinction of (de Vaucouleurs et al. (1991)).
In the following, Sec. 2 describes the cluster selection and Sec. 3 the observations and reductions. Section 4 presents results concerning the dynamics, ages, and metallicities of the observed young clusters, while Sec. 5 discusses various issues concerning the clusters’ age distribution, metallicity, physical nature, and origin. Finally, Sec. 6 summarizes the main conclusions.
2 CLUSTER SELECTION
The candidate clusters to be observed in NGC 7252 were selected from two object lists.
The first list is that of 37 “Outer Clusters” published by W+ (93). These candidate globular clusters lie at projected distances of from the center of NGC 7252 and were situated within the field of view of HST’s first-generation Planetary Camera as positioned by Whitmore et al.
The second list contains nine pointlike blue objects lying outside this field of view at projected distances of from the center. These blue objects were among 20 pointlike objects identified on a deep photographic image of NGC 7252 obtained with the Blanco 4-m telescope (see Fig. 1). The 20 objects were ranked according to their apparent color by visually intercomparing the deep image with a map of the color index produced by Hibbard et al. (1994, esp. their Fig. 5d) from CCD images. The nine bluest objects from this sample resemble in color the candidate young globular clusters identified by W+ (93) with HST and were, therefore, judged to be good candidate globulars themselves.
A final observing list was prepared by merging the two above object lists, ranking the objects by their estimated magnitudes, and selecting all objects (30) brighter than .
3 OBSERVATIONS AND REDUCTIONS
Candidate clusters from the above list were observed with the Ritchey-Chrétien spectrograph of the Blanco 4-m telescope on Cerro Tololo during 1994 September 29 – October 2. One and one-half nights were workable, during which 12 candidate clusters were observed. Figure 1 identifies these objects.
Of the 12 observed objects, nine yielded useful spectra. Table 1 lists these nine objects, of which eight indeed are star clusters in NGC 7252, while one is a background galaxy. Columns 1 and 2 give a running number and the adopted cluster ID, respectively, Cols. 3 – 6 coordinates relative to the nucleus of the galaxy, Col. 7 the half-light radius of each cluster, and Cols. 8 and 9 magnitudes and color indices measured with HST (Miller et al. (1997)).
For each observation, the slit of the spectrograph was put across at least two, and occasionally three, candidate clusters at a time. Suitable cluster pairs or triplets were selected according to the estimated magnitudes and relative position angle. This angle had to be close to the parallactic angle at the time of mid-exposure in order to minimize light losses on the jaws of the wide slit due to differential atmospheric refraction. The chosen position angles PAobs and exposure times are given in Cols. 10 and 11 of Table 1. To observe any given cluster pair or triplet, the spectrograph was first rotated to the required position angle, and the slit was centered on the galaxy nucleus. A guide star was then acquired, and the telescope was offset blindly by moving the guide-star probe by measured amounts in both coordinates. This procedure allows precision offsets to better than accuracy.
Following are brief remarks concerning three observed candidate clusters that failed to yield usable spectra. When laid across the two bright clusters W3 and W30, the spectrograph slit also crossed W10, a relatively bright candidate cluster at from the nucleus of NGC 7252. However, although this cluster was clearly detected on the two-dimensional spectral image, no useful one-dimensional spectrum could be extracted because of the bright, spatially variable galaxy background. Similarly, when crossing the clusters W6 and W26 the spectrograph slit also crossed candidate Cluster W4 lying west-northwest of W6. However, W4 is about 1.8 mag fainter than W6, and its spectrum could not be clearly disentangled from that of W6. Therefore, we discuss only the spectrum of W6, which may contain a small contribution (10%) of light from W4. Finally, when observing Cluster W31 we positioned the slit to also cross the much redder candidate cluster W32 ( according to Miller et al. (1997)). Due to increasing cirrus during the exposure, only the first subexposure of 3000 s yielded a well exposed spectral image, and on this image the spectrum of W32 was too faint in the blue to be of any use. The spectrum of W31, on the other hand, is usable though noisy and yielded a radial velocity.
During our observations, the RC spectrograph was equipped with the KPGL #1 grating and a Reticon 2 chip as a detector. The slit dimensions were . The recorded spectra cover the approximate wavelength range 3570–5570, which at the redshift of NGC 7252 corresponds to rest wavelengths of 3515–5480. The spectral resolution ranges from 3.6 Å to 5.1 Å depending on the wavelength and position along the slit, and the scale along the slit is per pixel.
The two-dimensional spectral images were processed with IRAF222 The Image Reduction and Analysis Facility (IRAF) is distributed by the National Optical Astronomy Observatories (NOAO), which are operated by the Association of Universities for Research in Astronomy (AURA), Inc., under a cooperative agreement with the National Science Foundation. through normal bias subtraction and flat-fielding. To extract a one-dimensional spectrum for each candidate cluster, the cluster continuum was traced on each two-dimensional image, and counts from pixels within 2.0 pixel from the trace center were coadded. The combined sky-plus-galaxy background was extracted from pixels 3 – 10 pixels on either side of the trace center via a parabolic fit, scaled, and subtracted from the cluster spectrum. Following this subtraction, each individual cluster spectrum was wavelength- and flux-calibrated. As a last step, individually calibrated cluster spectra from different images were summed into one final spectrum for each cluster.
Figure 2 displays the flux-calibrated sum spectra of the eight clusters in NGC 7252, plotted versus rest wavelength. (The ninth object listed in Table 1, S117, is a background emission-line galaxy, and its spectrum is not shown here.) Note the strong Balmer absorption lines in seven of the eight clusters, indicative of A-type main-sequence stars. The eighth cluster, S101, lies in a giant H 2 region of the “Western Loop” of NGC 7252 (Schweizer (1982)), and its spectrum is dominated by emission lines.
Figure 3 shows the spectrum of the most luminous cluster, W3, on an expanded wavelength scale and with the main absorption features labeled. Notice that the Balmer lines H – H14 are all visible in absorption and that the metal lines and features, including the Mg triplet centered at 5175, are relatively strong.
4 RESULTS
4.1 Dynamics
Table 2 gives the heliocentric radial velocities measured for eight clusters of NGC 7252. For the seven clusters with absorption-line spectra, these velocities were determined by cross-correlating the observed spectra with a high-signal-to-noise spectrum of the A-type star Kopff 27. For the emission-line cluster S101, the velocity was measured directly from the four emission lines H, H, and [O III]4959, 5007; there are no measurable absorption lines in its recorded spectrum. The cluster velocities listed in Col. 2 are mean values formed by averaging the velocities measured from each subexposure available for any given cluster. Column 3 gives the standard deviations of the means, and Col. 4 the number of subexposures averaged.
As a check, the new velocities for Clusters W3 and W30 can be compared with velocities measured earlier from spectra obtained with the Palomar 5-m telescope (Schweizer & Seitzer (1993)). For W3, the new km s-1 compares well with the previous km s-1. For W30, the new value of km s-1 compares with a previous km s-1. Thus, the radial velocities measured from the new CTIO absorption-line spectra agree with those measured from the Palomar spectra to well within the combined errors in both cases.
In a similar manner, the newly measured emission-line velocity of km s-1 for Cluster S101 compares well with that of km s-1 measured for the same H 2 region by Schweizer (1982).
To understand the kinematics of any cluster system, the velocities relative to the host galaxy are needed. Column 5 of Table 2 gives the line-of-sight (LOS) velocities of the clusters relative to the systemic velocity of NGC 7252, km s-1, itself measured from emission lines of the central ionized-gas disk (Schweizer (1982)). These relative LOS velocities were computed from
where the denominator is a relativistic correction. The mean relative LOS velocity of the eight clusters is km s-1, and the LOS velocity dispersion is km s-1. These two quantities have been computed via Pryor & Meylan’s (1993) maximum-likelihood estimator, and has been corrected for small-number bias in an approximate manner by applying a multiplicative factor of .
The mean LOS velocity of the clusters agrees to within with the systemic velocity of NGC 7252. Plots of the individual cluster velocities versus position show no systematic rotation pattern, whence the velocities must measure mostly random motions. The cluster velocity dispersion of km s-1 is slightly, but not significantly, smaller than the stellar central velocity dispersion of km s-1 measured from the calcium triplet at 8540 (Lake & Dressler (1986)). For comparison, note that the of the eight clusters is similar to that measured for over 80 globular clusters in NGC 5128 ( km s-1, Harris et al. (1988)).
The cluster positions and LOS velocities yield rough estimates of the mass of NGC 7252 within the distance to the outermost observed cluster. We use the projected mass estimator for a central point mass recommended by Bahcall & Tremaine (1981) in the absence of information about the cluster orbits,
where is the gravitational constant, the number of clusters (test particles), and the projected distance of the -th cluster from the center. With this estimator and the aperture photometry of Schweizer (1982), the mass is within kpc (projected distance of most distant cluster, S101), and the integrated mass-to-visual-light ratio is in solar units.
If instead of assuming a central point mass, we assumed an extended mass distribution similar to the number-density distribution of globular clusters, the estimates would double to and (Heisler, Tremaine, & Bahcall 1985). However, the latter estimates are only correct if the tracer population has been measured either completely or in a representative manner, which is clearly not the case for the present limited sample of eight globulars (for a detailed discussion of the uncertainties, see Haller & Melia 1996). From checks with subsets of globular clusters we conclude that the true values of 15 kpc) and are probably within a factor of two of the first quoted pair of numbers.
Note that the relatively low within kpc may reflect the post-starburst nature of NGC 7252’s spectrum. Based on two-burst models simulating the evolution of two merging Sc galaxies (Schweizer & Seitzer (1992)), NGC 7252 is predicted to fade by about 1 – 1.6 mag in over the next 10 Gyr. Thus, its should rise to a value of – 30 more normal for a giant elliptical galaxy (Kent (1990)).
4.2 Cluster Ages from Balmer and H + K Lines
In principle, the determination of ages and metallicities of single-burst populations from their spectra is straightforward. Comparisons between observed and model spectra, using age- and metallicity-sensitive spectral features, should yield the answers. However, there are significant differences between the model spectra from various groups (see, e.g., Charlot, Worthey, & Bressan 1996). In the present case, the determination of the ages and metallicities of NGC 7252 clusters is hampered mainly by the lack of model-cluster spectra of sufficient spectral resolution for metallicities other than solar. Whereas some of the solar-metallicity (hereafter ) models by Bruzual & Charlot (1996, hereafter BC96) have the necessary resolution (2 Å) to match the observations, those for non-solar metallicities do not (wavelength spacings of 10 Å and 20 Å in the UV–optical). Therefore, we adopt the following approach. In the present subsection, we assume that the clusters have roughly solar metallicity and determine their ages from the observed spectra via comparisons with the high-resolution model spectra for . In the next subsection (§4.3), we then estimate metallicities and ages for the best observed two clusters via traditional methods, finding that—indeed—the assumption of solar metallicity appears to be good to within a factor of better than two.
To determine cluster ages, we measured the equivalent widths of absorption
lines from the observed spectra and compared them with equivalent widths
measured in exactly the same manner from a set of model spectra.
Table 3 gives equivalent widths of the Balmer and Ca 2 H + K
lines measured from
the observed spectra. The adopted passbands were 62 Å wide for H,
55 Å for H, 52 Å for H, 48 Å for H + H,
17 Å for K, and 40 Å for H8. Continuum passbands were chosen on either
side of the line features, and the measurements were carried out with the
task spindex of the image-processing software package VISTA
(González (1993)). In addition to the equivalent widths of the measured six
lines, Table 3 also gives the two quantities
[EW(H) +EW(H) + EW(H)]
and
K/(H + H8) EW(K)/[EW(H + H) + EW(H8)]
and the derived logarithmic cluster ages.
Figure 4 illustrates the derivation of cluster ages from the measured equivalent widths and line ratios. The plotted curves represent the evolution of EW(H), , and K/(H + H8) as functions of logarithmic age, as measured from the model-cluster spectra of solar metallicity (BC96). For the Balmer lines, equivalent widths were measured from the high-spectral-resolution models (“gsHR”), the models based on Gunn & Stryker (1983) spectral energy distribution (“gs95”), and the models based on Kurucz (1995) atmospheres and Lejeune, Cuisinier, & Buser (1996, 1997) spectra (“kl96”); for details, see BC96. For the line ratio K/(H + H8), only the high-resolution model spectra (“gsHR”) could be used because the K line is insufficiently resolved in the other model spectra. For comparison with the models, Fig. 4 also shows the measured equivalent widths and line ratios—marked by horizontal lines—of the seven NGC 7252 clusters with absorption-line spectra.
As Fig. 4 illustrates, the new model-cluster spectra by BC96 now reproduce quite well the strong Balmer lines observed in several of the young clusters [EW(H) 10 Å]. This was not the case with the older model spectra by Bruzual & Charlot (1993), as found by Schweizer & Seitzer (1993) and Zepf et al. (1995b). Note that the strongest observed Balmer lines are best reproduced by the “gsHR” model spectra, presumably because these spectra have the highest spectral resolution (2 Å) among the three sets of model spectra used.
Cluster ages were determined from Fig. 4 as follows. Logarithmic ages were read off at the intersections between the horizontal lines marking the observed equivalent widths or ratio K/(H + H8) and the curves representing the model widths or ratio. Only measurements with a significance level of or higher were used. Since for many clusters the Balmer equivalent widths admit two possible values for the age, the ratio K/(H + H8) was used whenever possible to select the more likely of the two values. Finally, a weighted mean was formed of the logarithmic ages obtained from EW(H), , and K/(H + H8). This weighted mean is the logarithmic age given in the last column of Table 3.
As Table 3 shows, the ages of six of the eight clusters lie within the narrow range of about 400 – 600 Myr ( Age – 8.8). The age of Cluster S101, which is still embedded in its H 2 region, is 10 Myr, while the relatively poorly observed cluster S114 could be either about 40 Myr or 1.1 Gyr old.
4.3 Cluster Metallicities
To determine cluster metallicities, we measured the Lick line-strength indices (Faber et al. (1985); González (1993)) from the observed cluster spectra and compared them to indices computed for model clusters by Bressan, Chiosi, & Tantalo (1996) and BC96. Our measurements show that only the spectra of Clusters W3 and W6 have sufficiently high signal-to-noise ratios to yield Lick indices of the precision required for even coarse estimates of metallicity. Hence, the following discussion is restricted to these two clusters.
The presently available Lick indices for model-cluster spectra of non-solar metallicity (Bressan et al. (1996); BC96) are based on analytical fitting functions derived by Worthey et al. (1994). Because these fitting functions were designed for stellar populations older than 1 Gyr, one has to be cautious in using the model indices to interpret spectra of younger clusters. Therefore, the following discussion proceeds in two steps. First, we determine metallicities on the assumption that the logarithmic ages from Table 3, themselves derived on the assumption of solar metallicity, are approximately correct. This amounts essentially to a consistency check. Then, in a second step, we make an independent estimate of the cluster ages and metallicities using the H–[MgFe] diagram.
Figure 5 shows six measured line indices of Clusters W3 and W6 superposed on evolutionary tracks for model clusters of five different metallicities ( – 2.5 ; Bressan et al. (1996)). The cluster indices are plotted at the logarithmic ages given in Table 3. Note that (1) the age-sensitive index H plotted here is the Lick index and not the equivalent width of Table 3, and (2) the cluster indices were measured from smoothed versions of the observed spectra in order to match the lower resolution of the Lick indices (for details, see González (1993)). The model evolutionary tracks are plotted only over the age range over which the fitting functions for represent a reasonably good approximation to indices measured directly from a high-resolution set of model spectra. As the figure shows, the metallicity of the two young globular clusters inferred from the five metallicity-sensitive Fe and Mg indices is roughly solar, to better than a factor of two on average.
This result is consistent with our finding from Fig. 4 that the logarithmic ages of W3, W6, and W30 determined from the ratio K/(H + H8) agree to within 0.1 dex with those determined from the average Balmer equivalent width (taking the higher of the two possible values). If the cluster metallicity differed by more than a factor of two from solar, the age- and metal-sensitive ratio K/(H + H8) would yield ages significantly different from those derived from Balmer lines.
We have also compared the observed line-strength indices of W3 and W6 with the model-cluster indices of BC96, with very similar results except in the Mg index. When interpreted with the BC96 models, this index would suggest that Clusters W3 and W6 are about twice solar in magnesium abundance. This might suggest that, like some giant ellipticals, the two clusters may perhaps be abnormally rich in magnesium. However, the Bressan et al. (1996) models show consistency between the Mg and Fe abundances, whence the Mg enrichment suggested by the BC96 models may simply reflect model uncertainties.
The H–MgFe] diagram introduced by González (1993) yields an independent estimate of cluster ages and metallicities. Figure 6 shows this diagram plotted with data points for W3 and W6 and a grid of isochrones and isofers (lines of equal metallicity) derived from the Bressan et al. (1996) models. Here, the quantity [MgFe] is defined through [MgFe] , where Mg, Fe 5270, and Fe 5335 are Lick indices expressed in Å. This diagram yields cluster ages and logarithmic mean metallicities relative to the sun of (Age, ) = ( Myr, ) for W3 and ( Myr, ) for W6. Thus, the cluster ages derived from this diagram agree with those given in Table 3 to within 10%, and the relative metallicities are indeed close to solar.
Overall, these independent estimates of age and metallicity based on the H–[MgFe] diagram agree reasonably well with the cluster ages estimated in §4.2 and our former assumption that the clusters have solar metallicities to within a factor of two. However, we regard the ages given in Table 3 (and also Table 5, see §5.1) as more reliable than those derived from the H–[MgFe] diagram, since the latter ages depend on extrapolated fitting functions whereas the former ages depend on Balmer-line equivalent widths measured directly from the model spectra. When 1 Å resolution model spectra for clusters of non-solar metallicity become available in the near future, improved age and metallicity estimates for Clusters W3 and W6 will become feasible via comparisons with Lick indices also measured directly from the model spectra.
4.4 H 2 Region Around Cluster S101
Although the strengths of stellar absorption lines in Cluster S101 cannot be measured from our spectra, the fluxes of the emission lines of the surrounding H 2 region (see Fig. 1) are easily measurable. Therefore, a chemical abundance can be estimated for this H 2 region, in which Cluster S101 formed just recently. This abundance is presumably similar to that of the stellar cluster itself and, hence, adds a valuable third data point for comparison with the abundances of Clusters W3 and W6.
Table 4 gives the observed fluxes and estimated errors for nine emission lines ranging from [O 2] 3727 to [O 3] 5007. The errors include internal contributions from continuum fluctuations and photon noise in the lines themselves, but no external contributions from uncertainties in the flux calibration. The table also gives the observed and reddening-corrected flux ratios relative to H, and , respectively. The logarithmic reddening constant at H (e.g., Seaton (1979); Miller & Hodge (1996)), , was estimated from the line ratios and by comparison with a Case A spectrum for a temperature of K (Osterbrock (1989)) and corresponds to and .
The electron temperature cannot be determined accurately since the [O 3] 4363 line is not detected; however, the upper flux limit for this line yields an upper limit on the temperature of K (Osterbrock (1989)).
To determine the oxygen abundance O/H, we resort to Pagel et al.’s (1979) strong-line method, as developed and enhanced by McGaugh (1991, 1994; see also Miller & Hodge (1996)). From the line fluxes and ratios of Table 4 we compute the two quantities
and
where ([O 2] 3727 [O 3] 4959, 5007)/H is an empirical indicator of oxygen abundance and ([O 3] 4959, 5007)/ ([O 2] 3727) is a measure of the oxygen ionization level. The above two values, inserted into McGaugh’s (1991, esp. Figs. 9 and 10) model grids, yield an estimate for the mean ionization parameter of and estimates for the logarithmic oxygen abundance of either or , depending on whether the H 2 region surrounding Cluster S101 falls on the upper or lower branch, respectively, of the vs diagram. The metallicities corresponding to these two possible oxygen abundances are approximately and .
To distinguish between these two possible metallicities one needs a discriminator, for which the flux ratio [N 2] 6584[O 2] 3727) serves well (McGaugh (1994)). Although our cluster spectra do not cover the red region of the spectrum and the [N 2] line, two old image-tube spectrograms of Cluster S101 obtained with the Blanco 4-m telescope and the same RC spectrograph at dispersions of 25 Å mm-1 and 50 Å mm-1, respectively, are available (Schweizer (1982)). From the high-quality image-tube plates, we estimate that [N 2] 6584, whence the discriminating line ratio is [N 2] 6584[O 2] 3727) and its logarithm is [using and the value of [O 2] from Table 4]. When plotted in the [N 2]/[O 2]) vs diagram (McGaugh (1994), Fig. 3), this logarithmic ratio clearly and unambiguously points toward the H 2 region of Cluster S101 lying on the upper branch of the vs diagram. Therefore, the logarithmic oxygen abundance for this H 2 region, and presumably also for its embedded cluster, is , corresponding approximately to or .
The H 2 region’s H luminosity, measured within an area of kpc2, is erg s-1 (Table 4). We estimate that the total within a kpc2 area lies in the range (1 – erg s-1. Thus, this H 2 region is once to twice as H-luminous as 30 Doradus (Kennicutt & Chu (1988)) and clearly ranks among giant H 2 regions, though not among the most extreme cases found in spiral galaxies. For example, it is 2 – 4 times as H-luminous as the most luminous H 2 region in M51, but still only 1/8th to 1/4 as H-luminous as the extreme H 2 region in M101 (Searle (1971)).
5 DISCUSSION
The present discussion addresses various issues concerning the ages, metallicity, and physical nature of the observed young clusters in NGC 7252. The two most pressing questions are (1) whether most of these objects are truly globular clusters and (2) what their relation is to the metal-rich, but older globular clusters in elliptical galaxies.
5.1 Cluster Ages
Given the high luminosities of the three brightest observed globular clusters ( for W3, for W6, and for W30, if ), the spectroscopically determined cluster ages of = 470 – 580 Myr may come as a surprise. According to the models of cluster evolution by BC96, a 500 Myr old cluster with a Salpeter IMF fades by only mag over the next 14 Gyr (or, with a Scalo IMF, by only 2.6 mag). Hence, even when 14.5 Gyr old these three clusters should have absolute magnitudes of at least to . This would make them more luminous than most presently known old globulars in the Local Universe. If we choose , the cluster luminosities increase by mag and the problem is aggravated. Therefore, we need to carefully check how secure the spectroscopically determined cluster ages are.
A simple visual comparison of the cluster spectra of Fig. 1 with a sequence of Magellanic-Cloud cluster spectra arranged by age (Fig. 3 of Bica & Alloin (1986)) suggests immediately that, indeed, the NGC 7252 clusters have ages of typically a few 100 Myr. The spectra of younger Magellanic-Cloud clusters (– 100 Myr) differ significantly from those observed in the NGC 7252 clusters by having much stronger UV continua and weaker K lines. A more detailed comparison with an age sequence of model-cluster spectra of solar metallicity (BC96) confirms this conclusion. Whereas the spectrum of a 570 Myr old model cluster matches the observed spectrum of W3 extremely well, the spectra of model clusters half or twice that old show already significant deviations in both line ratios and continuum shape. Because of the extreme luminosities of W3, W6, and W30, we have specifically checked that even during the red-supergiant phase of cluster evolution (– 15 Myr) the spectra of model star clusters remain significantly different (weaker Balmer and Ca 2 K lines) from those observed in the NGC 7252 clusters. We conclude that at least for the most luminous NGC 7252 clusters the observed spectra allow only ages of Myr.
As a second check, Table 5 presents a comparison between the cluster ages determined from our spectra and cluster ages determined from HST photometry. Columns (1) to (3) give the cluster ID, the absolute magnitude , and the color index measured with HST and corrected for foreground reddening (Miller et al. (1997)), respectively. Column (4) gives the photometric age , derived from via BC96 models and on the assumption that . Finally, Col. (5) gives the logarithmic age determined from the observed spectra (see Table 3) and Col. (6) the spectroscopic age itself. Note that for five of the six clusters with both and , the two ages agree to within the combined errors.333 On average, the photometric cluster ages are about 20% smaller than the spectroscopic ages. This difference could be caused by, e.g., a small systematic error of 0.03 – 0.04 mag in the colors of the clusters or, conceivably, by non-solar metallicities. The BC96 models themselves seem unlikely to cause the discrepancy since the same models are used to derive both and . Thus, the newly derived spectroscopic ages confirm the general cluster ages estimated earlier from colors (W+ (93); Miller et al. (1997)). At least for the three NGC 7252 clusters with the highest signal-to-noise spectra, we deem the spectroscopic ages to be more reliable than the photometric ages since they are unaffected by reddening or photometric zero-point errors.
The spectroscopic cluster ages of Table 5 suggest that many second-generation globular clusters of NGC 7252 formed during a relatively short time interval lasting from about 600 Myr to 400 Myr ago. Fully six out of eight age-dated clusters have lying roughly within this time interval. The spectroscopic age of a seventh cluster, S114, is poorly determined, with formally two possible values of Myr or Myr. Within limits this cluster, too, could have formed during the above time interval. Finally, the eighth cluster, S101, was known to lie in a giant H 2 region of the western loop of NGC 7252 before it was observed, whence its very young age (10 Myr) comes as no surprise. In this assessment, note that we did not observe any of the “inner sample” clusters within 6″ from the nucleus. Many of these clusters are known to be significantly bluer than the “outer sample” clusters (W+ (93)) that we did observe and may be—at least in part—OB associations recently formed within the central molecular-gas disk (Miller et al. (1997)).
The above intense cluster-formation period of 600 – 400 Myr ago appears to have occurred in NGC 7252 shortly after the close encounter of the two disk galaxies that led to the formation of the present tidal tails and, eventually, to the galaxies’ coalescence. For this close encounter occurred about 770 Myr ago according to the detailed -body-simulation model of NGC 7252 by Hibbard & Mihos (1995). Interestingly, when scaled to NGC 7252’s mass and distance a similar, but generic model of two merging disk halo galaxies with gas suggests that the star-formation rate increased by an order of magnitude over normal beginning 100 Myr after the first close approach and lasting for 140 Myr (Mihos & Hernquist (1996)). These times correspond to a period of about 670 – 530 Myr ago. The close agreement between this predicted period of strongly enhanced star formation and the 600 – 400 Myr period of intense star formation indicated by the spectroscopic cluster ages of Table 5 seems remarkable.
5.2 Metallicity
The mean metallicities determined for Clusters W3 and W6 and for the H 2 region around Cluster S101 are , , and , respectively (§§4.3 and 4.4). Thus, all three objects appear to have solar abundances to within about 0.15 dex.
These near-solar abundances are perhaps what one might have expected given that (1) the three clusters formed from molecular gas during the past 0.6 Gyr and (2) the progenitors of NGC 7252 probably were two luminous, gas-rich Sc galaxies of (Schweizer (1982); Fritze–von Alvensleben & Gerhard (1994); Hibbard et al. (1994)). Yet, measured abundances clearly surpass informed speculation.
These measured near-solar abundances are also consistent with much recent evidence that (1) NGC 7252 itself is a protoelliptical galaxy (e.g., Hibbard et al. (1994); Schweizer (1996)) and (2) giant ellipticals tend to have globular-cluster systems with bimodal metallicity distributions, one peak of which contains clusters of roughly solar metallicity (e.g., Whitmore et al. (1995); Zepf et al. 1995a ; Geisler, Lee, & Kim 1996; Forbes et al. (1997)). Observations with HST indicate that the recent merger in NGC 7252 produced several hundred new globular clusters (Miller et al. (1997)). The ratio of newly-formed clusters to old clusters is about 0.7, quite close to the typical value of 0.5 for the ratio of red (metal-rich) to blue (metal-poor) globulars in giant ellipticals (Lee, Kim, & Geisler 1998). Thus, if most of the newly formed globular clusters in NGC 7252 are of similar metallicity as the three above objects, then within a few Gyr NGC 7252 will possess a globular-cluster system typical for a giant elliptical. The metallicity distribution will be bimodal, with a population of metal-poor clusters consisting of the globulars formerly belonging to the now-merged disk galaxies and a population of metal-rich clusters formed during the merger itself.
Note that in NGC 7252 the metal-poor globulars, identified as objects of 1.0 by Miller et al. (1997), stem from the merged spiral galaxies and not from dwarf galaxies accreted by the protoelliptical. Therefore, at least this one well understood case clearly favors the Ashman & Zepf (1992) scenario for the formation of globular-cluster systems in ellipticals. It would seem less compatible with the alternative scenario proposed by Forbes et al. (1997) that metal-poor globulars in ellipticals originated during an early phase of E formation, unless this early phase explicitly includes the formation of major disk galaxies that then merge to form the ellipticals themselves. And it is quite different from the alternative scenario proposed by Côté, Marzke, & West (1998), whereby the metal-poor globulars are captured from other galaxies either through tidal stripping or via the accretion of dwarfs.
5.3 Nature of Clusters
What exactly is the nature of the eight star clusters that we have studied spectroscopically? Which ones are young globular clusters, and which ones maybe are not? And how normal or abnormal are the most luminous of these clusters which, we claim below, clearly are young globulars? The present subsection addresses these questions and some related issues.
The new spectroscopic observations presented above harden the case, made already by Schweizer & Seitzer (1993), that many of the bluish point sources observed in NGC 7252 by W+ (93) and Miller et al. (1997) indeed are young globular clusters. In essence, any dense cluster with at least several thousand stars, an effective (= half-light) radius of the order of 10 pc or less, and an age exceeding one to two dozen core crossing times has to be gravitationally bound and is a globular cluster.
As Fig. 1 and Table 5 show, seven of the eight clusters studied feature strong Balmer absorption lines and have ages yr. With such ages and absolute magnitudes of , these clusters must contain well in excess of 105 stars each (see below). For five of these clusters (the W+ (93) objects), effective radii have been measured with the refurbished HST and are all pc (Table 1). Since these five clusters have typical of Galactic globular clusters, they must have core crossing times of a few Myr (see, e.g., Meylan & Heggie 1997) and are, therefore, typically 10 old (see Table 5). Hence, at least the five objects W3, W6, W26, W30, and W31 are all young globular clusters beyond any reasonable doubt.444 Here, as before, we use the term “young” for any globular cluster younger than 1.0 Gyr.
The two remaining absorption-line clusters, S105 and S114, have been imaged only from the ground. On various photographs and CCD frames, their images are indistinguishable from those of stars. This puts an estimated limit of (95 pc) on their effective radii. If both clusters are older than 0.5 Gyr, as their spectra and colors indicate (Table 5), then even this weak, ground-based limit puts a rather stringent upper limit of 0.2 km s-1 on any possible systematic expansion velocity of their stars. Therefore, even these two clusters are likely gravitationally bound and bona fide globulars.
Similar arguments cannot be made for the emission-line cluster S101. Both its location at the center of a giant H 2 region and its lack of stellar absorption lines indicate that this cluster is 10 Myr old. Although its high luminosity (), interpreted with various BC96 cluster models, implies a mass in excess of , its young age allows no conclusions to be drawn about the long-term stability. Thus, this could equally well be a nascent globular cluster or a very massive, but expanding OB association.
The high luminosities of the absorption-line objects, when combined with the spectroscopic ages of Table 5 and BC96 models, imply cluster masses mostly in excess of 10. This is true for both Salpeter(1955) and Scalo (1986) stellar initial mass functions (IMF). Specifically, cluster models with a Salpeter IMF predict mass-to-light ratios in the range for all objects and individual cluster masses of for W31, (1 – 4) for W6, W26, W30, S105, and S114, and an astounding for W3. Cluster models with Scalo IMF predict masses only about 10% smaller on average. Thus, all seven absorption-line objects appear currently at least as massive as Cen (; Meylan et al. (1995)), the most massive globular cluster of the Milky Way. Given these extraordinarily high inferred masses, the question arises whether the most luminous globular clusters of NGC 7252 are in any currently detectable way abnormal or not.
Miller et al. (1997) note that the five brightest clusters of NGC 7252 imaged on the PC chip of WFPC2 appear to have more extended wings than the other clusters. From the same HST images, we have derived apparent surface-brightness profiles in for the three most luminous clusters W3, W6, and W30 and have compared them with the apparent profiles of fainter candidate clusters on the same images and of stars measured on an image of Cen. When normalized to unity at the center, the apparent surface-brightness profile of Cluster W3 clearly exceeds the comparison profiles out to a radius of about 10 pixel (= = 140 pc), and the profiles of W6 and W30 exceed the comparison profiles out to 7 pixel (= = 100 pc). For comparison, the median tidal radius of Milky-Way globulars is about 35 pc, and only six out of 87 clusters listed by Aguilar et al. (1988) have pc. Grillmair et al. (1995) argue that in many cases the tidal radii obtained by model fitting actually underestimate the true extent of the stellar distributions in Milky-Way globulars. Thus, and although we certainly cannot accurately measure tidal radii for the clusters in NGC 7252, it would appear that W3, W6, and W30 are large, but not abnormally large, globulars when compared to their old counterparts in the Milky Way.
The suggested high masses of for the most luminous half dozen globulars in NGC 7252 need to be checked through high-resolution spectroscopy and velocity-dispersion measurements of the kind done by Ho & Filippenko (1996) for Cluster A in NGC 1569. Especially Cluster W3 in NGC 7252 should be an easy target for 8 – 10 meter class telescopes (). If the high cluster masses are confirmed, then the question will be whether such massive clusters tend to loose 50% – 90% of their mass over 15 Gyr due to mechanisms such as evaporation, tidal stripping, and stellar mass loss (e.g., Meylan & Heggie (1997)). If they do, then even these highly luminous clusters might eventually resemble Cen in size, luminosity, and mass. If they do not, then extraordinarily luminous and massive clusters should at least occasionally be found in other external galaxies and, especially, in ellipticals.
There are very few, if any, extraordinarily luminous old globular clusters known. The most luminous, spectroscopically confirmed or photometrically well measured globular clusters in NGC 1399 and NGC 4472 have absolute magnitudes of (Kissler-Patig et al. 1998; Geisler et al. (1996)). In M87, at least three likely globular clusters of are known (Whitmore et al. 1995). Scaled relative to Cen, an old globular cluster of should have a mass of . Therefore, a few old globulars as massive as the 4th – 7th most luminous young globulars in NGC 7252 are known, but no old globulars as massive as the three most luminous globulars in NGC 7252 are known.
In the dynamically young elliptical galaxy NGC 1700, Whitmore et al. (1997) point out a bright () point-like source west and north of the nucleus. This source has the right color index ( = 0.93) to be an old globular cluster, but would have an exceptional if it were such a cluster and would be about 3 mag brighter than the next-brightest candidate globular. Since the source appears unresolved, Whitmore et al. suggest that instead it may be a star. On 1996 December 13, we obtained a spectrum of this intriguing object with the 2.4-m Hiltner telescope at the Michigan–Dartmouth–MIT Observatory. The 4 hr exposure, taken with the Modular Spectrograph in sub-arcsecond seeing and covering the wavelength range 3700 – 5600, clearly shows that this object indeed is a galactic foreground star of spectral type F or G.
We conclude that either (i) our photometric estimates of masses for the most luminous young globulars of NGC 7252 are excessive, or (ii) latter-day mergers of spiral galaxies occasionally form globular clusters that are abnormally massive, or (iii) globular clusters very massive at birth () experience significant mass loss over periods of 10 – 15 Gyr. Of these three possibilities, the last seems the most likely at present (Gnedin & Ostriker 1997; Portegies Zwart et al. 1998).
5.4 Origin of Young Globular Clusters
There is growing evidence that young globular clusters in present-day mergers form from Giant Molecular Clouds (GMC). Our observations of eight NGC 7252 clusters fit in with this evidence, which is as follows.
First, the luminosity functions of young-globular-cluster systems are remarkably similar to the mass functions of GMCs in present-day spiral galaxies (Harris & Pudritz (1994)). Both kinds of functions are power laws with similar exponents and upper-end cutoffs. For example, the luminosity functions of young clusters in NGC 4038/39, NGC 3921, and NGC 7252 are all of the form , where (Whitmore & Schweizer (1995); Schweizer et al. (1996); Miller et al. (1997)), whereas the mass function of Galactic GMCs is a similar power law with exponent . And the most massive Galactic GMCs reach masses of about , which is only slightly more than the mass of Cen.
Second, both in NGC 7252 and in NGC 3921 the radial distribution of the young globular clusters follows closely the remnant’s visual light distribution, which itself is well approximated by an -law. This indicates that the progenitors of the young globular clusters experienced the same violent relaxation as did the disk stars (Schweizer et al. (1996)). This in turn suggests that these progenitors reacted to the merger like point masses and were quite compact. The GMCs of the input galaxies fit the bill, while the more diffuse interstellar gas presumably experienced significant dissipation and piled up near the center of the remnant, redistributing itself differently from the stars. This again points to GMCs being the progenitors of the young globular clusters.
Although not pointing uniquely to GMCs as progenitors, the fact that three young clusters in NGC 7252 all have near-solar metallicities (§5.2) is consistent with this picture. The GMCs of two present-day Sc galaxies of are expected to have about solar metallicities, and nearly the same must have been true for the two likely Sc galaxies that started merging in NGC 7252 about 0.8 Gyr ago (see §5.1). As Jog & Solomon (1992) first pointed out, the rapidly mounting pressure of interstellar gas heated in starbursts provides a natural mechanism for triggering the collapse of cold GMCs embedded in that gas (see also Elmegreen & Efremov (1997)).
It may be no mere coincidence that Cluster S101, the least metal-rich ( ) of the three objects measured, is also the youngest (10 Myr) of the observed clusters and the most distant from the center ( kpc). As H 1 observations and a dynamical model of NGC 7252 demonstrate, matter ejected from the two former disk galaxies into the tidal tails continues falling back into the remnant (Hibbard et al. (1994); Hibbard & Mihos (1995)). Matter presently arriving stems from regions farther out in the input disks than matter that arrived earlier and should, therefore, be of lower metallicity. Since Cluster S101 is located in the western loop, which itself appears to be an inward continuation of the eastern tail (Schweizer (1982)), it may have formed (or just be forming) from a GMC that was triggered into collapse upon reentry into the denser parts of the remnant.
Only one result may not quite fit in with the above simple picture of cluster formation from GMCs. If confirmed through velocity-dispersion measurements, the suggested extraordinarily high mass of Cluster W3 exceeds that of any known Galactic GMC by a factor of about 20. How any single GMC could have grown to that mass is unclear, and special processes such as cloud coalescence or runaway growth in dense shocks may have to be invoked.
With this possible exception, the measured ages and metallicities of young, mostly globular clusters in NGC 7252 appear to be consistent with the hypothesis that these objects formed from GMCs formerly populating the disks of two late-type, gas-rich galaxies. Whereas many of these GMCs were triggered into collapse and cluster formation during the early, most violent phases of the galactic merger 600 – 400 Myr ago, a few late returners may still be experiencing the same fate at the present time.
6 SUMMARY
We have described spectroscopic observations of 12 candidate clusters in the merger remnant NGC 7252, nine of which yielded useful spectra. Of these nine objects one turns out to be a background galaxy, while the other eight are high-luminosity star clusters clearly associated with NGC 7252 itself. The main results of our analysis are as follows:
(1) The eight clusters lie at projected distances of – 48″ (3.2 – 15 kpc) from the center and have a line-of-sight velocity dispersion of km s-1, comparable to that of the globular clusters in NGC 5128 and indicative of a mass of about within kpc. The mass-to-light ratio of NGC 7252 within the same radius is in solar units.
(2) Seven of the eight clusters show strong Balmer absorption lines in their spectra (H – H14 in the best observed case), while Cluster S101 lies in a giant H 2 region and shows no detectable absorption features. In contrast to earlier models, new cluster models by Bruzual & Charlot (1996) and Bressan et al. (1996) reproduce the observed strong Balmer lines well (Fig. 4). Based on these models, the ages of six of the absorption-line clusters lie in the narrow range of 400 – 600 Myr, while the age of the seventh cluster is poorly determined. The emission-line cluster S101 has an estimated age of 10 Myr.
(3) At least five, and probably all seven, absorption-line objects are young globular clusters, as judged by their effective radii (8 pc where measured with HST) and the fact that they are typically 102 core crossing times old. The emission-line cluster, being only a few crossing times old, could be either a nascent globular cluster or a massive expanding OB association.
(4) The spectra of absorption-line clusters with good signal-to-noise ratios also feature relatively strong metal lines, including the Mg triplet at 5175. For two of these clusters and for the gas surrounding the emission-line object, metallicities can be derived from the spectra. The mean metallicities are solar to within about 0.15 dex. Specifically, the logarithmic mean metallicities are for Cluster W3 and for W6, while the oxygen abundance of the H 2 region containing Cluster S101 is , corresponding approximately to .
(5) If most of the newly-formed globular clusters in NGC 7252 have approximately solar metallicities as Clusters W3, W6, and S101 do, then this recent merger remnant and protoelliptical has just formed a globular-cluster system with a bimodal metallicity distribution. The ratio between its numbers of young and old globular clusters is about 0.7 (Miller et al. (1997)), similar to the typical ratio of 0.5 between metal-rich and metal-poor globulars observed in giant ellipticals. Therefore, NGC 7252 and its globular-cluster system provide valuable direct evidence for the hypothesis that many giant ellipticals, and especially those with bimodal cluster systems, formed through major mergers of gas-rich disk galaxies.
(6) The intense cluster-formation period of 600 – 400 Myr ago indicated by the spectroscopically determined cluster ages seems to have occurred in NGC 7252 shortly after the close encounter of two gas-rich disk galaxies that led to a merger and the present-day remnant. According to the dynamical model by Hibbard & Mihos (1995), this close encounter occurred about 770 Myr ago (). It seems likely that the progenitors of the newly formed, second-generation globular clusters were mostly Giant Molecular Clouds in the disk galaxies, triggered into collapse and efficient star formation by surrounding starburst-heated gas.
(7) A puzzling property of the observed young solar-metallicity globulars are their high masses implied by the luminosities and ages. When interpreted with BC96 models featuring Salpeter and Scalo IMFs, the luminosities yield masses of 1 – 8 that of Cen for six of the globulars and a whopping 35( Cen) for the seventh, exceptionally luminous cluster W3. For comparison, the most luminous old globular clusters known in giant ellipticals have estimated masses of only about 3 – 4( Cen). Thus, either the inferred masses of the young globulars in NGC 7252 are too high (e.g., because of different stellar IMFs) or massive globular clusters experience up to 90% mass loss while evolving from 0.5 Gyr to 15 Gyr. The predicted masses of these young globulars can and should be checked through velocity-dispersion measurements with 8 – 10 meter class telescopes.
Acknowledgements.
We thank Dr. M. G. Smith, Director of the Cerro Tololo Inter-American Observatory, for allocating us telescope time, Jack Baldwin and German Schumacher for valuable advice concerning precision offsets, and Hernan Tirado and the mountain staff for expert technical assistance at the telescope. John Hibbard kindly provided a map of the color index in NGC 7252, Tad Pryor a copy of his maximum-likelihood-estimator code, and Alessandro Bressan and Gustavo Bruzual electronic data from their latest cluster-evolution models. One of us (F.S.) thanks Sandra Keiser and Michael Acierno for cheerful and dedicated computer support and gratefully acknowledges partial support from NSF through Grants AST–92 21423 and AST–95 29263.References
- Aguilar et al. (1988) Aguilar, L., Hut, P., & Ostriker, J. P. 1988, ApJ, 335, 720
- Ashman & Zepf (1992) Ashman, K. M., & Zepf, S. E. 1992, ApJ, 384, 50
- Ashman & Zepf (1998) Ashman, K. M., & Zepf, S. E. 1998, Globular Cluster Systems (Cambridge: Cambridge Univ. Press)
- Bahcall & Tremaine (1981) Bahcall, J. N., & Tremaine, S. 1981, ApJ, 244, 805
- Bica & Alloin (1986) Bica, E., & Alloin, D. 1986, A&AS, 66, 171
- Bressan et al. (1996) Bressan, A., Chiosi, C., & Tantalo, R. 1996, A&A, 311, 425
- Brodie et al. (1998) Brodie, J. P., Schroder, L. L., Huchra, J. P., Phillips, A. C., Kissler-Patig, M., & Forbes, D. A. 1998, preprint (astro-ph/9805086)
- Bruzual & Charlot (1993) Bruzual A., G., & Charlot, S. 1993, ApJ, 405, 538
- Bruzual & Charlot (1996) Bruzual A., G., & Charlot, S. 1996, electronic distribution of cluster models, and in preparation (BC96)
- Carlson et al. (1998) Carlson, M. N., et al. 1998, AJ, 115, 1778
- Charlot et al. (1996) Charlot, S., Worthey, G., & Bressan, A. 1996, ApJ, 457, 625
- Cohen et al. (1998) Cohen, J. G., Blakeslee, J. P., & Ryzhov, A. 1998, ApJ, 496, 808
- Côté et al. (1998) Côté, P., Marzke, R. O., & West, M. J. 1998, ApJ, in press
- de Vaucouleurs et al. (1991) de Vaucouleurs, G., de Vaucouleurs, A., Corwin, H. G., Buta, R. J., Paturel, G., & Fouqué, P. 1991, Third Reference Catalogue of Bright Galaxies (Berlin: Springer)
- Elmegreen & Efremov (1997) Elmegreen, B. G., & Efremov, Y. N. 1997, ApJ, 480, 235
- Faber et al. (1985) Faber, S. M., Friel, E. D., Burstein, D., & Gaskell, C. M. 1985, ApJS, 57, 711
- Forbes et al. (1997) Forbes, D. A., Brodie, J. P., & Grillmair, C. J. 1997, AJ, 113, 1652
- Fritze–von Alvensleben & Gerhard (1994) Fritze–von Alvensleben, U., & Gerhard, O. E. 1994, A&A, 285, 775
- Fritze–von Alvensleben & Burkert (1995) Fritze–von Alvensleben, U., & Burkert, A. 1995, A&A, 300, 58
- Geisler et al. (1996) Geisler, D., Lee, M. G., & Kim, E. 1996, AJ, 111, 1529
- Gnedin & Ostriker (1997) Gnedin, O. Y., & Ostriker, J. P. 1997, ApJ, 474, 223
- González (1993) González, J. J. 1993, Ph. D. thesis, UC Santa Cruz
- Grillmair et al. (1995) Grillmair, C. J., Freeman, K. C., Irwin, M., & Quinn, P. J. 1995, AJ, 109, 2553
- Gunn & Stryker (1983) Gunn, J. E., & Stryker, L. L. 1983, ApJS, 52, 121
- Haller & Melia (1996) Haller, J. W., & Melia, F. 1996, ApJ, 464, 774
- Harris et al. (1988) Harris, H. C., Harris, G. L. H., & Hesser, J. E. 1988, in Globular Cluster Systems in Galaxies, ed. J. E. Grindley & A. G. D. Philip (Dordrecht: Kluwer), 205
- Harris & Pudritz (1994) Harris, W. E., & Pudritz, R. E. 1994, ApJ, 429, 177
- Heisler et al. (1985) Heisler, J., Tremaine, S., & Bahcall, J. N. 1985, ApJ, 298, 8
- Hibbard et al. (1994) Hibbard, J. E., Guhathakurta, P., van Gorkom, J. H., & Schweizer, F. 1994, AJ, 107, 67
- Hibbard & Mihos (1995) Hibbard, J. E., & Mihos, J. C. 1995, AJ, 110, 140
- Ho & Filippenko (1996) Ho, L. C., & Filippenko, A. V. 1996, ApJ, 466, L83
- Holtzman et al. (1996) Holtzman, J. A., et al. 1996, AJ, 112, 416
- Jog & Solomon (1992) Jog, C.J., & Solomon, P.M. 1992, ApJ, 387, 152
- Kennicutt & Chu (1988) Kennicutt, R. C., & Chu, Y.-H. 1988, AJ, 95, 720
- Kennicutt et al. (1998) Kennicutt, R. C., Schweizer, F., & Barnes, J. E. 1998, Galaxies: Interactions and Induced Star Formation, ed. D. Friedli, L. Martinet, & D. Pfenniger (Berlin: Springer)
- Kent (1990) Kent, S. M. 1990, in Evolution of the Universe of Galaxies, ed. R. G. Kron (San Francisco: ASP), 109
- Kissler-Patig et al. (1998) Kissler-Patig, M., Brodie, J. P., Schroder, L. L., Forbes, D. A., Grillmair, C. J., & Huchra, J. P. 1998, AJ, 115, 105
- Kurucz (1995) Kurucz, R. 1995, private communication to G. Bruzual A.
- Lake & Dressler (1986) Lake, G., & Dressler, A. 1986, ApJ, 310, 605
- Larson (1990) Larson, R. B. 1990, PASP, 102, 709
- Lee et al. (1998) Lee, M. G., Kim, E., & Geisler, D. 1998, AJ, 115, 947
- Lejeune et al. (1996) Lejeune, T., Cuisinier, F., & Buser, R. 1996, AAS CD-ROM Series, Vol. 7
- Lejeune et al. (1997) Lejeune, T., Cuisinier, F., & Buser, R. 1997, A&AS, 125, 229
- McGaugh (1991) McGaugh, S. S. 1991, ApJ, 380, 140
- McGaugh (1994) McGaugh, S. S. 1994, ApJ, 426, 135
- Meurer et al. (1995) Meurer, G. R., Heckman, T. M., Leitherer, C., Kinney, A., Robert, C., & Garnett, D. R. 1995, AJ, 110, 2665
- Meylan & Heggie (1997) Meylan, G., & Heggie, D. C. 1997, A&A Rev., 8, 1
- Meylan et al. (1995) Meylan, G., Mayor, M., Duquennoy, A., & Dubath, P. 1995, A&A, 303, 761
- Mihos & Hernquist (1996) Mihos, J. C., & Hernquist, L. 1996, ApJ, 464, 641
- Miller & Hodge (1996) Miller, B. W., & Hodge, P. 1996, ApJ, 458, 467
- Miller et al. (1997) Miller, B. W., Whitmore, B. C., Schweizer, F., & Fall, M. 1997, AJ, 114, 2381
- Osterbrock (1989) Osterbrock, D. E., 1989, Astrophysics of Gaseous Nebulae and Active Galactic Nuclei (Mill Valley, CA: University Science Books)
- Pagel et al. (1979) Pagel, B. E. J., Edmunds, M. G., Blackwell, D. E., Chun, M. S., & Smith, G. 1979, MNRAS, 189, 95
- Portegies Zwart et al. (1998) Portegies Zwart, S. F., Hut, P., Makino, J., & McMillan, S. L. W. 1998, A&A, in press
- Pryor & Meylan (1993) Pryor, C., & Meylan, G. 1993, in Structure and Dynamics of Globular Clusters, ASP Conf. Ser. Vol. 50, ed. S. G. Djorgovski & G. Meylan (San Francisco: ASP), 357
- Salpeter (1955) Salpeter, E. E. 1955, ApJ, 121, 161
- Sanders & Mirabel (1996) Sanders, D. B., & Mirabel, I. F. 1996, ARA&A, 34, 749
- Scalo (1986) Scalo, J. M. 1986, Fund. Cosmic Phys., 11, 1
- Schweizer (1982) Schweizer, F. 1982, ApJ, 252, 455
- Schweizer (1987) Schweizer, F. 1987, in Nearly Normal Galaxies, edited by S. M. Faber (New York: Springer), 18
- Schweizer (1996) Schweizer, F. 1996, AJ, 111, 109
- Schweizer (1998) Schweizer, F. 1998, in Galaxies: Interactions and Induced Star Formation, ed. D. Friedli, L. Martinet, & D. Pfenniger (Berlin: Springer), 105, esp. Chap. 3
- Schweizer et al. (1996) Schweizer, F., Miller, B. W., Whitmore, B. C., & Fall, S. M. 1996, AJ, 112, 1839
- Schweizer & Seitzer (1992) Schweizer, F., & Seitzer, P. 1992, AJ, 104, 1039
- Schweizer & Seitzer (1993) Schweizer, F., & Seitzer, P. 1993, ApJ, 417, L29
- Searle (1971) Searle, L. 1971, ApJ, 168, 327
- Seaton (1979) Seaton, M. J., 1979, MNRAS, 187, 73P
- Whitmore (1998) Whitmore, B. C. 1998, in Galaxy Interactions at Low and High Redshift, ed. D. B. Sanders & J. E. Barnes (Dordrecht: Kluwer), in press
- W+ (93) Whitmore, B. C., Schweizer, F., Leitherer, C., Borne, K., & Robert, C. 1993, AJ, 106, 1354 (W+93)
- Whitmore & Schweizer (1995) Whitmore, B. C., & Schweizer, F. 1995, AJ, 109, 960
- Whitmore et al. (1995) Whitmore, B. C., Sparks, W. B., Lucas, R. A., Macchetto, F. D., & Biretta, J. A. 1995, ApJ, 454, L73
- Whitmore et al. (1997) Whitmore, B. C., Miller, B. W., Schweizer, F., & Fall, M. 1997, AJ, 114, 1797
- Worthey et al. (1994) Worthey, G., Faber, S. M., González, J. J., & Burstein, D. 1994, ApJS, 94, 687
- Zepf & Ashman (1993) Zepf, S. E., & Ashman, K. M. 1993, MNRAS, 264, 611
- (75) Zepf, S. E., Ashman, K. M., & Geisler, D. 1995a, ApJ, 443, 570
- (76) Zepf, S. E., Carter, D., Sharples, R. M., & Ashman, K. M. 1995b, ApJ, 445, L19
| Other | PA | bbFrom Miller et al. (1997); and are corrected for Milky Way foreground extinction of . | bbFrom Miller et al. (1997); and are corrected for Milky Way foreground extinction of . | bbFrom Miller et al. (1997); and are corrected for Milky Way foreground extinction of . | PAobs | Exp.ccTotal exposure time of analyzed spectrum, excluding exposures discarded because of heavy cirrus. | |||||
|---|---|---|---|---|---|---|---|---|---|---|---|
| # | IDaaLetter “W” identifies objects from Whitmore et al. (1993), letter “S” from present paper. | (″) | (″) | (″) | (°) | (pc) | (mag) | (mag) | (°) | (s) | Type |
| 1 | W3 | 14.56 | 3.80 | 15.05 | 284.6 | 7.1 | 17.84 | 0.64 | 117.5 | 7200 | GC |
| 2 | W6 | 11.01 | 14.07 | 17.87 | 322.0 | 4.2 | 19.64 | 0.64 | 107.3 | 9600 | GC |
| 3 | W26 | 4.52 | 9.37 | 10.40 | 25.8 | 7.6 | 20.39 | 0.68 | 107.3 | 9600 | GC |
| 4 | W30 | 7.53 | 7.69 | 10.77 | 135.6 | 5.0 | 19.46 | 0.63 | 117.5 | 7200 | GC |
| 5 | W31 | 9.08 | 6.29 | 11.05 | 124.7 | 3.1 | 21.07 | 0.54 | 1.8 | 3000 | GC |
| 6 | S101 | 48.0 | 3.1 | 48.10 | 266.3 | 58.5 | 12000 | Cl + H II | |||
| 7 | S105 | 33.15 | 6.0 | 33.69 | 280.3 | 58.5 | 12000 | GC | |||
| 8 | S114ddCluster S114 is also #42 in Table 1 of Miller et al. (1997). | 21.15 | 18.7 | 28.23 | 131.5 | 21.23 | 0.62 | 78.9 | 9600 | GC | |
| 9 | S117 | 48.6 | 13.3 | 50.39 | 105.3 | 78.9 | 9600 | GalaxyeeBackground galaxy at redshift . |
| aa = (, see text. | ||||
|---|---|---|---|---|
| Cluster | (km s-1) | (km s-1) | (km s-1) | |
| W3 | 4821 | 7 | 2 | 71 |
| W6 | 4709 | 9 | 3 | 39 |
| W26 | 4876 | 31 | 3 | 125 |
| W30 | 4624 | 17 | 2 | 123 |
| W31 | 4523 | 1 | 222 | |
| S101bbCluster embedded in H 2 region, em.-line velocity. | 4504 | 5 | 4 | 241 |
| S105 | 4648 | 37 | 4 | 99 |
| S114 | 4880 | 47 | 3 | 129 |
| H | H | H | H + H | K | H8 | ||||
|---|---|---|---|---|---|---|---|---|---|
| Cluster | (Å) | (Å) | (Å) | (Å) | (Å) | (Å) | (Å) | K/(H + H8) | AgeaaAge expressed in years. |
| W3 | 11.30.3 | 11.00.1 | 13.80.5 | 13.00.1 | 3.50.1 | 9.30.5 | 12.00.2 | 0.1560.005 | 8.730.02 |
| W6 | 11.2 0.6 | 9.5 0.6 | 12.8 0.3 | 12.7 0.6 | 3.5 1.0 | 9.8 1.5 | 11.2 0.3 | 0.155 0.046 | 8.76 0.04 |
| W26 | 9.6 2.9 | 11.7 2.2 | 12.6 1.5 | 11.3 1.4 | 2.3 1.1 | 9.9 1.9 | 11.3 1.3 | 0.110 0.054 | 8.72 0.20 |
| W30 | 13.2 1.0 | 11.2 1.2 | 13.8 0.3 | 15.5 0.1 | 4.3 1.1 | 12.2 1.3 | 12.7 0.5 | 0.156 0.040 | 8.67 0.04 |
| W31 | 12.7 3.5 | 7.9 3.8 | 13.8 5.8 | 13.8 4.3 | …. … | 11.6 2.4 | 11.5 3.2 | …. …. | 8.58 0.23 |
| S101 | 18.3 2.5 | 4.5 1.5 | 0.7 1.6 | …. … | …. … | …. … | …. … | …. …. | 7.0 |
| S105 | 11.8 2.0 | 13.4 3.0 | 5.9 2.7 | 12.8 1.0 | …. … | 13.5 5.8 | 10.4 1.5 | …. …. | 8.78 0.08bbOne of two possible values; other value is . |
| S114 | 6.2 1.1 | 8.2 1.6 | 11.2 5.4 | 9.7 3.3 | …. … | 9.5 0.7 | 8.5 1.9 | …. …. | 9.06 0.10ccOne of two possible values; other value is . |
| Flux | ||||
|---|---|---|---|---|
| Line/Ion | (Å) | ( erg cm-2 s-1) | ||
| [O 2] | 3727 | 9.230.20 | 2.620.22 | 3.840.32 |
| [Ne 3] | 3869 | 0.50 0.25 | 0.14 0.07 | 0.20 0.10 |
| H8 He 1 | 3889 | 0.48 0.25 | 0.14 0.07 | 0.20 0.10 |
| H | 4101 | 0.69 0.24 | 0.20 0.07 | 0.26 0.09 |
| H | 4340 | 1.39 0.26 | 0.40 0.08 | 0.48 0.10 |
| [O 3] | 4363 | 0.05 …… | 0.014 ….. | 0.02 …… |
| HaaReddening-corrected flux is erg cm-2 s-1, and luminosity is erg s-1 (for ). | 4861 | 3.52 0.28 | 1.00 0.00 | 1.00 0.00 |
| [O 3] | 4959 | 0.76 0.12 | 0.22 0.04 | 0.21 0.04 |
| [O 3] | 5007 | 3.31 0.16 | 0.94 0.09 | 0.89 0.08 |
| aaFor km s-1 Mpc-1. | bbFrom Miller et al. (1997). | ||||
|---|---|---|---|---|---|
| Cluster | (mag) | (mag) | (Myr) | (yr) | (Myr) |
| (1) | (2) | (3) | (4) | (5) | (6) |
| W3 | 16.2 | ||||
| W6 | 14.4 | ||||
| W26 | 13.6 | ||||
| W30 | 14.6 | ||||
| W31 | 13.0 | ||||
| S101 | 14.1: | 7.0 | 10 | ||
| S105 | 13.6: | ccOne of two possible values, other value being . | |||
| S114 | 12.8 | ddUncertain; one of two possible values, other value being . |