Abstract
We report on analyses of cluster samples obtained from the Hubble Volume Simulations. These simulations, an model named CDM and a flat low model with a cosmological constant (CDM), comprise the largest computational efforts to date in numerical cosmology. We investigate the presence of massive galaxy clusters at . The CDM model fails to form clusters at such a redshift. However, due to the small number of observed clusters around and the uncertainties in the determinations of their masses, this conclusion still is somewhat preliminary. We produce cluster catalogs at for both cosmologies and investigate their two–point correlation function . We show that the relationship between the mean density of subsamples of clusters, expressed via their mean separation , and the correlation length , defined through , is not linear but turns over gently for large . An analytic prediction by Mo & White [13] overpredicts . The results from the analysis of the APM cluster data by Croft et al. [7] are nicely matched by the CDM model.
Galaxy Clusters in the Hubble Volume Simulations
1Max–Planck–Institut für Astrophysik, Karl–Schwarzschild–Str. 1, D–85740 Garching, Germany
2Rechenzentrum Garching, Boltzmannstr. 2, D–85740 Garching, Germany
3Physics Dept., University of Durham, Durham DH1 3LE, UK
4Physics Dept., University of Michigan, Ann Arbor, MI 48109–1120, USA
5Dept. of Astronomy, University of Western Ontario, London, Ontario N6A 3K7, Canada
6Institute of Astronomy, Madingley Road, Cambridge CB3 0HA, UK
7Royal Observatory, Institute for Astronomy, University of Edinburgh,
Edinburgh EH9 3HJ, UK
8CPES, University of Sussex, Brighton BN1 9QH, UK
9from Oct. 1st 1998 at Cap Gemini GmbH, Kaulbachstr. 1,
D–80539 München, Germany
10Now at Enterprise Architecture Group, Global Securities Industry
Group, 1185 Avenue of the Americas, New York 10036, USA
1 The Hubble Volume Simulations
The Hubble Volume Simulations [10] comprise the biggest computational effort in numerical cosmology to date. They follow the evolution of particles in volumes which contain a significant fraction of the whole observable Universe and which are several times larger than the largest of the forthcoming galaxy surveys. Table 1 gives the parameters of the two models, CDM and CDM. is the size of the cubic box in one dimension. Details about the models can be found elsewhere [11].
| Table 1. The Simulation Parameters | ||||||
| Model | ||||||
| CDM | 0.3 | 0.7 | 0.7 | 0.21 | 0.9 | 3 |
| CDM | 1.0 | 0.0 | 0.5 | 0.21 | 0.6 | 2 |
2 Galaxy Clusters in the Hubble Volume Simulations
2.1 Galaxy Clusters at
These days, the number of observations of clusters at is increasing at an enormous rate (see e.g. [6, 8, 12]). We have looked for mass concentrations in the simulation outputs at which are in the ranges given in [6, 8, 12], that is . Although measurements of masses of clusters at these high redshifts still contain significant uncertainties, nevertheless it can be concluded that the CDM model fails to predict objects of such masses. The number densities of clusters with a mass of around are more than two orders of magnitudes below the number densities of the three observed clusters, and we haven’t found a single object with . The CDM model does not suffer from these problems. However, more observational data is clearly required to investigate this model which is strongly favoured by measurements of distant supernovae (see the contributions of Perlmutter and Leibundgut in these proceedings) in more detail (see also [10] for a discussion of rare events).
2.2 The Two–Point Correlation Function of Galaxy Clusters
The two–point correlation function of galaxy clusters has been controversial for decades now. Since the early seventies, it has been known that rich galaxy clusters are more strongly clustered than galaxies. However, the amplitude of the two–point correlation function and its dependence on cluster richness have been the subject of controversy.
The correlation function depends on cluster richness. Richer clusters are rarer, hence their mean space density, , is smaller. Usually this is expressed using the mean intercluster separation . Bahcall (e.g. [4, 5]) has argued that the correlation length, , defined via , scales linearly with ,
| (1) |
This ansatz is based on self–similar scaling, that is on the assumption that the correlation function is a power law with a fixed slope, . Early measurements of for the Abell cluster sample [1, 2] seemed to confirm this scaling (e.g. [3, 14]). However, Peacock & West [14] and Efstathiou et al. [9] found strong anisotropy signals in the catalogs which enhanced the clustering amplitude.
Given a set of points, the two–point correlation function gives the excess probability of finding a pair of points separated by a distance compared with a random Poisson process. The code we use to compute the two–point correlation function counts the numbers of such pairs as a function of separation and from that computes .
Starting from a Press–Schechter type ansatz, Mo & White (1996) develop an analytical theory to describe the spatial clustering of haloes. In particular, they find that the two–point correlation function of Dark Matter haloes of Lagrangian radius is related to that of the mass, , by
| (2) |
where
| (3) |
Here, is the interpolated linear overdensity at collapse of a spherical perturbation and is the rms mass fluctuation on the scale of the halo (using a Top–Hat filter).
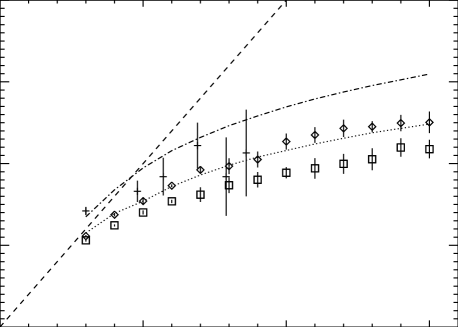
In order to compute the correlation length, we fit the correlation function at the vicinity of with a power law of the following form
| (4) |
where and are free parameters. Figure 1 gives the results of the fits for the correlation lengths. The boxes and diamonds are for the CDM and CDM simulation, respectively. The dotted and dot–dashed line are the results for the Mo & White ansatz using eq. (2). Also given are the results of Croft et al.’s analysis of the APM clusters and the linear scaling, eq. (1), proposed by Bahcall. The linear scaling fails to reproduce the relation between the cluster sample density and the correlation length completely. Interestingly, the analytical prediction by Mo & White lies above the simulation results. The APM clusters analyzed in Croft et al. follow the trend of the simulated clusters but have slightly larger amplitudes. Clearly, of the two cosmological models discussed here, CDM is more consistent with the APM data.
Acknowledgements. JMC thanks Neta Bahcall and Douglas Clowe for interesting discussions on the above topics during the conference.
References
- [1] Abell G.O., ApJS, 3, 211 (1958)
- [2] Abell G.O., Corwin H.G., Olowin R.P., ApJS, 70, 1 (1989)
- [3] Bahcall N.A., Soneira R.M., ApJ, 270, 20 (1983)
- [4] Bahcall N.A., Cen R., ApJ, 398, L81 (1992a)
- [5] Bahcall N.A., West M.J., ApJ, 392, 419 (1992b)
- [6] Clowe D., Luppino G.A., Kaiser N., Henry J.P., Gioia I.M., astro-ph/9801208
- [7] Croft R.A.C., Dalton G.B., Efstathiou G., Sutherland W.J., Maddox S.J., astro-ph/9701040
- [8] Donahue M., Voit G.M., Gioia I., Luppino G., Hughes J.P., Stocke J.T., excepted by ApJ (1998), also astro-ph/9707010
- [9] Efstathiou G., Dalton G.B., Sutherland W.J., Maddox S.J., MNRAS, 257, 125 (1992)
- [10] Evrard A., and the Virgo Consortium (in preparation)
- [11] Jenkins A., Frenk C.S., Pearce F.R., Thomas P.A., Colberg J.M., White S.D.M., Couchman H.M.P., Peacock J.A., Efstathiou G.P., Nelson A.H. (The Virgo Consortium), ApJ, 499, 20 (1998)
- [12] Luppino G.A., Kaiser N., ApJ, 475, 20 (1997)
- [13] Mo H.J., White S.D.M., MNRAS, 282, 347 (1996)
- [14] Peacock J.A., West M.J., MNRAS, 259, 494 (1992)