Letter to the Editor
ORFEUS II echelle spectra :
Absorption by H2 in the LMC††thanks: Data obtained under the
DARA guest observing program in the ORFEUS II Mission
Abstract
We report the first detection of H2 absorption profiles of LMC gas on the line of sight to star 3120 in the association LH 10 near the emission nebula N 11B. Transitions found in the Lyman band are used to derive a total column density H cm-2. Excitation temperatures of K for levels and of K for levels of H2 are derived. We conclude that moderate UV pumping influences the population even of the lowest rotational states in this LMC gas.
Key Words.:
Space vehicles - ISM: molecules - Galaxies: ISM - Magellanic Clouds: LMC - Stars: individual: LH 10:3120 - Ultraviolet: ISM1 Introduction
The last instrument capable of high resolution spectroscopy in the 900-1200 Å range was the Copernicus satellite (Spitzer et al. 1973), working in the 1970s. This part of the spectrum contains absorption transitions of the Lyman and Werner Bands of molecular hydrogen, H2, and of transitions of O vi and other species highly relevant for interstellar medium studies.
The ORFEUS (Krämer et al. 1990) and IMAPS (Jenkins et al. 1988) experiments on the ASTRO-SPAS space shuttle platform has provided access to the far UV spectral range in great detail. The ORFEUS telescope feeds two spectrographs. The Heidelberg-Tübingen echelle gives spectra from 912 to 1410 Å with which are recorded with a microchannel plate detector. Good S/N is achieved in exposure times of the order of 1 hr of hot objects with mag (Krämer et al. 1990). The UCB spectrograph produces spectra over the range of 390 to 1220 Å (Hurwitz et al. 1998) with a resolution too low for detailed interstellar work. IMAPS has its own telescope, works at between 970 and 1195 Å, and is in overall sensitivity limited to galactic studies (see e.g. Jenkins & Peimbert 1997).
Here we report on the detection at high spectral resolution of H2 in the spectrum of the LMC star LH 10:3120. The star, located in the association LH 10 near the western edge of the LMC, is of spectral type O5.5Vf, has mag and mag (Parker et al. 1992). The star was selected because of its very early spectral type, modest extinction (too large extinction would make the far-UV undetectable), and its proximity to an area where the molecule CO has been found in emission (Cohen et al. 1988; Israel et al. 1993).
The presence of H2 in the LMC is known since Israel & Koornneef (1988) detected the near-IR emission lines from radiatively excited H2 seen toward H ii regions near hot stars. Measurements showed that H2 is abundantly available, both in the SMC (Koornneef & Israel 1985) and in the LMC (Israel & Koornneef 1991a, 1991b). Clayton et al. (1996) detected with HUT at 3 Å resolution broad depressions in the far-UV spectrum of two LMC stars, which could be fitted with H2 absorptions due to (H2) 1-2 cm-2. Studies of H2 in the LMC and SMC are of importance because of the lower metal content of these galaxies compared to the Milky Way and the different gas to dust ratios (see Koornneef 1984).
2 Observations, data handling
The total observing time for LH 10:3120 in the ORFEUS space shuttle mission of Nov./Dec. 1996 was 6000 s in 3 pointings exploiting the integrating capabilities of the microchannel plate detector system. A detailed instrument description and information about the basic data reduction is given by Barnstedt et al. (1998). The data reduction for the 20 echelle orders has been performed by the ORFEUS team in Tübingen. The spectrum has been filtered by us with a de-noising algorithm basing on a wavelet transformation (Fligge & Solanki 1997). This leads to a slight degradation of the spectral resolution, now being equivalent to km s-1. The spectra have a signal-to-noise (S/N) of at the longer wavelengths of the recorded spectral range. Toward the shorter end of the spectral range, both the increased effect of the UV-extinction as well as the wavelength dependent sensitivity of the instrument leads to a reduction in S/N such, that little can be done with the spectrum at Å. After the filtering absorption features in the longer part of the spectrum become clearly visible.
| Rotation | -value | Number of | |
|---|---|---|---|
| level | [cm-2] | [km s-1] | lines used |
| 0 | 18.65 | 5 | 2 |
| 1 | 18.10 | 5 | 5 |
| 2 | 17.70 | 5 | 3 |
| 3 | 17.50 | 5 | 3 |
| 4 | 16.70 | 5 | 3 |
We first inspected spectral ranges almost devoid of atomic absorption lines and where only few H2 absorptions are expected. The reason for this is to avoid getting confused in the search for H2 by the complexity of the absorption line profiles on the line of sight to the LMC. Yet, the characteristic pattern of absorption by the Milky Way disk near 0 km s-1, by the LMC near +270 km s-1, and possibly by high-velocity clouds near +60 and +130 km s-1 all known from IUE (see Savage & de Boer 1979, 1981; de Boer et al. 1980) and HST (Bomans et al. 1995) spectra, helps to identify the absorption structures.
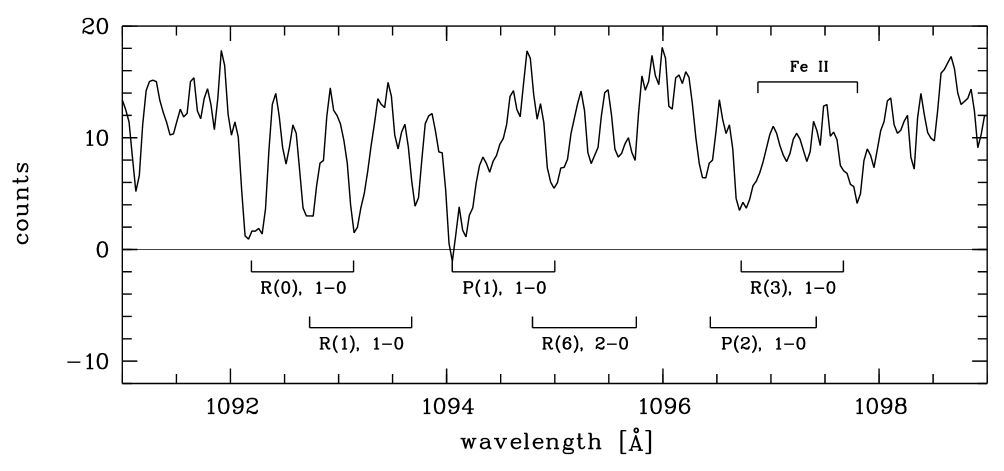
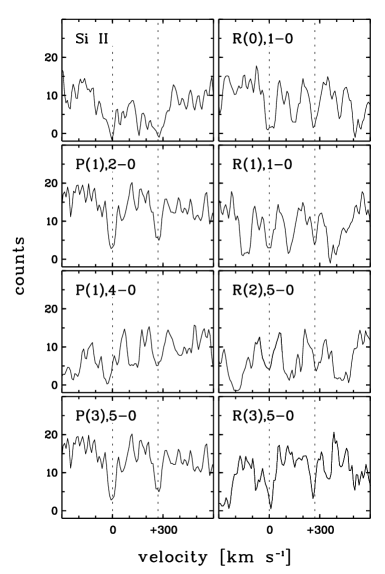
A section of the echelle order 51, where several H2 aborption lines have been found, is shown in Fig. 1. Many of the H2 profiles overlap in their 300 km s-1 wide profile structure and decompositions are not always possible. However, in some cases the galactic absorption stayed unblended, in other cases the LMC portion was blend free. For this first analysis we took 16 H2 absorption lines from the lowest 5 rotational states for the further analysis. These lines are essentially free from any blending problems so that wrong identifications can be excluded. Absorption strengths could thus be determined for the LMC components seen in these absorption profiles. A selection of characteristic H2 absorption line profiles in velocity scale (LSR) is shown in Fig. 2.
3 H2 column density in the LMC gas
The absorption profiles have been analysed and decomposed into the various velocity components. Here we limit ourselves to the absorption pertaining to the LMC. For each line the absorption equivalent width has been determined. The -values for the further analysis have been taken from Morton & Dinerstein (1976) for the H2 transitions and for the atomic absorption lines from the compilation of Morton (1991). Theoretical Voigt profiles were fitted to some of the identified H2 absorption lines and we thus could derive an upper limit for the velocity dispersion of km s-1 for the LMC gas.
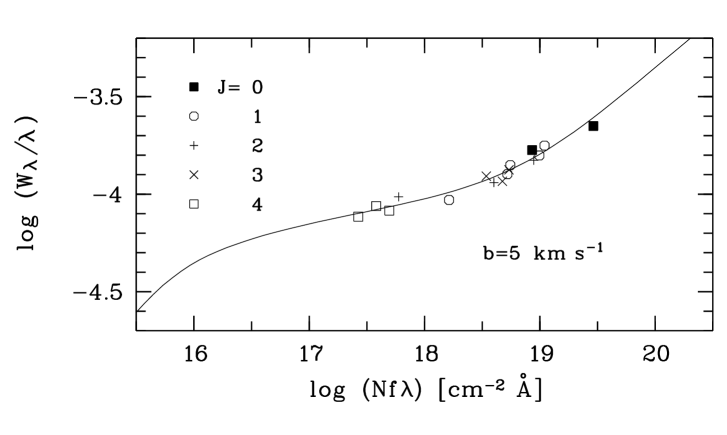
Subsequently, curves of growth have been constructed for each of the absorptions by the 5 rotational states for the LMC component. The logarithmic equivalent widths for each rotational level have been shifted horizontally to give a fit to a theoretical single cloud curve of growth as a function of log . The best fit for all 5 rotational states was obtained with km s-1 as shown in the empirical curve of growth for all identified H2 lines (Fig. 3). The column densities derived in this way have been collected in Table 1. The uncertainties in the column densities are based on the quality of the fits to the curve of growths. They range from 0.2 to 0.4 in the logarithm, as shown in Fig. 4. The total column density for the lowest 5 rotational states is (H2) cm-2.
4 Interpretation
4.1 Excitation state
To explain the column densities and the relative population of the rotational states of the H2 molecule we have to determine the mechanism which is responsible for the excitation of the molecular gas on our line of sight. Two processes dominate the population of the excited states, collisional excitation and pumping by UV photons (Spitzer & Zweibel 1974). With the column densities for the individual rotational states we were able to determine the excitation temperature for the LMC gas for . In Fig. 4 the LMC column densities divided by their statistical weight are plotted against the excitation energy . The equivalent excitation temperature of the gas can be derived by fitting theoretical population densites from a Boltzmann distribution. For we derive an equivalent excitation temperature of 470 K.
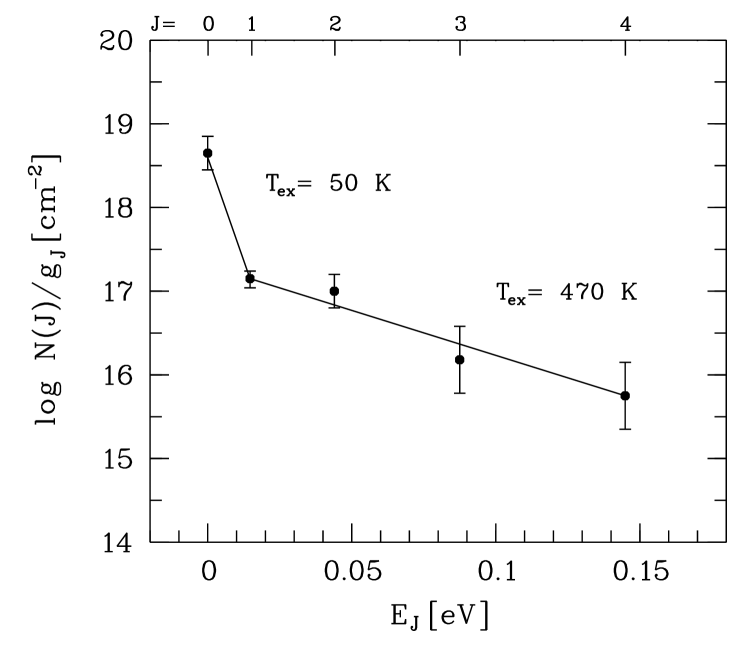
The plot of Fig. 4 shows also that the level lies above the linear relation of 470 K. Thus at least the level is populated through kinetic excitation. Fitting the Boltzmann relation to the and 1 column densities we find a kinetic temperature of 50 K. Clearly, the population of level is due to gas with a temperature K. Such very low gas temperatures have also been found by Dickey et al. (1994) and by Marx-Zimmer et al. (1998) in the LMC through analysis of H i 21 cm absorption.
Israel & Koornneef (1988) looked for emission by H2 in the direction of N 11. They report a marginal detection of H2 in the 1-0 line at a position very close to our line of sight. However, given the difference in direction as well as the low significance of the emission detection a connection with our absorption will be speculative. Also, the emission may be from gas more distant than the star.
4.2 Particularities of the line of sight
Our line of sight through the LMC is ending at the star LH 10:3120. The association LH 10 ionizes the H ii region N 11B, the northern H ii clump of the N 11 superbubble complex. The central superbubble is apparently created by the association LH 9 and is filled with hot gas. Several more patches of hot gas, partly coinciding with filamentary H shells, exist. The one X-ray patch coinciding with N 11B hints at wind driven bubbles around some massive stars inside N 11B (Mac Low et al. 1998). While N 11B indeed shows first signs of the local effects of its most massive stars (Rosado et al. 1996), it is still a relatively unevoled H ii region without large-scale expansion. Our line of sight is therefore most likely illuminated by the stars of LH 10. With the relatively unevolved nature of N 11B it is tempting to relate the H2 absorbing gas with the remainder of the cold molecular cloud which formed N 11B.
4.3 Comparison with galactic gas
The total column density found in the LMC can be related to the properties of the H2 gas in the Milky Way. The extinction to LH 10:3120 is . Taking out the galactic forground extinction of (Parker et al. 1992), one has extinction in the LMC of . The total H2 column density in the LMC is, compared to Milky Way gas (see Fig. 4 of Savage et al. 1977), slightly on the low side for its extinction. The smaller dust to gas content of the LMC (compared to the Milky Way; see Koornneef 1984) may have influenced the H2 to ratio by way of a lower H2 formation rate.
The excitation level of the higher levels on the line of sight to LH 10:3120 is equivalent to K. Such values are also found for the higher rotational states in galactic gas (Snow 1977; Spitzer et al. 1974). The environment of N 11B has contributed to the UV pumping but not in an excessive way. The excitation of the lowest level indicates the gas is kinetically cold.
5 Concluding remarks
Our investigation of the ORFEUS far UV spectrum shows for the first time well resolved absorption profiles due to H2 in LMC gas. The derived column densities and excitation temperatures toward LH 10:3120 demonstrate that UV pumping also takes place in LMC gas. The detected H2 has a column density and an excitation state similar to that of Milky Way gas, even though the line of sight runs through an energetic environment. In closing we note that H2 has also been detected in absorption by ORFEUS in the SMC (Richter et al. 1998).
Acknowledgements.
We thank the Heidelberg-Tübingen team for their support and the data reduction at the instrumental level. We thank in particular H. Widmann for helpful discussions. ORFEUS could only be realized with the support of the German and American colleagues and collaborators. The ORFEUS project was supported by DARA grant WE3 OS 8501, WE2 QV 9304 and NASA grant NAG5-696. PR is supported by a grant from the DARA (now DLR) under code 50 QV 9701 3.References
- (1) Barnstedt J., Kappelmann N., Appenzeller I., et al., 1998, A&AS, subm.
- (2) Bomans D.J., de Boer K.S., Koornneef J., Grebel E.K., 1996, A&A 313, 101
- (3) Clayton G.C., Green J., Wolff M.J., et al., 1996, ApJ 460, 313
- (4) Cohen R.S., Dame T.M., Garay G., Montani J., Rubio M., Thaddeus P., 1988, ApJ 331, L 95
- (5) de Boer K.S., Koornneef J., Savage B.D., 1980, ApJ 236, 769
- (6) Dickey J.M., Mebold U., Marx M., Amy S., Haynes R.F., Wilson W., 1994, A&A 289, 357
- (7) Fligge M., Solanki S.K., 1997, A&AS 124, 579
- (8) Hurwitz M., Bowyer S., Bristol R., et al., 1998, ApJ 500, L 1
- (9) Israel F.P., Koornneef J., 1988, A&A 190, 21
- (10) Israel F.P., Koornneef J., 1991a, A&A 248, 404
- (11) Israel F.P., Koornneef J., 1991b, A&A 250, 475
- (12) Israel F.P., Johansson L.E.B., Lequeux J., et al., 1993, A&A 276, 25
- (13) Jenkins E.B., Peimbert A., 1997, ApJ 477, 265
- (14) Jenkins E.B., Joseph C.L., Long D., et al., 1988, Proc. SPIE, 932, p. 213
- (15) Koornneef J., 1984, in IAU Symp.108, ‘Structure and evolution of the Magellanic Clouds’, eds. S. van den Bergh & K.S. de Boer; Reidel, Dordrecht, p. 333
- (16) Koornneef J., Israel F.P., 1985, ApJ 291, 156
- (17) Krämer G., Barnstedt J., Eberhard N., et al., 1990, in IAU Coll. 123, ‘Observatories in Earth Orbit and beyond’, ed. Y. Kondo, Kluwer, p. 177
- (18) Mac Low M.-M., Chang T.H., Chu Y.-H., Points S.D., Smith R.C., Wakker B.P., 1998, ApJ 493, 260
- (19) Marx-Zimmer M., Herbstmeier U., Dickey J.M., Zimmer F., Staveley-Smith L., Mebold U., 1998, A&A, submitted
- (20) Morton D.C., 1991, ApJS 77, 119
- (21) Morton D.C., Dinerstein H.L., 1976, ApJ 204, 1
- (22) Parker J.W., Garmany C.D., Massey P., Walborn N.R., 1992, AJ 103, 1205
- (23) Richter P., Widmann H., de Boer K.S., et al., 1998, A&A, Letter, subm.
- (24) Rosado M., Laval A., Le Coarer E., Georgelin Y.P., Amram P., Marcelin M., Goldes G., Gach J.L., 1996, A&A 308, 588
- (25) Savage B.D., de Boer K.S., 1979, ApJ 230, L 77
- (26) Savage B.D., de Boer K.S., 1981, ApJ 243, 460
- (27) Savage B.D., Bohlin R.C., Drake J.F., Budich W., 1977, ApJ 216, 291
- (28) Snow T.P., 1977, ApJ 216, 724
- (29) Spitzer L., Zweibel E.G., 1974, ApJ 191, L 127
- (30) Spitzer L., Drake J.F., Jenkins E.B., Morton D.C., Rogerson J.B., York D.G., 1973, ApJ 181, L 122
- (31) Spitzer L., Cochran W.D., Hirschfeld A., 1974, ApJS 28, 373
- (32)