The Extinction Distribution in the Galaxy UGC 5041
Abstract
We probe the dust extinction through the foreground disk of the overlapping galaxy pair UGC 5041 by analyzing B,I, and H band images. The inclined foreground disk of this infrared-selected pair is almost opaque in B at a projected distance of kpc. From the images, we estimate directly the area-weighted distribution of differential near-IR extinction: it is nearly Gaussian with and . For a homogenous dust distribution and a Milky Way extinction curve, this corresponds to a face-on distribution p with a mean of and . For a clumpy dust model the optical depth estimate increases to and . Even though the galaxy pair is subject to different selection biases and our analysis is subject to different systematics, the result is consistent with existing case studies, indicating that is generic for late-type spirals near their half-light radii.
We outline how to estimate from p by how much background quasars are underreresented, where projected within kpc of nearby spirals, such as damped Ly- absorbers or gravitational lenses; from our data we derive a factor of two deficit for flux-limited, optical surveys.
1 Introduction
The disks of spiral galaxies contain enough dust to affect significantly the UV and optical radiation from the stars within the galaxy and from any sources behind them (see e.g., Davies and Burstein, 1992, for an overview). The effect of dust extinction on the emerging spectral energy distribution at m can be subtle, even if large quantities of dust are present (e.g., Phillipps et al. 1992, Witt et al. 1992, Rix 1995), and depends strongly on the relative layering of the stars and the dust, and the small-scale clumping of the dust. The impact of dust extinction on both the colors of the galaxy itself and on the statistical extinction and reddening of background sources depends also on the small scale clumping of the dust (e.g., Witt and Gordon, 1996; Berlind et al. 1997, hereafter B97) and on its concentration towards the spiral arms (White and Keel, 1992, hereafter WK92; Keel and White 1995).
Even though galaxy disks (and their associated dust) may cover only a few percent of the sky to redshifts , they affect particularly interesting lines-of-sight. For example, the true rate of damped Ly- systems depends sensitively on the degree to which the detectability of the QSO (usually in the optical) is affected by potential dust extinction in the absorber (Bartelmann and Loeb, 1996). Similarly, the incidence of multiple gravitational images and of lensing magnification caused by disk galaxies may be altered by the presence of dust that may prevent the cataloging of the source (Rodrigues-Williams et.al. 1994; Boyle et.al. 1988).
Measuring the optical depths of spiral disks is most straightforward with background light sources, because the influence of dust scattering is minimized, leaving only extinction. However, background point sources are insufficient to study the spatial structure of dust extinction. Keel (1983) and White and Keel (1992) pioneered a technique to map the extinction distribution in a galaxy, by analyzing the light distribution of a background galaxy shining through it. Using three pairs of galaxies, they found that in these systems the face-on B-band extinction near the spiral arms was , and in the interarm-regions.
As the results of such an extinction analysis depend on the objects chosen, the radial range probed, the available spatial resolution and the wavelengths of observation, it is important to increase the number of case studies and employed techniques to arrive at a coherent and comprehensive picture of dust extinction in spiral galaxies. Here we present an analysis of the projected galaxy pair UGC 5041, following the approach of WK92. The forground galaxy is a highly inclined Sc at km/s, with a background galaxy at km/s, whose center is projected at a mean distance of (or ) from UGC 5041’s center.
We decided to present another case study, to complement the existing small set of studies already in the literature (WK92 and B97), because the particular galaxy pair, the observations and analysis differ in several relevant aspects:
-
•
The background galaxy behind UGC 5041 was found only in Hm) images (Gary Bernstein, priv. conv.); it is completely obscured in the B-band. Hence, the galaxy pair is subject to different selection biases than optically selected pairs and has the potential to yield an optical depth estimate of .
-
•
Given the relatively small projected separation () and qualitatively high optical depths (see also NGC 3314, Keel 1983), our analysis is based solely on near-IR observations ( and ).
-
•
From the observations we calculate the area-weighted optical depth distibution, p, near the half-light radius of the foreground disk. This is the most immediately relevant quantity for assessing the extinction statistics of background sources.
-
•
We apply the derived p to explore the under-representation of QSOs lensed by spiral galaxies and of QSOs with low redshift damped Ly- absorption.
The paper is organized as follows. In §2 we describe the data reduction and analysis. In §3 we describe the estimates of the optical depth distribution and its errors; in §4 we discuss the implications of this estimate and in §5 we present the conclusions.
2 Observations and Reductions
2.1 Observations and Initial Reduction
The H-band (1.6m) images were taken on September 19, 1996 at the 2.3m Bok telescope on Kitt Peak using the 256x256 IRcam with a scale of /pixel. Bias and dark frames were obtained at the beginning of the night. The data were taken by integrating on the object for 60 seconds, shifting to the sky ( off-set) for 60 seconds, then returning to the galaxy and repeating the procedure. Each telescope dither was to a slightly different part of the sky near the object. The total integration time on the galaxy pair was 3600 sec (60 object-sky image pairs). In the subsequent analysis, eleven of the final images were discarded, because crucial portions of the image were corrupted by bad pixels.
Most of the data reduction was carried out with IRAF111 IRAF is distributed by the National Optical Astronomy Observatories, which are operated by AURA, Inc., under cooperative agreement with the National Science Foundation.. The bias and dark frames were subtracted from all galaxy and sky frames. Subsequently, the two sky flats bracketing an object image were averaged, normalized and used to flatfield the interleafing galaxy image. The resulting images were then aligned using the foreground galaxy center and co-added.
Reduced and flux-calibrated I-band(7800Å) and the B-band(4400Å) CCD images of UGC5041 were kindly provided by Gary Bernstein. They were originally taken on February 27 and 29, 1992, respectively, at the 2.3m Bok telescope on Kitt Peak. Since the optical images had different pixel scales (0.3′′/pixel), the H-band image need to be de-magnified and aligned. All photon-noise and flux-calibration errors were propagated throughout these steps, but in the end found to be negligible compared to the systematic modeling uncertainties discussed below.
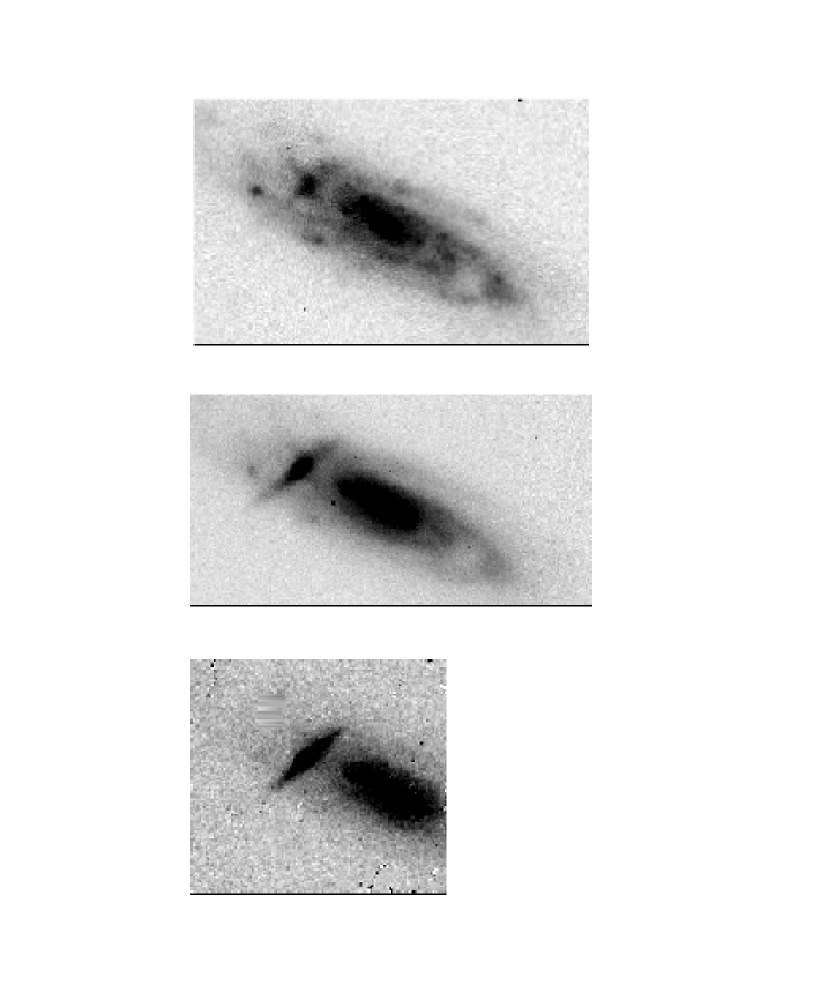
Figure 1 shows the resulting images in B, I and H. It is apparent that in the B-band the extinction is high, for the most part obscuring the background galaxy. Only one bright region is shining through (in the upper left part of the foreground galaxy), explaining why this galaxy pair was never found in optical surveys222It was found serendipidously by G. Bernstein in a low resolution H-band image.. Qualitatively, the I-band image hints at , as the dust extinction is obvious, but not overwhelming. The rightmost panel of Figure 1 shows that dust extinction effects in the H-band are subtle. However, we do not neglect the H-band extinction.
2.2 Estimates of
With the three images aligned, scaled, and flux-calibrated we can proceed to estimate the optical depths in the foreground galaxy. The recorded images are composed of light from the foreground galaxy and of attenuated light from the background galaxy. The equation for radiative transfer in this case is simply (see also WK92)
| (1) |
where denotes the wavelength of the observations, and x the image position. Since the extincted source is well behind the extincting dust we neglect scattering into the line of site. From Eq.(1) one can see that as a first step we must subtract the foreground galaxy light, , at each wavelength in the region where the two galaxies overlap. Since the edge-on background galaxy is an almost linear feature, an estimate of the foreground galaxy light was made by interpolating the adjacent foreground light across it. This fit was then subtracted from the overlapping region, and the associated errors were an important source of uncertainty in the final optical depth determination. Indeed, the HII regions and the spiral arms in the foreground galaxy rendered the B-band image too irregular to get an accurate estimate for the fit. Therefore, the B-band data was not used in the subsequent analysis. The H-band image on the other hand, had little error in subtracting out the foreground light, because the foreground galaxy contributed little to the light in the overlapping region to begin with. To get an independent error estimate for we analyzed the opposite side of the foreground galaxy, where there are no over-lapping galaxies, and carried out the same interpolation. The residuals provide us with an accuracy estimate of in I for the foreground subtraction.
Next the corrected background light, , should be divided by an estimate of its unextincted value, , to solve for . Although direct estimates of are unknown, because we cannot neglect the foreground extinction even in the H-band. Fortunately, the intrinsic I-H color of highly inclined disk galaxies is quite uniform. For example, Bernstein et al (1994) find I-H=1.880.08 magnitudes for their sample of 21 spirals, with 2 outlier galaxies that are bluer by 0.4 magnitudes than the mean. Hence, we have a very good guess of the background galaxy’s color in absence of the foreground galaxy. By dividing the observed I-H flux ratio by the un-extincted, or intrinsic, value, we can estimate directly via
| (2) |
To obtain a well defined map of we created a mask that isolated the image regions of significant background galaxy flux in H. The pixel values in the masked ratio-image can then be converted into a histogram of , which is shown in Figure 2. Our data span a range of kpc in the plane of the foreground galaxy, but no systematic radial variation of the extinction was found.
Uncertainties in the optical depths were calculated by standard propagation of errors (Bevington 1992), accounting for the foreground subtraction and the intrinsic color ratio variance. Intrinsic color ratio errors contributed 0.1 to , and the error contribution from the subtraction depended on . The final median error in was found to be 0.13.
3 Analysis
3.1 Estimating
Our data provide a direct estimate of the differential extinction probability distribution . For broader applications it would be useful to correct this value to face-on and to convert it to estimates of . The radial range( to kpc) covered by our estimate of p is quite limited, but of particular interest. First, because damped Ly- absorbers have sizes kpc (Briggs et. al. 1989). Second, because the Einstein ring radius for distant galaxies is kpc(e.g. Schneider et. al. 1992). As a first step and benchmark, we estimate by assuming an extinction curve, , similar to the Milky Way’s, (e.g. Mathis, 1990). Under this assumption the face-on value of is given by
| (3) |
where (Mathis 1990). The inclination angle, i, of the foreground galaxy was found by fitting isophotes. Assuming an edge-on axis ratio of 0.19 for UGC 5041’s stellar disk we find an inclination angle of ; the inclination error turned out to be negligible in the subsequent analysis.
A pixel-to-pixel histogram of the face-on optical extinction, , derived under these assumptions is shown in Figure 3. The distribution of the face-on is approximately Gaussian with , and a variance of .
3.2 Patchy Extinction Models
In converting to we assumed so far that the extinction curve in the foreground galaxy was similar to the Milky Way’s. However, the IR extinction was derived over an extended region of the foreground galaxy, as each pixel subtends on a side at a distance of Mpc. Casual inspection of nearby galaxy images and quantitative studies (see e.g., Witt and Gordon, 1996; WK92, B97) make it clear that the dust is quite clumpy on much smaller scales. In this section we investigate how much dust inhomogeneities affect our estimates of p() by using a simple model to derive an effective coefficient, , for clumpy extinction.
Following B97 we consider an area A in the foreground galaxy, covered by one pixel, within which a fraction is covered by material with an times greater extinction curve than the rest of the area. The incoming intensity , emerges as , averaged over the area A:
| (4) |
Carrying out the integration and denoting
| (5) |
where,
| (6) |
gives . In Eq. 6 is the mean V extinction , equal to 0.34, derived in §3.1. If is set to zero in Eq. 6 then the measured, or effective, extinction will be equal to the mean. Qualitatively the situation differs most for , where we obtain
| (7) |
for a ratio of optical depths, X . Very similar estimates for have been derived empirically by B97 (their Figure 3). The histogram for , the clumpy extinction case, is shown by the dotted lines in Figure 2. The mean extinction in V has increased from 0.34 to 0.41, with a commensurate increase of the dispersion. Note, that the mean has changed by more than the measurement errors. Therefore, the assumed extinction curve is the dominant of uncertainty in our analysis.
4 Discussion
4.1 Comparison With Other Authors
Optical depths through galaxy disks have been derived several ways by different authors (Keel 1983, Keel and White 1995, James and Puxley 1995, B97). Each analysis had to rely on different sets of assumption, such as intrinsic galaxy symmetry (WK92, B97), case B recombination ratios for Balmer lines (James and Puxley 1995), and intrinsic near-IR colors of galaxies (this paper). It is interesting to explore to which extent the results are impacted by the different techniques.
James and Puxley (1995) found quite high extinction values from analyzing H/H ratios, seen though the center of NGC3314. These values could be due to the small impact parameters of the probed lines of sight, or because the extinction intrinsic to the HII regions has been under-corrected.
WK92 and B97 have estimated extinction by broad-band photometric methods, WK92 using CCD data, B97 using data that extend to m. Referring all extinction values to face-on and the B-band, we find a mean of for UGC 5041 at using our clumpy model, which has an effective extinction curve similar to B97. Keel and White (1995) list at somewhat larger radii, and B97 find in an inter-arm region at . B97 also find in the dust-lanes near the arms, for which detailed case studies of nearby galaxies (e.g., Elmegreen 1980 and Rix and Rieke 1993) have already shown that .
Even though we have analyzed a purely infrared-selected pair of galaxies, and have based our analysis on near-IR data, it appears that our results are quite consistent with the optical analyses, implying that the basic result of semi-transparent disks is not simply a selection effect.
4.2 Implications For Cosmologically Distant Objects
As mentioned above, dust in foreground galaxies will dim and redden distant background objects, such as QSOs, that appear in close projection. On the other hand, the mass concentration associated with the intervening galaxies may brighten the background source through gravitational lensing (Hutchings 1990; Bartelmann et. al. 1996). Hence the observed incidence rate of close alignments between background sources and foreground galaxies depends on the competition between the two effects.
Here we show how to use to estimate the first effect, focusing on optically selected quasars that lie within kpc of galaxies, such as QSOs lensed by spiral galaxies, or QSOs with low-redshift damped Ly- absorbers. The radial range( to kpc covered by our estimate of p is quite limited, but of particular interest. First, because damped Ly- absorbers have sizes kpc (Briggs et. al. 1989). We take from Peterson (1997, p. 174) the integrated number–magnitude relation for quasars brighter than :
| (8) |
For objects whose light passes through a foreground galaxy, the magnitude limit of any survey is effectively , where is the optical depth at the wavelength of the survey. Given a probability distribution we would expect such sources to be under-represented by a factor of:
| (9) |
As Figure 3 shows is well approximated by
| (10) |
which leads to
| (11) |
For the derived values of and , and , , this results in and , respectively.
Hence the chance of finding lensed of damped Ly- absorbed quasars (with ) in such close projection ( kpc) to spiral disks is suppressed by about a factor of two due to dust extinction, in good agreement with the independent estimate based on the Milky Way gas-to-dust ratio by Perna, Loeb and Bartelmann (1997).
5 Conclusion
We have presented and analyzed H, I and B band images of the projected galaxy pair UGC 5041, in order to explore the distribution of dust extinction that light suffers while crossing the highly inclined foreground galaxy disk. This galaxy pair is completely obscured in the optical, and hence could have lead to ; this system also provides optical depth constraints at quite small impact parameters.
After removing the light contribution from the foreground galaxy, we compared, pixel by pixel, the observed I-H color of the (extincted) background galaxy to its expected intrinsic I-H color, which can be estimated to mag. This comparison resulted in a direct estimate of the distribution of , with . For a homogeneous dust distribution this translates into a face-on V-band optical depth of , for clumpy dust this corresponds to , with dispersion of and in .
Despite the different selection criteria (which would have permitted to arrive at much higher optical depths) and an analysis based solely on near-IR data, these optical depths are consistent with the values found by WK92 and B97, and corroborate that generically in nearby galaxy disks.
Using the derived distribution of , we estimated by how much quasars in close projection ( kpc) are under-represented in optically selected, flux-limited samples (), and found a deficit by a factor of two due to dust extinction.
As in many other analyses, the limited spatial resolution, which leads to averaging over areas of differing extinction is an important limitation. We are currently analyzing HST images of UGC5041 to repeat an analogous analysis at vastly improved spatial resolution.
We would like to thank Gary Bernstein for providing the CCD frames UGC5041. HWR was supported by an Alfred P. Sloan Fellowship.
References
- (1)
- (2) Berlind, A., Quillen, A., Pogge, R. and Sellgren, K., 1997, AJ, 114, 107 (B97).
- (3)
- (4) Bernstein, G. et al. , 1994, AJ, 107, 1962.
- (5)
- (6) Bartelmann, M., Loeb, A., 1996, ApJ, 457, 529.
- (7)
- (8) Bevington, P., Robinson, D.,1992 in Data Reduction And Error Analysis for the Physical Sciences,ed. S.J.Tubb,J.M.Morriss(McGraw-Hill,Inc.)p.43.
- (9)
- (10) Boyle, B. J., Shanks, T., 1988, MNRAS, 231, 897.
- (11)
- (12) Briggs, F., Wolfe, A., Liszt, H., Davis, M. and Turner, K., 1989 ApJ 341 650.
- (13)
- (14) Davies, J., Burstein, D. in The Opacity of Spiral Disks, Kluwer Academic Publishers, 1995.
- (15)
- (16) Elmegreen, D., 1980, ApJS, 43, 37.
- (17)
- (18) Hutchings, J.B., 1990, PASP, 102, 431.
- (19)
- (20) James, P., Puxley, P.1995, in The Opacity of Spiral Disks, ed. J.I.Davies, D.Burstein(Kluwer Academic Publishers)p.181.
- (21)
- (22) Keel, W.C., 1983, AJ, 86, 1579.
- (23)
- (24) Keel, W.C., White, R.E., 1995, in The Opacity of Spiral Disks , eds. J.I.Davies,D.Burstein, Kluwer, p.167.
- (25)
- (26) Mathis, J.S., 1990, ARAA, 28, 37.
- (27)
- (28) Perna, R., Loeb, A. and Bartelmann, M., 1997, ApJ, 488, 550.
- (29)
- (30) Peterson, B.M., 1997, in An Introduction to Active Galactic Nuclei, (Cambridge University Press, p.159.
- (31)
- (32) Phillipps, S., Evans, R., Davies, J. Disney, M., 1992, 253, 496.
- (33)
- (34) Rix, H.-W. and Rieke, M., 1993, ApJ, 418, 123.
- (35)
- (36) Rix, H.-W., 1994, in The Opacity of Spiral Disks, eds. J.I.Davies, D. Burstein, Kluwer, p.215.
- (37)
- (38) Rodrigues-Williams, L.L., Hogan, C., 1994, AJ, 107(2), 451.
- (39)
- (40) Schneider, P., Ehlers, J. and Falco, E., 1992, in Gravitational Lensing, Springer Verlag.
- (41)
- (42) White, R., and Keel, W.C., 1992, Nature, 359, 129 (WK92).
- (43)
- (44) Witt, A.N., Thronson, H.A., Capuano, J.M., 1992, ApJ, 393, 611.
- (45)
- (46) Witt, A.N. and Gordon, K., 1996, ApJ, 436, 681.
- (47)