HST/GHRS observations of AM Herculis ††thanks: Based on observations made with the NASA/ESA Hubble Space Telescope, obtained at the Space Telescope Science Institute, which is operated by the Association of Universities for Research in Astronomy, Inc., under NASA contract NAS 5-26555.
Abstract
We present phase-resolved spectroscopy of AM Herculis obtained with the HST/GHRS when the system was in a high state. The ultraviolet light curve shows a quasi-sinusoidal modulation, which can be explained by a hot spot on the rotating white dwarf. The broad absorption expected for photospheric radiation of a moderately hot white dwarf is largely filled in with emission. The UV/FUV spectrum of AM Her in high state can be quantitatively understood by a two-component model consisting of the unheated white dwarf plus a blackbody-like radiating hot spot. A kinematic study of the strong UV emission lines using Doppler tomography is presented. The characteristics of the low ionization species lines and the Si IV doublet can be explained within the classical picture, as broad emission from the accretion stream and narrow emission from the heated hemisphere of the secondary. However, we find that the narrow emission of the N V doublet originates from material of low velocity dispersion located somewhere between and the centre of mass. The high signal-to-noise spectra contain a multitude of interstellar absorption lines but no metal absorption lines from the white dwarf photosphere.
Key Words.:
Accretion – Line: formation – Stars: close binaries – Stars: individual: AM Her – Stars: white dwarfs – Ultraviolet: stars1 Introduction
In AM Herculis stars (see Warner 1995 for a monograph), three main sources of ultraviolet (UV) emission are present: the white dwarf photosphere, the illuminated accretion stream, and the heated secondary star. While the white dwarf contributes mostly in the continuum, the accretion stream and the heated atmosphere of the secondary star are sources of strong emission lines. Phase-resolved UV spectroscopy can, therefore, reveal details of the temperature structure on the white dwarf surface as well as kinematic information of the various emission regions within the binary system.
In a previous paper, we have reported phase-resolved UV observations of AM Her, obtained with IUE during both low and high states (Gänsicke et al. 1995; hereafter Paper 1). During both states, a modulation of the UV continuum flux, peaking at the phase of maximum hard X-ray flux, was detected. In the low state, this flux modulation is accompanied by an orbital variation of the broad absorption profile. The modulation of both continuum flux and absorption width can be explained with a moderately hot spot near the main accretion pole on the white dwarf. The spot temperatures estimated from the IUE data were K and K in the low state and the high state, respectively, with the spot covering of the white dwarf surface. The unheated regions of the white dwarf have K (Heise & Verbunt 1988; Paper 1). Considering that the sum of the observed hard X-ray flux and cyclotron emission roughly equals the UV excess flux of the spot, we concluded that irradiation by emission from the hot post-shock plasma is the most probable cause for the heating of the spot. A puzzling result from ORFEUS-I FUV observations of AM Her in high state was the absence of and absorption lines (Raymond et al. 1995). The poor resolution of the IUE data gave only limited evidence for the presence of a absorption line from the white dwarf photosphere during the high state, so that a full test of the hot spot-hypothesis had to await dedicated HST observations.
A general spectroscopic characteristic of polars in their high states are complexly structured emission lines. At least two components, a broad and a narrow one, can be identified. The common belief is that the broad component originates in the stream while the narrow component arises from the irradiated face of the secondary (e.g. Liebert & Stockman 1985). A beautiful example where three different line components can be discerned and identified with the secondary star, and the free-fall and magnetic coupled parts of the accretion stream is HU Aqr (Schwope et al. 1997). Doppler tomography reveals that the narrow line emission from the secondary in HU Aqr is asymmetric , probably due to shielding of the leading hemisphere by the accretion stream/curtain. In AM Her, broad and narrow components have been detected in various optical emission lines. Discussion has been stimulated by the fact that the individual lines differ in their radial velocity amplitudes: e.g. in He II, in He I (Greenstein et al. 1979) and in Ca I (Young & Schneider 1979). Absorption lines show even larger velocities: in Na I (Southwell et al. 1995). Hence, the narrow emission lines and the absorption lines originate on different parts of the secondary star, and interpreting their radial velocities as the velocity amplitude of the secondary star is ambiguous.
In this paper, we report the first high-resolution phase-resolved UV spectra of AM Herculis obtained with the Goddard High Resolution Spectrograph (GHRS) onboard the Hubble Space Telescope (HST).
2 HST/GHRS Observations
HST/GHRS observations of AM Her were carried out in January 1997 during a rare opportunity when the system was located in a continuous viewing zone of HST (Table 1). The total exposure time was slightly longer than the binary orbital period, min. At the time of the observations, AAVSO observations showed AM Her to be in a high state at . The GHRS spectra were taken in the ACCUM mode through the 2” Large Science Aperture (LSA). In order to cover both wings of the central wavelength was set to 1292 Å resulting in a spectral coverage of 11501435 Å with a nominal FWHM resolution of Å ( ). The spectra were acquired with a time resolution of 31.4 sec, corresponding to an orbital phase resolution of , with a net exposure time of 27.2 sec per spectrum. The observation was interrupted for min for a SPYBAL calibration, causing a gap in the phase coverage of . A total of 341 spectra were obtained.
| Dataset: | Z3DM0305T | Z3DM0308T |
|---|---|---|
| Exp. start (UT) | 2:03:453:56:15 | 4:01:525:48:45 |
| Exp. time (sec) | 5848 | 5413 |
| No. of spectra | 215 | 199 |
| Phase coverage () |
Regular monitoring observations with the GHRS/G140L grating have
revealed a slowly decreasing sensitivity below 1200 Å (Sherbert et
al. 1997). The response at 1150 Å was reduced in late 1997 by 15%
with respect to the sensitivity just after the Service Mission 1 in
December 1993. We therefore recalibrated our GHRS data of AM Her
with the calhrs routine of stsdas, using the
time-dependent flux calibration data given by Sherbert & Hulbert
(1997). We caution, however, that the absolute fluxes at the very blue
end of the spectra ( Å) may be still somewhat on
the low side (Sect. 3.4).
The mid-exposure times of the individual GHRS spectra were converted into magnetic orbital phases using the ephemeris determined by Tapia (see Heise & Verbunt 1988). The magnetic phases were subsequently converted into conventional binary orbital phases via the relation
| (1) |
The offset was obtained by comparison to the zero point in the optical ephemeris determined by Martin (1988; see also Southwell et al. 1995): corresponds to the inferior conjunction of the secondary. Note that the period given by Heise & Verbunt (1988) has a smaller error than that given by Southwell et al. (1995) and the former should preferably be used. Even though is historically used in the analysis of UV and X-ray light curves of AM Her, we adopt as the natural choice for the discussion of the geometry within the binary system. For convenience, light curves and radial velocity curves will be also labelled with .
3 Analysis and Results

3.1 Average spectra
The high spectral resolution and signal-to-noise (S/N) of the GHRS data reveals a multitude of hitherto unexplored details in the UV emission of AM Her. Two average spectra are shown in Fig. 1. They contain the typical emission lines of a polar in a state of high accretion rate, i.e. strong emission of the high excitation lines N V and Si IV along with weaker emission of lower ionization species, such as Si II, III and C II, III. The N V and Si IV doublets are fully resolved, displaying substructure in the form of broad and narrow components. Interestingly, the intensity of the narrow emission of N V varies only little as a function of the orbital phase, while the narrow emission of Si IV vanishes during orbital maximum. The lower ionization species, C II, III and Si II, III, do not display narrow emission at all, except for Si III 1206.5 which shows a weak narrow emission in the faint phase spectrum.
Overlayed on the continuum and line emission from AM Her are numerous interstellar lines. The very low airglow during part of the HST orbit allows the unmistakable detection of interstellar absorption. No obvious photospheric metal absorption lines from the white dwarf are visible. Note also that the broad absorption is almost completely filled in with emission, reminiscent of the missing and absorption lines in the ORFEUS-I FUV spectra of AM Her (Raymond et al. 1995).

3.2 Interstellar absorption lines
During parts of the HST orbit when the satellite was in the earth shadow, the geocoronal emission is significantly reduced, clearly revealing interstellar absorption in the spectra of AM Her. Earth-shadowed intervals occurred at and (Fig. 2), which allow us to determine the absorption column density during orbital minimum and maximum, i.e. when looking either at the unheated backside of the white dwarf or looking along the accretion funnel feeding the main pole, respectively. Paerels et al. (1994) found a small orbital variation of the absorption column density from EXOSAT grating data, ranging from during the soft X-ray faint phase to during the soft X-ray bright phase. This increase of is intuitively explained by the higher mass flow rate onto the active pole.
We fitted a pure damping Lorentzian profile (Bohlin 1975) folded with an 0.6 Å FWHM Gaussian to the observed absorption line. The resulting neutral column density is for both phases, somewhat lower than the value derived from X-ray observations, (van Teeseling et al. 1994; Paerels 1994; Paper 1). There is no evidence for a phase-dependent variation of the neutral hydrogen column density. The higher column densities determined from X-ray data indicate the presence of material along the line of sight, presumably within the binary system, in which hydrogen is ionized to a high degree while the other elements are only partially ionized and still contribute to the soft X-ray absorption.
Assuming an average gas-to-dust ratio (Shull & van Steenberg 1985), our value of translates into a limit on the reddening of . Considering this very low absorption, we use throughout the following analysis the observed data without correction for reddening.
The GHRS spectra of AM Her contain several interstellar absorption lines from low ionization species in addition to , among which the strongest are N I 1200 (an unresolved triplet), Si II 1260.4 (blended with S II 1259.5), O I 1302.2, Si II 1304.4 and C II 1334.5. The equivalent widths measured from the average spectra are mÅ, comparable to those determined for a small sample of cataclysmic variables at pc (Mauche et al. 1988). The centroids of the interstellar lines can be used to check on the quality of the wavelength calibration of the GHRS spectra, which we found to be good to .
In Paper 1, we found weak evidence for absorption of Si II 1260.4,1265.0 in IUE low state spectra of AM Her, presumably originating in the photosphere of the white dwarf. We stress that all metal absorption lines in the GHRS spectrum are of interstellar nature. This is underlined by the fact that only the blue component of Si II 1260.4 is detected; the red component is caused by a transition from an excited level which is not populated in the interstellar medium.

3.3 The observed continuum flux variation
In order to study the orbital modulation of the continuum flux, we have selected three wavelength bands free of emission lines: 11501167 Å (Band 1), 12541286 Å (Band 2), and 14121427 Å (Band 3). The continuum light curves obtained from averaging the phase-resolved GHRS spectra in these three bands display a quasi-sinusoidal modulation with the amplitude increasing towards shorter wavelengths (Fig. 3). Maximum UV flux occurs at , which is consistent with previous IUE observations of AM Her, during both the high state and the low state (Paper 1). The phase of the UV flux maximum agrees with that of the maximum hard X-ray flux (e.g. Paerels et al. 1994; Paper 1) and EUV flux (Paerels et al. 1995), indicating that the UV excess radiation originates close to the main accreting pole.
In Paper 1, we ascribe the observed orbital modulation of the UV flux to the changing aspect of a rather large, moderately hot spot on the white dwarf. We fitted white dwarf model spectra to phase-resolved IUE observations, obtaining a flux-weighted mean temperature and a mean source radius from each spectrum. During the low state, the flux variation is accompanied by a variation of the absorption profile width, which allows a reliable determination of the white dwarf temperature, K, and a good estimate for the spot temperature, K, and the spot size, of the total white dwarf surface. However, during the high state, the broad geocoronal emission and the unresolved N V profile are significantly blended in the region of the IUE spectra. The derived spot temperature and size, K and , remained, therefore, somewhat uncertain. The main conclusion of Paper 1 was that the flux emitted by the UV spot roughly equals the sum of thermal bremsstrahlung and cyclotron radiation, indicating that irradiation by the hot plasma in the accretion column may cause the heating of the large UV spot.


3.4 Simulated phase-resolved spectra and light curves
In order to constrain the temperature distribution over the white dwarf surface, we have developed a 3D white dwarf model which allows the simulation of phase-resolved spectra and light curves. The white dwarf surface is defined by a fine grid of several thousand elements of roughly equal area. Each surface element is assigned an effective temperature, allowing to prescribe an arbitrary temperature distribution over the white dwarf surface. For each surface element, a synthetic white dwarf spectrum with a corresponding effective temperature is selected from a library of model spectra computed with the atmosphere code described in Paper 1. Simulated phase-resolved spectra are obtained by rotating the white dwarf model and by integrating the flux at each wavelength over the visible hemisphere at a given phase. The main characteristics of the model spectra are (a) pure hydrogen composition, (b) no magnetic field, (c) , and (d) no irradiation.
The strong magnetic field of the white dwarf in polars is expected to prevent spreading of the accreted metal-rich material perpendicular to the field lines until the gas pressure equals the magnetic pressure, a condition which occurs far below the photosphere. In fact, there is no compelling observational evidence for the presence of heavy elements in the photosphere of the white dwarf in AM Her (Paper 1), so assumption (a) therefore appears justified111 This is in strong contrast to the situation in dwarf novae, where high metal abundances are derived from UV spectroscopy for the photospheres of the non-magnetic accreting white dwarfs (e.g. Long et al. 1993; Sion et al. 1995).. As long as only the continuum is used for fitting purposes, the weak Zeeman splitting of for MG (S. Jordan, private communication) and the change of the absorption profile with will not significantly affect the results. The critical point is (d): we assume that the spectrum of a white dwarf heated by irradiation resembles that of a somewhat hotter but undisturbed white dwarf. In what follows, we describe a simple model which accounts for the main characteristics of the data.

For the sake of simplicity, we chose a circular spot with an opening angle . The spot has a temperature distribution decreasing linearly in angle from the central value at the spot centre until meeting the temperature of the underlying white dwarf at . The centre of the spot is offset from the rotational axis by an angle the colatitude. Note that does not necessarily equal the colatitude of the magnetic pole, commonly designated . The centre of the spot is offset in azimuth by an angle , measured from the line connecting the centres of the two stars.
3.5 Fitting the observed light curve: Results and Caveats
We fitted simultaneously the observed light curves in Band 2 and 3 only. Because of uncertainties in the calibration of the absolute flux of the G140L spectra at the very short wavelengths (Sect. 2), Band 1 was not included in the fit. An evolution strategy algorithm (Rechenberg 1994) with 6 free parameters was used for the optimisation: the white dwarf temperature , the white dwarf radius , the maximum temperature of the spot , the opening angle of the spot , the colatitude , and the azimuth of the spot . Fixed parameters are the distance to AM Her, pc (Paper 1; Beuermann & Weichhold 1998), and the inclination of the system, (Davey & Smith 1996; Wickramasinghe et al. 1991).
The best-fit model results in K, cm, K, , and . The opening angle converts into a fractional spot area . The fit proved to be robust in , , and . However, the opening angle can be traded for the central temperature of the spot within certain limits (see below), because the continuum slope of the white dwarf model spectra approaches a Rayleigh-Jeans distribution for temperatures K and becomes independent of the temperature.
The simulated light curves in Bands 2 and 3 from the best fit are shown in Fig. 3. For completeness, Fig. 3 also compares the synthetic light curve in Band 1 with the observed one, showing that the model fluxes are somewhat too high. As noted above, this may be due to remaining imperfections in the absolute flux calibration of the GHRS/G140L setup at the shortest wavelengths. The white dwarf temperature derived from the HST light curves is in good agreement with the upper limit of 20 000 K based on IUE low state spectra (Heise & Verbunt 1988; Paper 1). The same is true for the temperature and the size of the spot, even though these are less well constrained. Smaller spots result in a flattening of the synthetic light curve in the range , as the spot eventually disappears entirely behind the limb of the white dwarf. A fit with e.g. K and , corresponding to , still yields a satisfying result. However, it is formally not possible to exclude even smaller spots with higher temperatures. Yet, even though not statistically significant (see below), the observed light curve is better fitted with a spot large enough not to be totally self-eclipsed, as the roundness of the observed light curve in the range is better reproduced. The temperature maps of the white dwarf surface resulting from the best fit are shown in Fig. 4.
A sample of simulated phase-resolved spectra along with the GHRS observations is shown in Fig. 5, clearly revealing the major shortcoming of our approach: the model predicts a deep and broad absorption line of , but the GHRS observations show only a rather shallow absorption. The most likely cause of this disagreement will be discussed in Sect. 4.1.
On close inspection, the observed light curves show a weak depression at . With an inclination and a colatitude of the spot centre , the line of sight is almost parallel to the accretion funnel at , and part of the hot spot will be obscured by the magnetic coupled part of the accretion stream. The weak absorption dip in the observed light curves may be due to this shadowing effect.
There are a number of caveats concerning our model for the UV light curve:
(a) A proper statistical assessment of the goodness of the fit is difficult: The statistical errors for each individual point (the standard deviation of the flux bins in the band divided by the square root of the number of bins) is very small. Hence, the scatter in the observed light curves (Fig. 3) has some underlying physical origin. This is not too surprising, as AM Her shows strong flickering on various timescales both at optical wavelengths (e.g. Panek 1980) and at X-rays (e.g. Szkody et al. 1980). We computed the mean scatter in the observed light curve by subtracting a light curve smoothed with a 30 point boxcar. Adopting the standard deviation of this mean scatter, which is in the different bands, as the mean error of the individual points, our best fit yields a reduced . Even though this is formally satisfying, a number of systematic uncertainties remain.
(b) We assume in our model that all the continuum flux originates from the heated and unheated surface of the white dwarf. This overestimates the white dwarf flux and, hence, its radius, as the illuminated accretion stream certainly contributes to the observed continuum flux. In Paper 1, we were able to quantify this continuum contribution thanks to the broad wavelength coverage of the IUE SWP and LWP cameras. The narrow wavelength band covered in the GHRS spectra does not allow a similar treatment, and we rely on the results from Paper 1, i.e. that the contribution of the accretion stream to the observed continuum is likely to be for Å. The light curves of the broad emission lines are shifted in phase with respect to the continuum flux (Sect. 3.7; Fig. 11), with maximum line flux occurring at . Therefore, the error introduced by neglecting the stream continuum contribution is largest during the faint phase, partially explaining the shallowness of the broad absorption at .
(c) The spot may not be circular. Modelling phase-resolved polarimetry, Wickramasinghe et al. (1991) find a cyclotron emitting region elongated by in magnetic latitude. However, unless the spot is significantly asymmetric, the ultraviolet light curves are not sensitive to the actual shape of the spot.
(d) A second active region offset by has been detected in polarimetry (Wickramasinghe 1991) and may contribute to the UV continuum flux during the faint phase. This would result in an overestimate of .
(e) The temperature distribution undoubtedly deviates from a linear gradient in angle. An indication that this is the case comes from the observed EUV flux of AM Her. Choosing K, as derived by Paerels et al. (1996), it is not possible to reproduce the observed ultraviolet modulation without exceeding the measured EUV flux. Assuming a linear decrease of the temperature with angle gives an upper limit K, and a lower limit .
3.6 Doppler Tomography
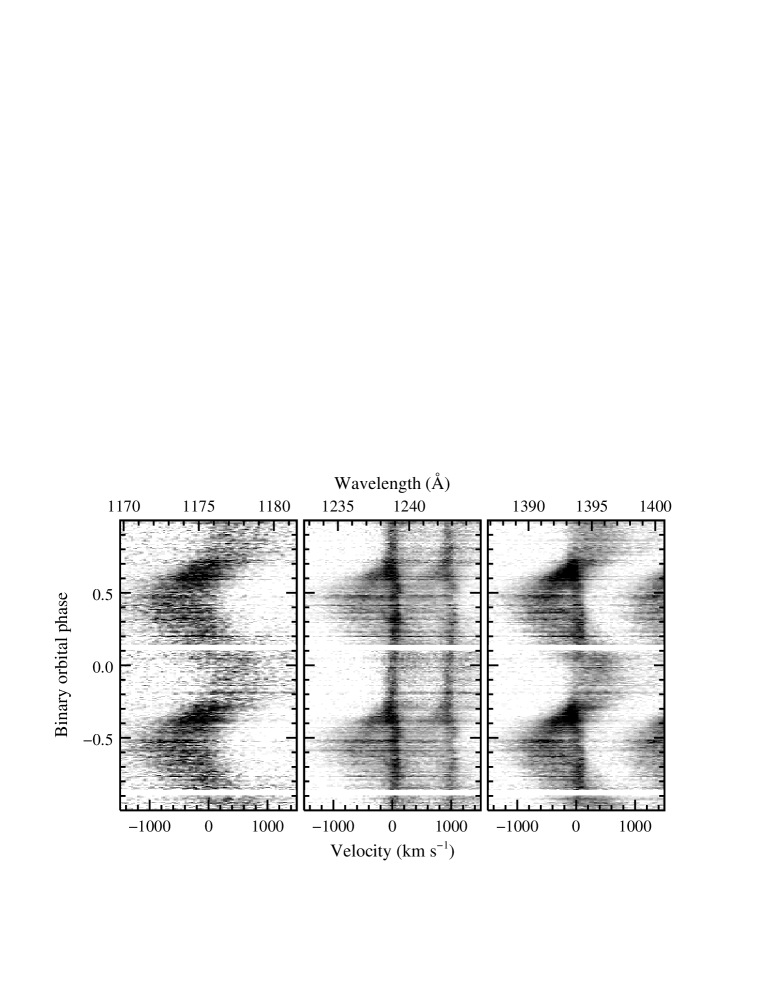
Figure 6 shows the trailed spectra of the C III 1176 line and the N V 1239, 1243 and Si IV 1394, 1403 doublet lines constructed by combining the 341 individual AM Her spectra, extracting narrow regions around the line centres, and subtracting the continuum by means of a third-order polynomial fit. In the doublet lines, the zero point of the velocity scale was set at the central wavelength of the blue doublet peak. Both a narrow and a broad emission component are clearly visible in the trailed spectra of the two doublet lines, while the C III line appears to contain only a broad component.
The trailed spectrum of the C III line shows a broad, weak S-wave with a full-width of and a maximum (edge-to-edge) amplitude of . The line intensity is strongest at orbital phases , and weakest at phases . Both of the doublet lines have trailed spectra displaying a broad S-wave component similar to the C III line, and a superimposed, narrow (full-width ), low amplitude ( ) S-wave component. As in the C III line, the doublet line intensities are strongest at , and weakest at . Other than the difference in blue and red component separation, the trailed spectra of the two doublet lines differ in one obvious respect: the narrow S-wave in the N V line is visible throughout the entire orbit at approximately equal strength (slightly weaker at ), but the narrow component of the Si IV line completely vanishes in the phase range 0.751.15.
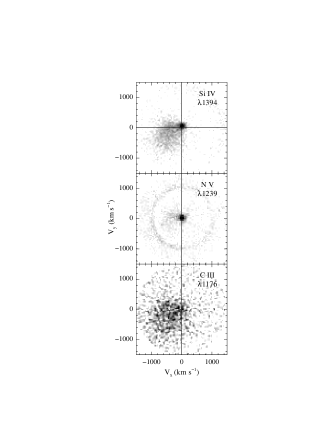
In order to construct Doppler tomograms from the data, the spectra were resampled onto a uniform velocity scale, and averaged into orbital phase bins of width . This resulted in 3–4 spectra combined into each phase bin, thereby increasing the signal-to-noise while preserving a high phase resolution. The tomograms were calculated using the Fourier-filtered back projection technique (e.g., Marsh & Horne 1988; Horne 1991). Figure 7 shows the tomograms of the C III line and the blue components of the N V (1239Å) and Si IV (1394Å) doublets. Tomograms for two other relatively strong emission lines in the UV spectrum of AM Her are not shown. The tomogram of the C II 1335 line, which lacks a narrow component, is qualitatively similar to that of the stronger C III line. The trailed spectrum of the Si III emission complex at Å (which also lacks a narrow component) is qualitatively similar to that of the C III line, and we would expect it to produce a correspondingly similar tomogram. However, the presence of two strong interstellar absorption features produced substantial artifacts in the Si III tomogram that prevent a direct comparison with the other lines.
The ring with a radius of visible in the N V tomogram is an artifact produced when the flux in the red peak of the doublet (which is located at a velocity offset of from the blue peak – see Figure 6) is smeared out around the tomogram. A similar artifact is observed when the Si IV tomogram is plotted to larger velocities (the doublet separation in Si IV, , is larger than in N V). The red halves of the doublet lines, as should be expected, yield tomograms identical in structure (above the noise) to the blue halves (although the former are somewhat weaker in overall intensity than the latter, as expected from the relative strengths of the doublet peaks, which are also weaker on the red side).


The Si IV tomogram contains two main emission regions: (1) a roughly circular area of strong emission located near the velocity origin, and (2) a broad “fan” of less intense emission emanating from the velocity origin and extending (primarily) into the quadrant of the tomogram. These emission regions can be directly attributed to the narrow and broad emission line components, respectively. The general location of the strong emission region is suggestive of an origin on or near the secondary star (see the figure in Horne 1991 comparing velocity and position coordinates in a CV) – we will explore this possibility further in Section 4.3. We used contours plotted at intervals of 5% of the peak intensity in the tomogram (not shown) to locate the centre of the strong emission region, at (with an uncertainty of in each coordinate). This emission is asymmetrically distributed relative to both velocity axes. The 70% peak contour extends from to and from to .
The fan-shaped emission component in the Si IV tomogram is most likely produced by the accretion stream of AM Her. The initial ballistic trajectory of the stream would produce emission at velocities starting at the point on the axis, and extending roughly parallel to the axis for some length before curving into the quadrant (e.g., see Horne 1991 and Figure 15), thus accounting for the weak emission above the axis in the quadrant (and, presumably, some continuing contribution along the outer edge of the fan). The remaining weak emission is produced by the range of observed radial velocities of the stream material once it is being channelled along the magnetic field lines (e.g., Schwope et al. 1995). As expected for a strongly magnetic CV like AM Her, there is no ring of emission indicative of a disc in the tomogram. There is also no apparent enhancement to the Si IV emission anywhere along the axis, where a contribution from the white dwarf would be located.


The N V tomogram of AM Her is similar in appearance to the Si IV tomogram. Again, a strong, compact emission region is present on the axis, and a weaker fan of emission extends to larger negative velocities. However, the fan emission is weaker overall than in the Si IV tomogram, and has its strongest part along the trajectory most consistent with the initial, ballistic accretion stream. It is not clear if this difference in the fan emission intensity distribution implies an actual difference in the physical distribution of N V and Si IV emission regions in AM Her, or if it is simply an artifact in the tomogram caused by contamination from the broad emission component of the red half of the more closely spaced N V doublet.
On closer inspection, we also found the strong emission region in the N V tomogram to be somewhat different from that in the Si IV tomogram. Specifically, the centre of this region (determined by plotting the 5% intensity contours as for Si IV) is located at . This implies a smaller orbital velocity around the centre-of-mass and a higher degree of asymmetry relative to rotation around the axis than for the strong emission region in the Si IV tomogram (see Sect. 4.3). The 70% contour level extends from to and, despite the increased offset of the emission centre, from to (i.e., the same extent as the 70% contour in the Si IV tomogram).
The C III tomogram contains only a broad, fan-shaped emission component very similar in extent to that in the Si IV tomogram. The strong, compact emission region on the axis is absent from this tomogram, corresponding to the lack of a narrow component in the C III emission lines (see Fig. 6).
3.7 Gaussian Fits to the Emission Line Profiles
In order to measure radial velocity and line flux curves for the UV emission lines in AM Her, we binned the HST spectra into 24 orbital phase bins of width (a 25th bin is empty because a section of the CV’s orbit was not observed by HST). We then fit single or multiple Gaussians (plus a linear function for continuum subtraction) to the line profiles. The number of Gaussians used for a given line depended on the complexity of the line profile. For the C II, Si III, and C III lines, a single Gaussian was used. For the Si IV doublet, a total of 6 Gaussians were used, 3 for each half of the doublet. These 3 Gaussians, in turn, were used to fit the narrow and broad line components seen in the tomographic results (see Section 3.6), as well as a weak, high velocity component revealed as a residual component during an initial attempt to fit the Si IV doublet profiles with 2 times 2 Gaussians. The separations of each of the 3 blue-red pairs of Gaussians was fixed to the separation of the Si IV doublet and their centres were allowed to vary in tandem only. In addition, the FWHM of the Gaussians in each of the 3 blue-red pairs were required to be equal to each other, under the assumption that both halves of each of the 3 doublet components should form in the same region and, hence, display the same intrinsic velocity broadening in their profiles. To provide an additional constraint in fitting this complicated line profile, the amplitudes of each blue-red Gaussian pair were required to be related in the ratio blue:red = 1.0:0.8 (Reader et al. 1980). We attempted a similar approach with the N V doublet, but the more variable continuum and more severe blending of the doublet halves prevented us from obtaining a reliable 6-Gaussian fit. We were only able to fit 2 Gaussians of fixed FWHM and separation to the narrow components in the N V doublet in order to obtain a radial velocity curve of the narrow component.
| Line ID | ) | a) | |||
|---|---|---|---|---|---|
| Si IV NC | 3 | ||||
| Si IV BC | 1 | ||||
| Si IV HVC | 76 | ||||
| C II BC | 1 | ||||
| Si III BC | 2b) | ||||
| N V NC | 1 | ||||
| C III BC | 1 | ||||
a)Total r.m.s. deviation of the data from the fit. b)This value is not likely to be reliable since the exact centre wavelength of the Si III emission complex is not known. A wavelength of 1300.0Å was used to calculate the velocity shifts.


The centres of the Gaussians for the individual line components were converted to velocity offsets from the corresponding line centres. In the case of the doublet lines, we present here only the results of the fits to the blue halves of the doublets. Figure 8 shows the radial velocity curves of the 3 components of the blue half of the Si IV doublet, which are very similar to those obtained for the 3 components in the He II 4686 line of the polar HU Aqr (Schwope et al. 1997). The best least squares fit of the sinusoidal function
| (2) |
to the broad and high velocity components are shown in the figure. The parameters of the fits (i.e., the systemic velocity, , radial velocity semi-amplitude, , and phase offset, , which is defined as the lag between the observed red-to-blue crossing of the emission line velocity and the expected phase of the superior conjunction of the white dwarf) are listed in Table 3.7, along with their uncertainties determined from a Monte Carlo simulation. The implications of the results for the narrow component velocity curves will be discussed in Sect. 4.3. Although the velocity curve of the broad component is fit quite well by a sine wave, the large parameter uncertainties and substantial of the high velocity component attest to the non-sinusoidal nature of its behaviour as a function of orbital phase. The weak, high velocity component detected in the Si IV line does not make a noticeable contribution to the tomogram of that line, even when the tomogram is plotted to larger velocities than shown in Figure 7. There are two main reasons for this: first, the high velocity component is weak compared to the narrow and broad line components, and its apparent relative brightness in the tomogram will be further decreased by being smeared out around the high velocity perimeter of the tomogram. Second, the contamination from the red half of the Si IV doublet, which occurs at a velocity offset approximately equal to the maximum range of variability of the high velocity component, will overpower and mask whatever contribution from the high velocity component that might be contained in the tomogram.
Figure 9 shows the velocity curves of the narrow components of the blue halves of both the Si IV and N V doublets, along with their best fit sine waves (see Table 3.7 for parameter values and uncertainties). There are no velocity points for the narrow component of Si IV in the orbital phase interval –0.1 since the narrow component vanishes during these phases (see Fig. 6), probably due to obscuration by the secondary star (Sect. 4.3). As suggested already by the tomograms, the implied radial velocity semi-amplitude of the narrow component of N V is substantially smaller than that of Si IV. The phase offsets of relative to superior conjunciotn of the white dwarf for both lines imply that the source of the narrow emission component is either on the secondary star or follows the motion of the secondary star around the binary’s centre of mass.
Figure 10 shows the velocity curves from the broad component of Si IV and the single Gaussian fits to C II, Si III, and C III; the fit parameters are listed in Table 3.7. All four curves have phase offsets of , but display a range of velocity semi-amplitudes: Si IV has the smallest , the two carbon lines have larger, approximately equal values, and Si III has the largest .
Figure 11 shows the flux curves determined from the Gaussian fits for the narrow component of Si IV (note that this is the flux of the blue half of the doublet only), and for the Si III, C II, and C III lines. A flux curve for the broad component of Si IV is also shown in the figure; however, this is actually the sum of the fluxes of the broad and the high velocity components of this line (again, the blue half of the doublet only). The fluxes determined individually for these components from the Gaussian fits suffered some confusion at orbital phases when the components’ radial velocity curves crossed each other (see Fig. 8). Flux curves for N V are not available because of the difficulty in distinguishing the blended components of its line profile using the multi-Gaussian fitting approach (as mentioned above). The behaviour of the Si IV broad component and the non-doublet line flux curves is similar in all four of the lines, with a minimum at –0.0 and a maximum at –0.6. The flux curve of the narrow component of Si IV has a maximum at , and vanishes in the phase range .
4 Discussion
4.1 The temperature structure of the heated atmosphere
A major difficulty in the interpretation of the origin of the UV and EUV continuum of AM Her in its high state has been the absence and/or weakness of the absorption features expected from a hot high gravity atmosphere. The ORFEUS-I spectra of AM Her in high state do not show any evidence for or absorption (Raymond et al. 1995), the EUVE spectrum does show weak edges of Ne VI, VIII, but lacks the expected strong O VI 2s, 2p edges (Paerels et al. 1995). The common answer to that riddle is that heating the white dwarf by irradiation from the post-shock plasma causes a flatter temperature gradient in the atmosphere, weakening absorption features which form at Rosseland optical depths . Only a limited number of irradiated white dwarf model atmospheres exist in the literature, e.g. Williams et al. (1987) and van Teeseling et al. (1994). Other instructive papers, even though treating irradiation of the secondary star in accreting binaries, are Anderson (1981) and Brett & Smith (1993). The theoretical temperature structures show mainly two features: a thin, hot, corona-like layer at the outer boundary of the atmosphere and a flat, sometimes completely isothermal temperature structure at larger optical depths. For optical depths , the temperature structure usually approaches that of the undisturbed atmosphere.
A fully self-consistent model for irradiated white dwarf model atmospheres is beyond the scope of the present paper, but we have computed two sets of “poor man’s models” in order to illustrate the main observational effects that can be expected. As input, we use the temperature structure of an undisturbed 20 000 K white dwarf, which was computed with the code described in Paper 1. This temperature structure was modified in two different ways.

(a) was set to a constant value , from the outer boundary of the atmosphere down to an optical depth where the temperature of the undisturbed white dwarf equals . For optical depths larger than , of the undisturbed white dwarf was adopted. Figure 12a shows the temperature structures for several values of . This modification mimics an isothermal regime in the heated atmosphere.
(b) The temperature was set to a constant , from the outer boundary of the atmosphere down to an optical depth where it is smoothly changed into the temperature run of the undisturbed atmosphere. Figure 12b shows the temperature structures for different values of . This modification mimics the presence of a hot corona with a temperature inversion.
From these modified temperature structures, we synthesised model spectra by solving the hydrostatic equation, computing the ionization equilibrium, occupation numbers and the absorption coefficients, and solving the radiative transfer. The resulting spectra are shown in Fig. 12c,d. In the isothermal case (Fig. 12a,c), the absorption lines become weaker with increasing , and, thereby, also increasing , and the continuum approaches the slope of a blackbody. If a hot layer extends deeper than to Rosseland optical depths , strong emission of is produced (Fig. 12b,c). This is in contrast to the observations of AM Her, which show no emission of during the bright phase, i.e. when the heated region has its maximal projected area (Fig. 1). During the faint phase, i.e. when the spot is mostly eclipsed by the white dwarf, broad but weak emission is present. This emission presumably originates in the accretion stream, or in the outer edges of the hot spot. In any case, there is no strong emission of at any orbital phase in our GHRS spectra and no emission of , in the ORFEUS-I spectra (Raymond et al. 1995). This indicates that any hot corona is limited to an outermost thin layer of the atmosphere.
With the results from our simple models in mind, we attempted a crude two-component fit to a combined FUV/UV spectrum of AM Her, constructed from the ORFEUS-I spectrum taken at (Raymond et al. 1995) and GHRS data selected from the same phase interval. Even though AM Her was optically fainter by 0.3 mag during the ORFEUS-I observations, the two spectra match quite well in absolute flux. Figure 13 shows the observations along with our two components, a model spectrum for the undisturbed white dwarf as observed during the low state and an “irradiated” model spectrum as in Fig. 12, scaled appropriately. The sum of the two components quantitatively describes the observations for an assumed size of the heated spot of . This spot is uncomfortably large, but, as discussed in Sect. 3, the accretion stream might contribute somewhat to the observed UV continuum.
Thus, it appears that the heated regions of the white dwarf in AM Her emit a blackbody-like spectrum without noticeable emission or absorption features. This is in agreement with the EUV and soft X-ray data, which gave only marginal evidence for absorption/emission edges.

A fully satisfactory model for the phase-dependent emission of the accretion heated white dwarf has to overcome two hurdles. (a) It is necessary to compute self-consistent white dwarf model atmospheres which include irradiation by thermal bremsstrahlung and cyclotron radiation. (b) The flux and shape of the irradiating spectrum has to be estimated as a function of the location on the white dwarf surface. While (a) is principally a straightforward application of model atmosphere theory, (b) includes many uncertainties with respect to the geometry of the accretion region. The model developed by Wickramasinghe et al. (1991) to explain polarimetric observations could be used as a first estimate of the size and shape of the cyclotron emitting region.
Finally, we note that the situation during the low state is somewhat different: our IUE data (Paper 1) show an almost 100% modulated absorption line during both the bright and faint phase. These data can be very well fitted with model spectra of an undisturbed white dwarf of 24 000 K and 20 000 K, respectively. The heated side of the white dwarf, hence, appears as an undisturbed but hotter white dwarf; the depth of the absorption prohibits ascribing the flux modulation observed during the low state to a heated component as described above (Fig. 12). An HST observation of AM Her during a low state is necessary order to confirm these IUE results at a higher orbital phase resolution and a better S/N.
4.2 Binary parameters
Various estimates for the mass of the white dwarf in AM Her have been published so far, an incomplete list includes (Young & Schneider 1981), (Wu et al. 1995), (Mukai & Charles 1987), (Mouchet 1993), and, the latest value, (Cropper et al. 1998). Accepting the distance to be pc (Paper 1; Beuermann & Weichhold 1998), the UV observations constrain the white dwarf mass. From our fit to the GHRS light curve, we obtain cm, which corresponds to , (carbon core model; Hamada & Salpeter 1961). This can be considered a lower limit of , as we assumed that all the continuum light comes from the (heated) white dwarf; any contribution from the accretion stream will decrease the white dwarf radius and increase its mass. On the other hand, the flux of the IUE low state data require cm, or . A mass as high as 1.22 , or cm, would reduce the distance to the system to pc in order to produce the observed UV flux. A distance that low can be excluded both from the spectrum of the secondary star (Paper 1; Beuermann & Weichhold 1998) and from the parallax (Dahn et al. 1982). We conclude that the mass of the white dwarf in AM Her is , unless the distance differs largely from pc.
The mass of the secondary star has been estimated by Southwell et al. (1995) to be , a result confirmed by Beuermann & Weichhold (1998). Thus, the range for the mass ratio is 0.38 to 0.74.
4.3 The origin of the narrow emission lines
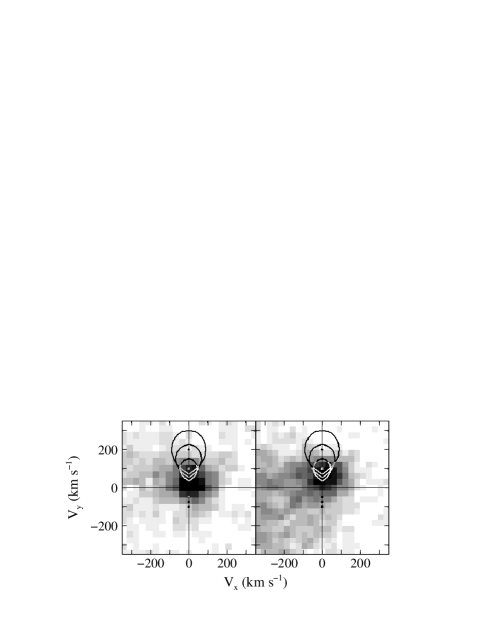
The narrow component seen in the emission lines of a number of AM Her systems is commonly attributed to emission from the side of the secondary star facing the white dwarf (e.g. Liebert & Stockman 1985). This region is heated by irradiation from the white dwarf and/or the hot spot(s) on the white dwarf surface at the impact point(s) of the magnetically-controlled accretion flow. The surface of the secondary star, which is defined by the geometry of its Roche lobe for a given mass ratio and orbital period, is preserved in the mapping from spatial coordinates to the velocity coordinates of a Doppler tomogram. The secondary star’s Roche lobe is symmetric about the axis in a tomogram, with its centre offset from by an amount equal to the radial velocity semi-amplitude of the secondary star, . The asymmetry relative to the axis of the strong emission regions in the Si IV and N V tomograms of AM Her (Sect. 3.6) can be understood as due to non-uniform heating of the secondary star’s face (Smith 1995). The accretion stream shades the leading side of the secondary star from irradiation by the white dwarf/hot spot(s). This results in less heating on the side of the axis, and, therefore, stronger emission on the side of the axis. This shielding effect is observed also in other AM Her stars, e.g. in HU Aqr (Schwope et al. 1997).
Closer inspection of the tomograms of N V and Si IV reveals, however, some difficulties in ascribing the entire narrow emission to the irradiated face of the secondary star. Figure 14 shows blow-ups of the tomograms of N V and Si IV from Figure 7. The Si IV emission falls completely within the secondary Roche lobe for reasonable parameters, and . However, the N V emission requires extreme values as and . As discussed in Sect. 4.2, the mass ratio is rather unlikely to be larger than 0.75. A number of radial velocity measurements have been obtained from the Na I 8183, 8195 doublet, the most reliable measurement yields (Southwell et al. 1995). As discussed by Southwell et al., this value is an upper limit to the real -velocity of the secondary, as the irradiated face of the secondary contributes less to the Na I absorption. After some corrections, they give as a best estimate . Considering these limits on and , our N V tomogram indicates narrow emission originating from material of low velocity dispersion inside the Roche lobe of the white dwarf, close to the point.
We can even exclude that significant parts of the narrow N V emission originate on the secondary. The Si IV narrow emission disappears at (Fig. 6; Fig. 11), which is due to the self-eclipse of the region on the secondary, where heating by irradiation from the white dwarf is strongest, and where, hence, emission is expected to be strongest. From Fig. 6, it is apparent that the N V narrow emission intensity does not show a significant orbital modulation. A consistent origin of N V on the secondary would require the emission region to be located further away from than the Si IV emission region, hence at larger radial velocities. However, the N V narrow emission has a lower radial velocity than the Si IV narrow emission (Table 3.7).
We conclude that the GHRS spectra clearly demonstrate the presence of highly ionized low-velocity-dispersion material which co-rotates with the binary and is located between and the centre of mass. A tempting possibility is that this material is kept in place in a magnetic slingshot prominence emanating from the secondary star. Evidence for such prominences have been found before in the dwarf novae IP Peg and SS Cyg (Steeghs et al. 1996). We will explore the physical properties of the material hold in the prominence in a future paper.
4.4 On the broad emission lines
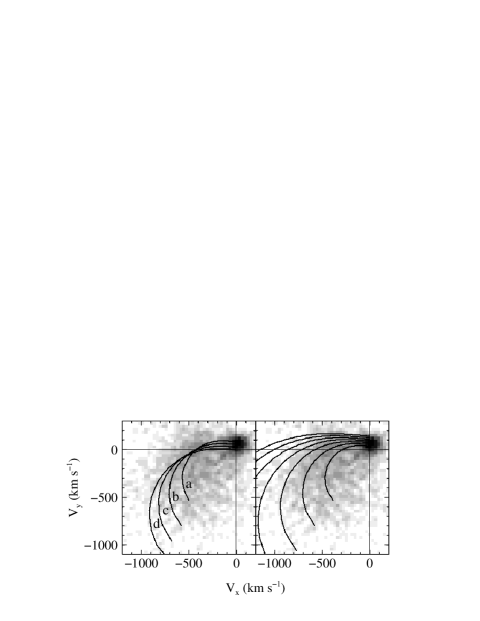
A consistent interpretation of the broad emission lines encounters some difficulties. The radial velocity curves (Fig. 10) clearly indicate an origin in the accretion stream, with maximum redshift at , i.e. when looking parallel to the stream, and maximum blueshift at , i.e. when looking anti-parallel to the stream. The Doppler tomograms (Fig. 15) show that most emission is centred around the ballistic part of the accretion stream if reasonable values are chosen for the mass ratio, e.g. and .
The single-humped light curves of the broad emission lines with maximum flux at and minimum flux at (Fig. 11) are not quantitatively understood. On one hand, if the accretion stream were optically thick, one would naively expect a double-humped light curve: the projected area of the stream is minimal at phases and maximal during phases . This behaviour is observed e.g. in HU Aqr (Schwope et al. 1997) and QQ Vul (Gänsicke 1997). On the other hand, if the stream were optically thin, one would expect no variation of the line fluxes around the binary orbit. Optical depth effects, self-eclipse and irradiation of the stream may be responsible for the observed variation of the broad line fluxes.
An interesting result of the GHRS observations is the detection of a high-velocity component in the emission of Si IV. The low flux of this component, however, prevents a location of its origin in the Doppler tomograms, as already noted in Sect. 3.6. The similar phasing of the radial velocity curves of the broad and the high velocity component (Fig. 8) indicates that both components originate in regions of the accretion stream not too far apart, with the source of the high-velocity emission probably being located closer to the white dwarf.
5 Conclusion
Phase-resolved HST/GHRS observations of AM Her in a high state have revealed a wealth of previously unobserved details.
-
1.
We measure a column density from the interstellar absorption profile. There is no evidence for a phase-dependence of the absorption column. The present high state spectra also show no evidence for photospheric absorption lines from the white dwarf atmosphere other than shallow .
-
2.
We confirm our previous findings that the UV continuum flux modulation is due to a hot spot on the white dwarf and we successfully fit the observed light curve, deriving an upper limit on the spot size of . However, a smaller and hotter spot can not be excluded.
-
3.
The absence/weakness of strong Lyman absorption lines in our GHRS data as well as in the ORFEUS-I data can be understood if the hot spot radiates as a blackbody. The contribution of the unheated parts of the white dwarf is sufficient to explain the shallow absorption in the GHRS spectra.
-
4.
The Doppler tomograms computed from the emission lines show that, while the narrow emission of Si IV originates from the heated face of the secondary, the narrow emission of N V must originate from material between and the centre of mass. A promising way to keep material co-rotating with the binary is a magnetic prominence located on the secondary star near the point.
-
5.
For a distance pc, the mass of the white dwarf in AM Her is .
Acknowledgements.
We thank Chris Mauche for communicating the ORFEUS-1 spectra of AM Her, Jens Kube for discussions on the accretion geometry in AM Her, Stefan Jordan for discussions on magnetic white dwarf model spectra, Janet Mattei for communicating the visual magnitudes of AM Her, Rick Hessman and Axel Schwope for comments on an earlier version of the manuscript, and Howard Lanning for his support during the HST observations. Finally, we thank the referee Frank Verbunt for helpful comments. BTG was supported in part by the DARA under project number 50 OR 9210. PS and DWH acknowledge support from NASA HST grant GO-06558.02-95a. Participation by EMS was supported by NASA HST grant GO-06885.01-95a and by NSF grant AST90-16283-A01 to Villanova University.References
- Anderson (1981) Anderson L., 1981, ApJ 244, 555
- Beuermann & Weichhold (1998) Beuermann K., Weichhold M., 1998, A&A submitted
- Bohlin (1975) Bohlin R.C., 1975, ApJ 200, 402
- Brett & Smith (1993) Brett J.M., Smith R.C., 1993, MNRAS 264, 641
- Cropper et al. (1998) Cropper M., Ramsay G., Wu K., 1998, MNRAS 293, 222
- Dahn et al. (1982) Dahn C.C., Riepe B.Y., Guetter H.H., et al., 1982, AJ 87, 419
- Davey & Smith (1996) Davey S.C., Smith R.C., 1996, MNRAS 280, 481
- Gänsicke et al. (1995) Gänsicke B.T., Beuermann K., de Martino D., 1995, A&A 303, 127 (Paper 1)
- Gänsicke (1997) Gänsicke B.T., 1997, PhD dissertation, University of Göttingen
- Greenstein et al. (1977) Greenstein, J.L., Sargent, W.L.W., Boroson, T.A., Boksenberg, A., 1977, ApJ 1977, L21
- Hamada & Salpeter (1961) Hamada T., Salpeter E.E., 1961, ApJ 134, 683
- Heise & Verbunt (1988) Heise J., Verbunt F., 1988, A&A 189, 112
- Horne (1991) Horne K., 1991, in Proceedings of the 12th North American Workshop on Cataclysmic Variables and Low Mass X-ray Binaries, ed. A. W. Shafter (San Diego: San Diego State University), p. 23
- Liebert & Stockman (1985) Liebert J., Stockman H.S., 1985, in CVs and LMXBs, eds D.Q. Lamb, J. Patterson, p. 151
- Long et al. (1993) Long, K.S., Blair, W.P., Bowers, C.W., Davidson, A.F., Kriss, G.A., Sion, E.M., Hubeny, I., 1993, ApJ 405, 327
- Mauche et al. (1988) Mauche C.W., Raymond J.C., Córdova F.A., 1988, ApJ 355, 829
- Marsh & Horne (1988) Marsh T. R. & Horne K., 1988, MNRAS, 235, 269
- Martin (1988) Martin J. S., 1988, PhD dissertation, University of Sussex
- Mukai & Charles (1987) Mukai K., Charles P.A., 1987, MNRAS 226, 209
- Mouchet (1993) Mouchet M., 1993, in White Dwarfs: Advances in Observation and Theory, ed Barstow, M., p. 411 (Dordrecht: Kluwer)
- Paerels et al. (1994) Paerels F., Heise J., van Teeseling A., 1994, ApJ 426, 313
- Paerels et al. (1996) Paerels F., Young Hur M., Mauche C.W., Heise J., 1995, ApJ 464, 884
- Panek (1980) Panek R.J., 1980, ApJ 241, 1077
- Raymond et al. (1995) Raymond J.C., Mauche C.W., Bowyer S., Hurwitz M., 1995, ApJ 440, 331
- Reader et al. (1980) Reader J., Corliss C. H., Wiese W. L., & Martin G. A., 1980, in Wavelengths and Transition Probabilities for Atoms and Atomic Ions (Washington, D. C.: U. S. Goverment Printing Office), 135
- Rechenberg (1994) Rechenberg I., 1994, Evolutionsstrategie ’94 (froommann–holzboog: Stuttgart)
- Schwope et al. (1995) Schwope A. D., Schwarz R., Mantel K.-H., Beuermann K., 1995, in Cape Workshop on Magnetic Cataclysmic Variables, eds. D.A.H. Buckley, B. Warner, p. 166
- Schwope et al. (1997) Schwope A. D., Mantel K.-H., Horne K., 1997, A&A, 319, 894
- Sherbert & Hulbert (1997) Sherbert L.E., Hulbert S.J., 1997, GHRS-ISR 67 update, STScI
- Sherbert et al. (1997) Sherbert L.E., Soderblom D.R., Mack J., 1997, GHRS-ISR 85, STScI
- (31) Shull J.M., van Steenberg M.E., 1985, ApJ 294, 599
- Sion et al. (1995) Sion, E.M., Szkody, P., Cheng, F.H., Huang, M., 1995, ApJ 444, L97
- Southwell et al. (1995) Southwell K.A., Still M.D., Smith R.C., Martin J.S., 1995, A&A 302, 90
- Smith (1995) Smith, R.C., 1995, in Cape Workshop on Magnetic Cataclysmic Variables, eds. Buckley, D.A.H. & Warner, B., p. 417 (ASP Conf. Ser. 85)
- Steeghs et al. (1996) Steeghs D., Horne K., Marsh T.R., Donati J.F., 1996, MNRAS 281, 626
- Szkody et al. (1980) Szkody P., Cordova F.A., Tuohy I.R., et al., 1980, ApJ 241, 1070
- van Teeseling et al. (1994) van Teeseling A., Heise J., Paerels F., 1994, A&A 281, 119
- Warner (1995) Warner, B., 1995, Cataclysmic Variable Stars (Cambridge University Press)
- Wickramasinge et al. (1991) Wickramasinghe D.T., Bailey J., Meggitt S.M.A., et al., 1991, MNRAS 251, 28
- Williams et al. (1987) Williams G.A., King A.R., Brooker J.R.E., 1987, MNRAS 266, 725
- Wu et al. (1995) Wu K., Changmugam G., Shaviv G., 1995, ApJ 455, 260
- Young & Schneider (1979) Young P., Schneider D.P., 1979, ApJ 230, 502
- Young & Schneider (1981) Young P., Schneider D.P., 1981, ApJ 245, 1043