RXTE Spectroscopy of GRS 1915+105
Abstract
The galactic superluminal motion source GRS 1915+105 has been extensively observed with the RXTE satellite over the last two years. More than 250 RXTE pointings have been performed until mid-May 1998 with more than 1.5 Msec exposure time on roughly a weekly basis. Here we report on first results of our spectral analysis of a major part of these pointed RXTE observations. We establish the existence of at least 5 spectral components and present the changes of these components over the last two years.
1 Introduction
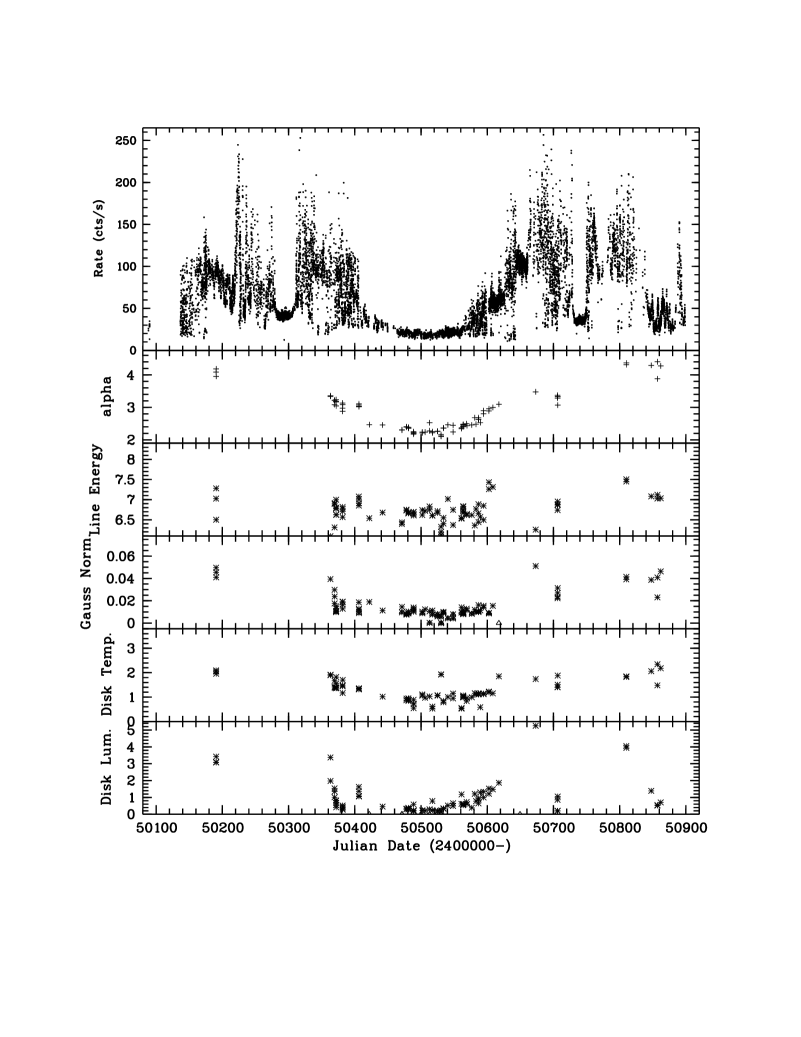
GRS 1915+105 was discovered in 1992 with the WATCH/Granat (Castro-Tirado et al. 1992). A comparison of the BATSE ( keV) fluxes with ROSAT (1–2.4 keV) fluxes has shown that GRS 1915+105 has been active all the time since 1992, even during times of BATSE non-detections (Greiner et al. 1997). This has become even more evident with the daily coverage provided by the all-sky monitor (ASM) of the RXTE satellite since early 1996 (see top of Fig. 1). A variable radio source was found with the VLA (Mirabel et al. 1993) inside the 10′′ X-ray error circle (Greiner 1993), which later was discovered to eject radio blobs travelling at apparently superluminal speed (Mirabel & Rodriguez 1994) making GRS 1915+105 the first superluminal source in the Galaxy. Until then, apparent superluminal motion was only observed in AGN, the central engines of which are generally believed to be massive black holes. This similarity as well as that to the second superluminal source in our Galaxy, GRO J1655–40, for which a dynamical mass of 7 was estimated (Orosz & Bailyn 1997) suggests that GRS 1915+105 harbors a stellar-sized black hole. The series of RXTE pointed observations initiated in April 1996 revealed dramatic intensity variations (Greiner et al. 1996) on time scales from 10 s to hours. The nature of these astonishing X-ray instabilities is currently a mystery though attempts have been made to both interprete these as accretion disk instabilities leading to an infall of parts of the inner accretion disk (Greiner et al. 1996, Belloni et al. 1997) and relate them to radio flares and jet formation (Greiner et al. 1996, Pooley & Fender 1997, Eikenberry et al. 1998, Mirabel et al. 1998).
The X-ray spectrum as seen with ROSAT (Greiner 1993) and ASCA (Nagase et al. 1994) is strongly absorbed (N cm-2) consistent with the location in the galactic plane at 12.5 kpc distance (Mirabel & Rodriguez 1994). Complex emission/absorption features in the 7–8 keV range have been seen with ASCA at two occasions (Ebisawa 1997).
2 Spectral analysis
We have started a comprehensive spectral investigation using PCA as well as HEXTE data of well-defined time stretches which are selected according to their different shapes in the lightcurve. We used the “Standard 2” data having 16 sec time resolution, and used PCUs 0, 3 and 4 separately in the fits to not degrade the spectral resolution. We have always fit combined PCA and HEXTE data. We have ignored in the fitting PCA data below 2 keV and above 25 keV due to uncertainties in the response matrix (see http://lheawww.gsfc.nasa.gov/users/keith/user_comm/sept97/pca.html for a detailed description) and HEXTE data below 30 keV due to response uncertainties and above 170 keV due to count rate statistics. We have added a 1% systematic error to account for the remaining PCA response uncertainties. While applying the identical model to both data sets, we let the relative normalization between the PCA and HEXTE data float as a free parameter. No deadtime correction has been applied which may result in an underestimate of the fluxes in the PCA of about 5% during the very high flux states.
The spectra are complex and rapidly variable. Single component spectra like pure power law, bremsstrahlung, synchrotron or comptonization models do not fit these spectra. In general, the spectra are composed of at least five components:
-
•
Soft component: The soft component is a transient and most probably thermal component below 15 keV. It can formally be described equally well by either an exponential cut-off power law (with cut-off energy between 5–7 keV), a bremsstrahlung model with typical temperatures in the range 3–5 keV, or a multicolor disk blackbody model. The bremsstrahlung model description, however, is physically not possible because the observed luminosity requires a size of the emission region for which the light crossing time would be at least a factor of 10–30 larger than the observed variability time scale. We therefore adopt the multicolor disk blackbody model description in the following. The typical effective temperature of the disk blackbody is 1–2 keV. Note that in its standard form (like DISK within XSPEC) the best fit accretion rate is always highly super-Eddington, and the implied mass of the compact object below 1 due to the high temperature.
-
•
Hard component: The hard component is best described by a power law model extending up to 200 keV, the upper bound of the HEXTE energy range. This component is always present, but varies in strength and power law photon index (between –2.0 to –4.8).
-
•
Compton reflection component: There is an nearly always visible additional component comprising of excess emission in the 10–20 keV range which we interpret as Compton reflection.
-
•
Iron complex: We observe strong excess emission in the 6–8 keV region. The peak of this excess emission varies between 6.5 and 7.5 keV. Due to the PCA energy resolution of about 0.9 keV in this range a more detailed analysis, such as revealing various components, is not possible.
-
•
Correction for dust scattering: GRS 1915+105 is located behind 51022 cm-2 of absorbing material (Greiner et al. 1994), and thus exhibits a strong dust scattering component. Based on ROSAT PSPC observations the fraction of scattered light at 1 keV is about 30% and the halo size is larger than the field of view of the PSPC (55′ radius). We note that due to the strong X-ray variability of GRS 1915+105 this value is not a constant since the scattered light travels increasingly longer as one moves to increasing angular distance from the line of sight. Since the collimated field of view of the PCA is smaller than the dust scattering halo size of GRS 1915+105 one looses X-ray source photons which are scattered off the line of sight and arrive at Earth at an angle larger than the PCA field of view radius. The result of correcting for this effect (with the DUST model in XSPEC) is a reduction of the best-fit absorbing column by as much as a factor of 1.5–2. The best-fit absorbing column then ranges between 5.3–5.71022 cm-2 in our fits, consistent with the ROSAT, ASCA and radio measurements of the extinction towards GRS 1915+105.
We have fit the spectra of more than 50 observations with a combination of these five components, and show the temporal variation of some basic best-fit parameters in Fig. 1.
The RXTE observation of 1997 October 31 shows GRS 1915+105 in a state of wild oscillations with the largest peak fluxes we have observed so far. The count rate in all PCA units reaches 63 040 cts/s during these peaks which have a typical duration of 10–12 sec, and which have complex peak structure (flat-top, round, double-peaked). The determination of the total X-ray flux depends on the lower bound of the power law component. The best-fit –3.2 power law component contributes 2.310-7 erg/cm2/s (3.710-6 erg/cm2/s) in the 1–200 keV (0.1–200 keV) range. The bolometric flux of the 2 keV disk blackbody component is 1.610-7 erg/cm2/s. Thus, integrating over the disk blackbody component plus the power law between the usually adopted lower bound of 0.1 keV up to 200 keV results in an unabsorbed luminosity of 6.51040 (D/12.5 kpc)2 erg/s (or 6.71039 (D/12.5 kpc)2 erg/s for a lower bound of 1 keV). The average luminosity over several hours is about one third of this.
3 Discussion and Summary
The slope of the power law component shows a clear variation which is correlated to the intensity states: it is flattest during the low-hard states (Morgan et al. 1997), and much steeper during the high and flaring states. In general, the power law component extending to above 100 keV is assumed to be produced by Comptonization of the soft disk X-ray photons by the hot electrons suspected to exist in the disk “corona”. Given the high luminosity of this power law component (see above), Comptonization must be very efficient. However, the more efficient Comptonization is the flatter should the resulting power law slope be, inconsistent with our observations. We therefore conclude that other emission mechanisms should be considered, e.g. synchrotron emission as one of the possible alternatives.
Using an inclination of 70∘ and the Compton reflection models in the XSPEC package which consistently include an iron absorption edge we find that (i) the reflection fraction is rather low and that (ii) an ionized reflector seems to be required since the ionization parameter (in the PEXRIV model) always peggs the upper limit. We note, however, that at some occasions the Gaussian line component goes to the iron absorption edge to seemingly compensate for a smaller or even non-existing edge structure. The inclusion of the reflection component in the fit has the general effect of resulting in a steeper power law slope, i.e. the reflected emission component in the 10–30 keV range does not compromise the actual slope in the HEXTE energy range up to 170 keV. In addition, it also reduces the accretion rate, and thus temperature, of the disk blackbody component by about 20%.
Acknowledgements: JG is supported by the German Bundesministerium für Bildung, Wissenschaft, Forschung und Technologie (BMBF/DLR) under contract No. FKZ 50 QQ 9602 3.
References
- Belloni T., Mendez M., King A.R., van der Klis M., van Paradijs J., 1997, ApJ 479, L145
- Castro-Tirado A.J., Brandt S., Lund N., 1992, IAU Circ. 5590
- Ebisawa K., 1997, in Proc. of “X-ray imaging and spectroscopy of cosmic hot plasmas”, Univ. Acad. Press, Tokyo, p. 427
- Eikenberry S.S., Matthews K., Morgan E.H., Remillard R.R., Nelson R.W., 1998, ApJ 494, L61
- Greiner J., 1993, IAU Circ. 5786
- Greiner J., Snowden S., Harmon B.A., Kouveliotou C., Paciesas W., 1994, 2nd Compton Symposium, Washington 1993, AIP 304, 260
- Greiner J., Morgan E.H., Remillard R.A., 1996, ApJ 473, L107
- 6 Greiner J., Harmon, B.A., Paciesas W.S., Morgan E.H., Remillard R.A., 1997, in Accretion Phenomena and Associated Outflows, eds. D.T. Wickramasinghe et al. ASP Conf. Ser. 121, p. 709
- 7 Mirabel I.F., Rodriguez L.F., Marti J., Teyssier R., Paul J., Auriere M., 1993, IAU Circ. 5773
- 8 Mirabel I.F., Rodriguez L.F., 1994, Nat. 371, 46
- 8 Mirabel I.F., Dhawan V., Chaty S., et al. 1998, AA 330, L9
- 9 Morgan E.H., Remillard R.A., Greiner J., 1997, ApJ 482, 993
- 10 Nagase F., Inoue H., Kotani T, Ueda Y., 1994, IAUC 6094
- b Orosz J.A., Bailyn C.D., 1997, ApJ 477, 876
- 11 Pooley G.G., Fender R.P., 1997, MNRAS 292, 925