CCD Photometry of the High Amplitude Scuti Stars
V798 Cyg and V831 Tau
Abstract
New CCD measurements on the two high–amplitude Sct stars V798 Cyg and V831 Tau were carried out. The double–mode pulsation of V798 Cyg is demonstrated beyond any doubt. The ratio of 0.800 is confirmed to be related to the unusual shape of the light curve. The properties of the Fourier parameters were revisited also by considering the new light curve of V831 Tau. In particular, the classical double–mode pulsators cannot fill the gap in the distribution. Two new variable stars were discovered in the field of V798 Cyg.
1 Introduction
In the recent past an increasing number of theoretical and observational studies were devoted to the Sct stars showing light curves having a amplitude larger than 0.20 mag and pulsating in one or two stable frequencies (HADS, see also Petersen & Christensen–Daalsgard 1996). They were mainly concerned with the understanding of their pulsational and physical properties. Rodríguez et al. (1996) investigated the nature of the large amplitude modes, concluding that they are radial; Garrido & Rodríguez (1996) refined this conclusion, finding possible nonradial terms having very small amplitudes in SX Phe and DY Peg. Breger & Pamyatnykh (1998) found evidence of period changes in a number of HADS, but it was not possible to relate them with stellar evolution; hence, their nature is still unclear.
Antonello et al. (1986) and Poretti et al. (1990) proposed a synthetic description of the HADS light curves, trying to obtain their quantitative classification. The result was successfull, since regular trends were observed in the Fourier parameter space, as in the and planes. A bimodal distribution was observed in plots and no satisfactory explanation can be given at the moment, since the action of a resonance is not confirmed by the phase plots. Moreover, Poretti & Antonello (1988) emphasized the similarities between the light curves of V1719 Cyg, V798 Cyg and V974 Oph which show a descending branch steeper than the ascending one. Later, V974 Oph was dropped out from this short list since it is actually a multiperiodic variable (Poretti & Mantegazza 1992),
Recently, Hintz & Joner (1997) reported new results on CY Aqr, XX Cyg and V798 Cyg. Their result for the first two stars confirm the Fourier parameters obtained by Antonello et al. (1986). On the other hand, Hintz & Joner questioned the double–mode nature of V798 Cyg suggested by Poretti & Antonello (1988). In this paper we present new CCD data which corroborate the double–mode hypothesis; we also rediscuss the properties of the Fourier parameters considering the first CCD measurements of the short period variable V831 Tau.
2 New observations
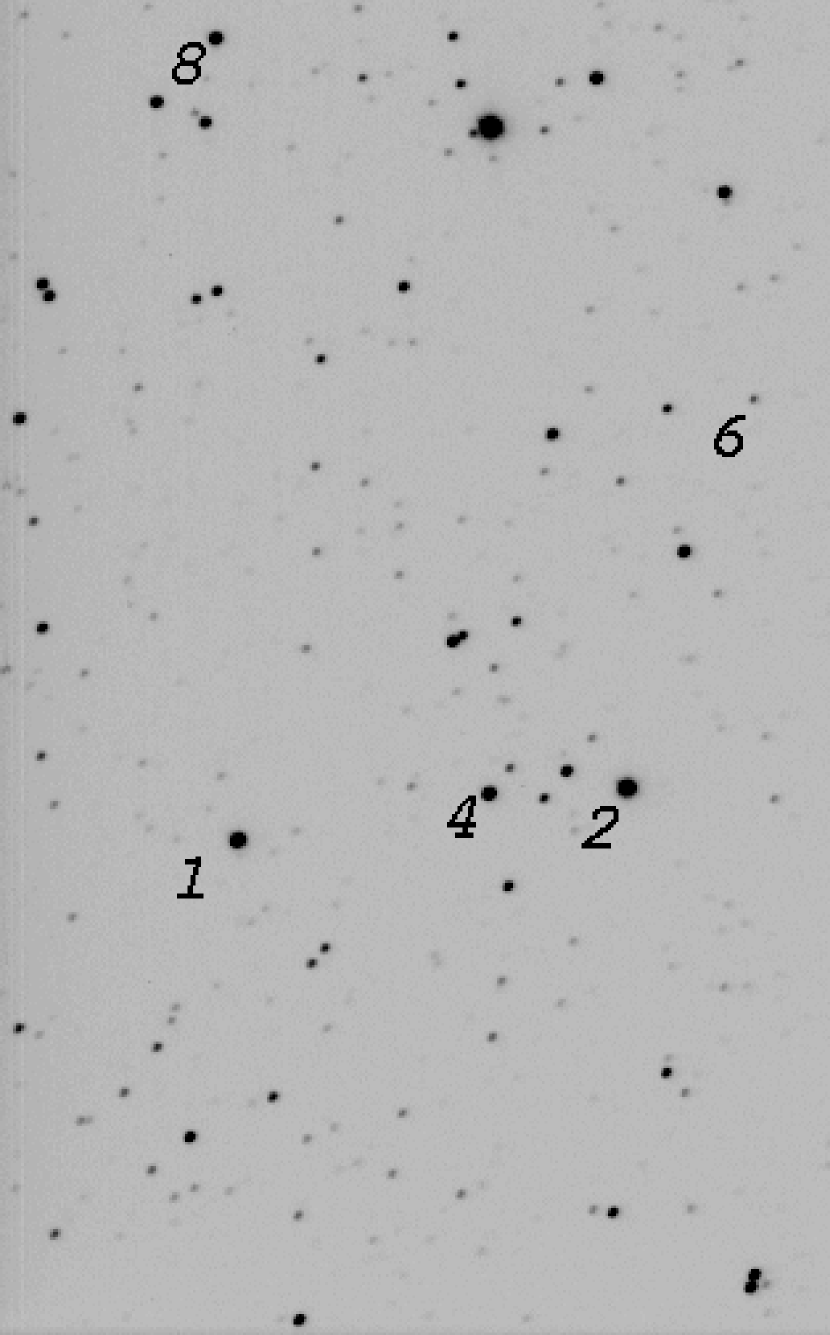
After the detection of a possible second periodicity in the light curve of V798 Cyg, we planned new photometric measurements to confirm it. 135 CCD images were obtained with the 152–cm Cassini telescope of the Bologna Astronomical Observatory, located at Loiano, on four nights between 1987 August 29 and 1987 September 4. The observations were obtained through a filter and the exposure time was 20 sec (15 sec for the first 20 images). Figure 1 shows a typical frame.
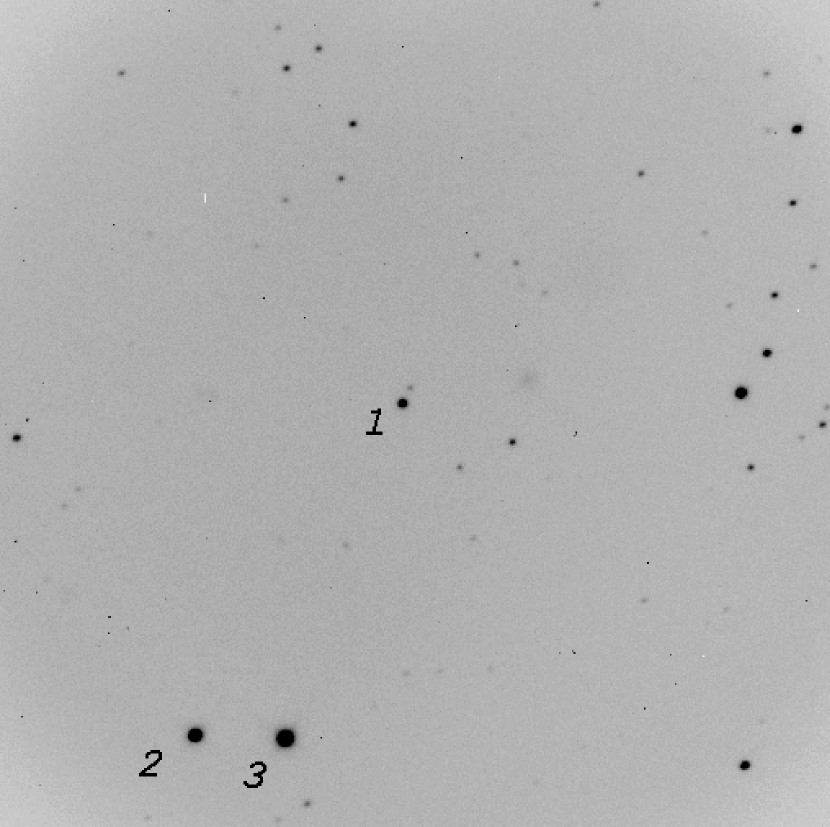
More recently, we carried out an observing run on some extragalactic objects with the 1.5 m telescope at San Pedro Mártir Observatory (Baja California, Mexico) in December 1996. When seeing conditions were not adequate (owing to strong wind) to take CCD frames on 20th–mag objects, we considered the 17th–mag variable star V831 Tau (named as GR 269 and ZB 33 in Romano 1973 and Huang 1982, respectively) as a good backup programme. Exposure times ranged from 7 to 15 minutes depending on weather conditions. 81 CCD images were obtained on six nights from December 11 to 18, 1996. The rapid and large amplitude variability made V831 Tau an interesting object since the light curve reported by Huang (1982) is sinusoidal and such a shape is quite unexpected for short period variables. Figure 2 shows a typical CCD frame of the field. The data reduction was performed by using the midas package; both photometry aperture and daophot routines were used. Because the target stars in our frames are very bright, the methods are equivalent. For a full description of the analysis, see Musazzi (1997). The results described here are obtained using a photometric aperture of 14 arcsec for the San Pedro Mártir frames and 10 arcsec for the Loiano frames. Photometry was performed for all the stars in each field; differential magnitudes were calculated with respect to the adequate comparison star. In the case of V798 Cyg (Fig. 1), values were derived with respect to star 2; they were tranformed into an instrumental system by assuming =12.504 for V798 Cyg (Poretti & Antonello 1988). An estimation of the errors was achieved from the standard deviation of the measurements of star 4 in the V798 Cyg frames and of the star 3 ones in the V831 Tau frames: the whole datasets yielded 5 and 7 mmag, respectively.
As a by–product of our analysis, we detected two new variables in the rich field of V798 Cyg. The first one, labelled “6” in Fig. 1, is probably an eclipsing binary. Figure 3 shows its light curve on the three longest nights: the regular decrease in the top panel is about 0.5 mag, while on the other nights it is constant at maximum level. The second new variable, labelled “8” in Fig. 1, is probably a multiperiodic pulsating star. Figure 4 shows its light curve: cycle–to–cycle variations are clearly evident. A frequency analysis revealed two possible terms at 13.95 and 19.58 cd-1, but further observations are necessary to disclose its true nature.
3 Frequency analysis
The least–squares power spectrum method (Vaniĉek 1971) was used to detect the frequency content of the light curves. This method allows each constituent to be detected one by one: in the search for a new term, only the frequencies of the previously identified terms (the known constituents, k.c’s) are taken into account, since their amplitudes and phases are recalculated as unknowns in the least–squares routine. We routinely apply this algorithm to multiperiodic Sct stars; recently, Pardo & Poretti (1997) used it to detect the frequency content of the light curves of double–mode Cepheids.
3.1 V798 Cyg
The new CCD measurements were analysed to confirm the presence of a second excited mode. The frequency analysis immediately evidenced the peak at 5.13 cd-1 (Fig.5, top panel), corresponding to the well–known first period (Poretti & Antonello 1988). There is no doubt on it, since when introducing the neighbouring alias (4.13 or 6.13 cd-1) residual signal is left at 5.13 cd-1. By proceeding in the analysis the harmonics 2, 3and 4(or its aliases) were detected as the highest peaks. This is not surprising since the light curve on is known to be quite asymmetrical.
The crucial point was to verify what happened when and its first three harmonics were introduced as k.c’s in the search for new frequencies. The middle panel of Fig. 5 shows the power spectrum we obtained: the structure centered around 6.41 cd-1 is clearly visible. This panel can be compared with the Fig. 5 in Poretti & Antonello (1988): in that figure the uncertainty between 6.41 and 7.41 cd-1 is strong due to the interaction between noise effects and spectral window, since in all these cases the time sampling is not particularly good. We can conclude that the spectral analysis of the new, more accurate, CCD data suggests 6.41 cd-1 as the true value for the term. Figure 6 shows the light curves obtained by subtracting from the data the curve related to one of the two frequencies and then plotted against the phase related to the other one. As can be seen the CCD light curves in Fig. 6 are of better quality with respect to the photolelectric ones (Fig. 6 in Poretti & Antonello 1988); in particular the scatter around the minimum of the light curve on is considerably reduced and it can be ascribed to the low signal in the photoelectric measurements when the star is very faint. Also considering the middle panel of Fig. 5, no doubt is left on the fact that a second periodicity does exist. The two frequency analyses carried out on two independent datasets show the same structure over the whole spectral pattern (and its three harmonics, ), strongly supporting its real nature.
It is now necessary to understand why Hintz & Joner (1997) failed to find the term. It should be noted that they did not report any power spectrum, did not give any detail about the method used to analyze their time series and no observing log is presented. A careful rediscussion of their measurements was therefore considered necessary. The authors kindly put at our disposal their unpublished measurements and we processed them. The data were obtained on only two nights spaced by one night. As a result, the peaks in the power spectrum are quite large and the aliases at 0.5 cd-1 are also prominent. Since Hintz & Joner (1997) performed a prewhitening at each step, some power belonging to may be arbitrarily subtracted when removing the light curve, owing to the leakage between the large and numerous peaks. Hence, the importance of has been underevaluated. To verify this hypothesis, we analyzed the Hintz & Joner measurements by using our method, which does not require any prewhitening: the bottom panel of Fig. 5 shows the power spectrum we obtained. In spite of its rather poor look (owing to the bad spectral window), the presence of a signal around 5–7 cd-1 is clearly evidenced. We can conclude that their measurements also support the presence of a second periodicity. Why did they missed it? They observed on two nights only and the influence of shifted the light curve built on =5.1343 cd-1. Hence they could obtain a good fit with a slightly different value for the frequency (5.1261 cd-1); the prewhitening of in their data may have subtracted power from . However, the 5.1261 cd-1 value is fully inadequate to fit all the available data on V798 Cyg (not only our CCD and photoelectric sets, but also the former photographic measurements); this different frequency value can be considered as an artifact of the analysis, just good enough to link the light curves of two nights only of a double–mode variable with a single (but wrong) period. To verify once more the action of the term in the Hintz & Joner data, Fig. 7 shows the light curves of and as obtained from the Hintz & Joner measurements: the sine–shaped light curve is quite evident. When comparing Figs. 6 and 7, the light curves on the term seem to be different in shape at maximum light, but this must be considered with caution because our CCD measurements cover only one cycle around the maximum. Indeed, the Fourier parameters are very similar. They are summarized in Table 1, together with the parameters of the least–squares fit. The small differences in the amplitudes can be entirely due to the different instrumental systems; this fact hampered us from merging all the measurements in a reliable way.
3.2 V831 Tau
The analysis of the 81 CCD measurements of V831 Tau was much easier than in the previous case. The terms =15.551 cd-1, 2, 3, 4 were clearly identified in the power spectrum; they correspond to the already known period of 0.0643 d. The fit with these four terms leaves a rms residual of 0.014 mag (Tab. 2); it is larger than the expected one, but we have to consider that V831 Tau is 2 mag fainter than star 2 in Fig. 2. Moreover, owing to the large amplitude and short period, during the exposure time V831 Tau showed an intrinsic, not linear variability and hence ascribing the observed flux to the middle time is not always an exact procedure. The residual power spectrum does not allow any identification of a second period or a higher harmonic. Figure 8 shows the light curve; as can be noted, it is quite asymmetrical and the ascending branch is very steep. Moreover, it is quite regular; a small scatter is observed only at the turning points, where the shape of the light curve is changing non–linearly during the exposures. The sine–shaped light curve presented by Huang (1982) is not confirmed; it probably originated from the very long photographic exposures. It should be noted that its period is one of the shortest among HADS, very close to that of CY Aqr.
4 Discussion
4.1 The search for a second term
From a methodological point of view, it was once more demonstrated that the detection of a second periodicity is not an easy task when it has a very small amplitude. A careful frequency analysis must be performed and the quality of the fit cannot be considered a powerful diagnostic of the absence of a second term. Harmonics and cross–coupling terms can be detected one by one using our iterative least–squares technique, as Pardo & Poretti (1997) extensively demonstrated in the case of double–mode Cepheids. In such a context, the approach of Hintz & Joner (1997) aiming at searching for the best solution is inadequate and is not recommended for future works: as it was demonstrated by the power spectra and the light curves (Figs. 3, 4 and 5), the second term is clearly evident in the measurements of V798 Cyg. Moreover, it should be emphasized that Hintz & Joner did not verify if their solution could fit the previous datasets. In such a case they could easily verify that their period was wrong; from a general point of view, two short nights cannot invalidate the well–proven results obtained on a larger baseline.
When the presence of a second periodicity is claimed or refused on the basis of qualitative statements, some contradictions may arise. As an example, Hintz & Joner (1997) considered V567 Oph as a possible double–mode pulsator because Powell et al. (1990) had found amplitude variations and phase shifts. Since Powell et al. (1990) did not detect any second term in the power spectrum of V567 Oph, we cannot consider it as a double–mode pulsator; moreover, Poretti et al. (1990) found its light curve to be very stable. On the other hand, they considered CY Aqr as a monoperiodic pulsator, but this star shows the same cycle–to–cycle variations (McNamara et al., 1996, and references therein). Such variations are the definition of the well–known (but also not well–understood) Blazhko effect, typical of HADS and RR Lyr stars. As a rule, it is not possible to explain it as the action of a second periodicity, since frequency analysis of well–observed stars failed to detect it. As a last comment, it should be noted that Hintz & Joner (1997) considered V1719 Cyg as a suspected double–mode pulsator in their discussion; however, as clearly demonstrated by Poretti & Antonello (1988), the double–mode pulsation is quite evident and there is no reason to doubt it. In our opinion, only a frequency power spectrum obtained on the basis of good quality data (both for precision and for time sampling) should be used to argue in favour of or against a double–mode behaviour.
5 The Fourier decomposition
To perform the decomposition, we fitted the original measurements by the formula
| (1) |
In the case of V831 Tau, , 2, 3, 4were identified in the frequency analysis, i.e. there was noterm. The corresponding phase and amplitude parameters can be derived. In the case of V798 Cyg, the , 2, 3, 4and terms were identified; because =1, no Fourier parameter can be calculated for the term.
5.1 V831 Tau
The Fourier decomposition of the CCD measurements yields =3.750.09 rad and =0.360.03 for V831 Tau. This star provides a good confirmation of the regular trend in the short period region of the plots (see Fig. 8 in Poretti et al. 1990): in fact, from 0.10 to 0.04 d we can see a drop of the values from 4.0 rad to about 3.0 rad. The reason for such an abrupt change in the light curve shape is unknown at present. V831 Tau takes place in the group having large values, as is often the case for short period variables. The asymmetrical light curve behaviour is the expected one for such a variable and is more likely than the previously reported sinusoidal shape.
5.2 V798 Cyg and the double–mode pulsators
The least–squares fits reported in Tab. 1 allowed us to obtain values in good agreement with each other: 2.530.08, 2.640.05, 2.700.06 rad, respectively. Poretti & Antonello (1988) determined a value of 2.520.05 rad from photometry of V1719 Cyg. Since the two values are also very similar (0.18, 0.19, 0.17 in the three datasets of V798 Cyg; 0.20 for V1719 Cyg), the close similarity between their light curves is now a well–established result. The light curves are slightly different; in V798 Cyg the amplitude is shallow and hence cross–coupling terms are not detected, while they are observed in the V1719 Cyg light curve. The /ratio is 0.79980.0001 for V1719 Cyg and 0.80120.0002 for V798 Cyg: since the separation is about one order of magnitude greater than the formal errors, a slight dependence from is suggested.
Hintz & Joner (1997) argued that double–mode pulsators can fill the gap in the distribution, supplying values around 0.27. They quoted the Rodríguez et al. (1992) results to support their thesis and in particular the 0.27 value obtained in the cases of BP Peg and RV Ari. However, as can be easily verified, this intriguing hypothesis is wrong as Rodríguez et al. report 0.303 for RV Ari and 0.315 for BP Peg; the same values are obtained from their least–squares fit. So the gap around 0.27 still exists.
It should be emphasized once more that the ratio for AE UMa, BP Peg and RV Ari is about 0.773. Petersen & Christensen–Daalsgard (1996) showed how the 0.77 ratio is in good agreement with the predictions of the theoretical models for the fundamental () and the first overtone () radial modes. Small deviations can be obtained varying the metallicity or assuming different relationships, but for all the theoretical values are within 0.765 and 0.790. When discussing the case of VZ Cnc, Petersen & Høg (1998) argued against the hypothesis of a ratio modified by secondary parameters as diffusion or rotation and considered the 0.800 ratio as an indicator of the pulsation in a different couple of modes, i.e. the second () and the first radial overtone. In this scenario, we should consider V1719 Cyg and V798 Cyg as two pulsators; however, we pointed out the unusual shape of their light curve (considering it both a or a mode), very different from that of other double–mode pulsating stars, both HADS and Cepheids. Since in the case of Cepheids the deviations from regular trends in the Fourier parameters planes were recognized as indicators of different physical conditions (other pulsation modes, resonances; Poretti 1994 and references therein, Welch et al. 1995), further theoretical investigations are needed to give a full description of the observed peculiarities emphasized above.
6 Conclusions
The possibility to perform the frequency analysis of the light variation of V798 Cyg on the basis of a more accurate set of data and the Fourier decomposition of the new light curve of V831 Tau allowed us to improve the knowledge of the HADS. The following points are now better defined:
-
1.
V798 Cyg is confirmed to be a double–mode pulsator and its similarity with V1719 Cyg definitely established: the peculiar light curve on (descending branch steeper than the observed one) and the double–mode pulsation with ratio 0.800 have to be considered together in modelling these stars.
-
2.
The detection of additional periodicities in light curves is confirmed to be a delicate matter. A thorough discussion would be needed to invalidate previous results estalished on the basis of better time–series, as otherwise confusing results are obtained, as in the case of V798 Cyg.
-
3.
The short–period variable V831 Tau shows a light curve very similar to other stars having the same period; the previously reported sinusoidal light curve is not confirmed. The light curves of HADS towards short periods have a very regular progression in the Fourier parameters space.
-
4.
The gap around 0.25–0.30 in the distribution of HADS light curves is confirmed. Hintz & Joner (1997) claimed that it can be filled by the values obtained from double–mode pulsators, but the available photometry does not support that claim which seems the result from improper handling of the data.
References
- (1) Antonello, E., Broglia, P., Conconi, P., & Mantegazza, L. 1986, A&A, 1986, 122
- (2) Breger, M., & Pamyatnykh, A. 1998, A&A, in press
- (3) Garrido, R., & Rodríguez, E. 1996, MNRAS, 281, 696
- (4) Hintz, E.G., & Joner, M.D. 1997, PASP, 109, 639
- (5) Huang, C.C. 1982, IBVS 2114
- (6) McNamara, D.H., Powell, J.M., & Joner, M.D. 1996, PASP, 108, 1098
- (7) Musazzi, F. 1997, Laurea Thesis, Università di Milano (in italian)
- (8) Pardo, I., & Poretti, E. 1997, A&A, 324, 121
- (9) Petersen, J.O., & Christensen–Daalsgard, J. 1996, A&A, 312, 463
- (10) Petersen, J.O., & Høg, E. 1998, A&A, in press
- (11) Poretti, E. 1994, A&A, 285, 524
- (12) Poretti, E., & Antonello, E. 1988, A&A, 199, 191
- (13) Poretti, E., Antonello, E., & LeBorgne, J.F. 1990, A&A, 228, 350
- (14) Poretti, E., & Mantegazza, L. 1992, The Messenger, 68, 33
- (15) Powell, J.M., Joner, M.D., & McNamara, D.H. 1990, PASP, 102, 1131
- (16) Rodríguez, E., Rolland, A., López de Coca, P., Garcia–Lobo, E., & Sedano, J.L. 1992, A&AS, 93, 189
- (17) Rodríguez, E., Rolland, A, López de Coca, P., & Martin, S. 1996, A&A, 307, 539
- (18) Romano, G. 1973, IBVS 854
- (19) Vaniĉek, P. 1971, ApSS, 12, 10
- (20) Welch, D.L. et al. 1995, in Astrophysical Applications of Stellar Pulsation, ed. R.S. Stobie & P.A. Whitelock, A.S.P. Conf. Series., Vol. 83, 232


| Photoelectric | Loiano CCD | Hintz & Joner CCD | |||||||
|---|---|---|---|---|---|---|---|---|---|
| Term | |||||||||
| [cd-1] | [mag] | [rad] | [mag] | [rad] | [mag] | [rad] | |||
| = 5.134915 | 0.1820.002 | 3.190.01 | 0.1650.001 | 3.050.01 | 0.1590.001 | 3.190.01 | |||
| 2 | 0.0320.002 | 2.620.06 | 0.0320.001 | 2.460.03 | 0.0270.001 | 2.800.04 | |||
| 3 | 0.0190.002 | 3.340.09 | 0.0180.001 | 2.990.05 | 0.0120.001 | 3.480.09 | |||
| 4 | 0.0050.002 | 4.530.35 | 0.0080.001 | 3.480.12 | 0.0040.001 | 4.730.29 | |||
| = 6.409439 | 0.0120.002 | 0.510.16 | 0.0160.001 | 4.570.06 | 0.0130.001 | 1.200.08 | |||
| 12.5040.001 | 12.5040.001 | 0.38150.001 | |||||||
| Residual rms | 0.018 mag | 0.007 mag | 0.009 mag | ||||||
| 204 | 134 | 182 | |||||||
| (HJD) | 2446639.2526 | 2447036.5840 | 2449621.5182 | ||||||
| Term | |||
|---|---|---|---|
| [cd-1] | [mag] | [rad] | |
| = 15.5528 | 0.2700.003 | 2.660.02 | |
| 2 | 0.0980.003 | 2.790.05 | |
| 3 | 0.0390.004 | 2.720.14 | |
| 4 | 0.0140.003 | 3.390.39 | |
| 2.8090.002 | |||
| Residual rms | 0.014 mag | ||
| 81 | |||
| (HJD) | 2450062.050 | ||