The expansion of Cassiopeia A as seen in X-rays
Abstract
We have for the first time measured the overall expansion rate of the supernova remnant Cas A as seen in X-rays using ROSAT and Einstein HRI images with time differences up to almost 17 years. The overall expansion timescale of Cas A is found to be yr. This is significantly shorter than the timescale based on high resolution radio data. Although the results clearly indicate that Cas A is not anymore in the free expansion phase, the discrepancy between the radio and X-ray timescales cannot be easily understood. Furthermore, the expansion rate is incompatible with that predicted by a self-similar model for a supernova remnant ploughing through the wind of its progenitor.
Key Words.:
ISM: individual objects: Cas A – ISM: supernova remnants – X-rays: interstellar1 Introduction
The bright galactic radio source Cassiopeia A (Cas A) is believed to be the supernova remnant (SNR) of a massive star with a zero age main sequence mass in excess of 20M⊙. The progenitor probably evolved into a Wolf-Rayet star type WN8 (Fesen et al. Fesen87 (1987)). Since Cas A is also the youngest known galactic SNR, studying this object potentially reveals important facts about the evolution, circumstellar medium and core collapse of its progenitor and, consequently, about massive stars in general. Spectroscopic data (Chevalier & Kirshner ChevK78 (1978), ChevK79 (1979)) show that the remnant’s blast-wave is ploughing through the helium and nitrogen enriched wind of the progenitor. A recent estimate of the swept-up and ejected mass based on the X-ray emissivity amounted to and , respectively (Vink et al. VKB96 (1996)). The ratio of the two indicates that Cas A is presumably not anymore in its free expansion phase, but rather in a transition phase between the reverse-shock dominated phase and the adiabatic or Sedov phase of its evolution.
The best way to verify the dynamical status of Cas A is to measure the current expansion rate of Cas A. This has been done in the optical (van den Bergh & Kamper vdBergh83 (1983)) and in the radio (Tuffs Tuffs (1986), and Anderson & Rudnick AR95 (1995) – hereafter AR95 –) with different results. AR95 reported an expansion timescale of yr for the radio knots and yr for the diffuse component, whereas the optical expansion time indicates an explosion date of AD . These results seem contradictory, but the optical knots consist of high density gas ( cm-3) and suffer little deceleration. Furthermore, the optical knots comprise only a small (M⊙) fraction of the total mass of the remnant. So the optical expansion of Cas A gives us important information on the age of Cas A, but little on the dynamical status. The radio emission, on the other hand, is associated with the relativistic electrons and magnetic fields, rather than the bulk mass of Cas A. The most direct handle on the dynamical status of Cas A comes from the emission closely associated with the bulk mass of Cas A, i.e. the X-ray emission from the shock heated gas.
Some kinematical information based on the X-ray emission has already been provided by Doppler shift measurements of X-ray line complexes implying an expansion asymmetry between the Northwest and Southeast parts of the remnant with a velocity difference of 1500 km/s (Markert et al. Markert (1983), Holt et al. Holt (1994), Vink et al. VKB96 (1996)). The interpretation of the data is not clear: are we dealing here with bipolar mass ejection, a ring-like morphology (Markert et al.) or small but measurable deviations from spherical symmetry? Vink et al. (VKB96 (1996)) reported a velocity line broadening of 4000 km/s, but it was later found that the ASCA SIS0, the instrument used to measure the broadening, suffered from a somewhat degraded spectral resolution. So km/s should be regarded as an upper limit to the actual line broadening (Vink et al. VKB97 (1997)).
Here we present a direct measurement of the angular expansion of Cas A in X-rays over an interval of almost 17 years.
2 Data and Method
2.1 The data
| ID | Satellite | begin date | end date | exposure |
|---|---|---|---|---|
| d/m/y | d/m/y | (ks) | ||
| 713 | Einstein | 08/02/1979 | 08/02/1979 | 42.5 |
| 10139 | Einstein | 22/01/1981 | 23/01/1981 | 25.6 |
| 150086 | ROSAT | 29/07/1990 | 29/07/1990 | 8.0 |
| 500444 | ROSAT | 23/12/1995 | 01/02/1996 | 180.4 |

Our measurement of the expansion of Cas A is based on archival data of the ROSAT High Resolution Imager (RHRI) and the Einstein HRI (EHRI). Table 1 gives an overview. A detailed description of the RHRI and some information on the EHRI can be found in David et al. (David (1997)). For the EHRI one can consult Giaccconi et al. (Giacconi (1979)). Both instruments are microchannel plate detectors and are similar in design; they were in fact built by the same hardware group.
The instruments have a spatial resolution of 4″ FWHM, but the EHRI point spread function has broader wings. Note that the actual resolution of both instruments may be slightly worse due to time dependent residual errors in the aspect solutions, which are of the order 1″. The point spread function does not vary within off-axis angles of 5′, which is twice the radius of Cas A. Consequently, off-axis effects are not important for our analysis. The energy responses of the instruments are different as can be seen in Fig. 1. The interstellar column density towards Cas A is large, so most of the photons with energies below 1 keV are absorbed. This implies that most detected photons have energies between 1 and 2 keV, but the EHRI image has an additional contribution from photons with energies up to 4 keV. As for differences in plate scale, a study of M31 sources showed that 1 RHRI pixel = EHRI pixel, 1 RHRI pixel being (David et al. David (1997)).
The data we used were in the form of photon lists which have already been subjected to a basic reduction process. From these photon lists we made images which were converted to the coordinate system of the 1995/96 RHRI image. After conversion the images were rebinned by a factor of 4 to a nominal pixel size of 2″, so we oversample the resolution with a factor 2 to 3, compliant with Nyquist’s criterion.
We corrected the long exposure of 1995/96 for the fact that it actually consists of many single exposures. The problem is that the attitude reconstruction of ROSAT is about 6″. By matching the images of the individual exposures we improved the quality of the combined image. However, because we only used exposures longer than 5 ks, our final image consists of 95 ks instead of 180 ks of data. The rms spread in the attitude corrections was about 1.5″. The procedure used for matching images was similar to the procedure for measuring expansion, which is described below.
2.2 The method
The expansion of Cas A in X-rays can be qualitatively seen easily by blinking the EHRI and the RHRI 1995/96 images In fact, due to the differences in plate scale, the actual expansion is even larger than viewed in this way. Our method of measuring the expansion is straightforward: we scale the latest image in such a way that no expansion between the two images is discernible anymore. Thereby we neglect small scale changes such as those occurring in individual knots.
Instead of judging by eye whether two images match after rescaling one image, we used the maximum-likelihood method for a poissonian distribution (Cash Cash (1979)) to see if the two images match. The main advantage of the maximum-likelihood method over a fitting is that the latter assumes that the number of counts per pixel has a gaussian distribution, whereas the maximum-likelihood method can be used for arbitrary distributions. The maximum-likelihood method for a poissonian distribution involves the maximization of the so called statistic. The difference in the statistic (also called the log likelihood ratio) for different parameter values has a distribution (Cash Cash (1979)).
In all cases we use the RHRI 1995/96 image as the model image. We can neglect the statistical errors introduced by the model image, since it is statistically far superior to any of the images used for comparison. For example, the second best image from a statistical point of view is the Einstein image from 1979 which has a total number of photons a factor 7 less than the model image. So the average statistical error per pixel is entirely dominated by the other images. Moreover, as we shall indicate below, the systematic errors dominate the statistical errors.
In addition to fitting an expansion factor, we also fitted the attitude correction, which includes an image rotation, and an additional uniform background level. The level of this uniform background can be determined empirically by introducing it as a free parameter, provided all pixel values of the model image remain positive as required for the likelihood analysis. As can be seen in Table 2 this condition was met in all three cases. All corrections were only applied to the model image (the RHRI 1995/96 image); this image was rescaled, shifted and rotated using a method described in Parker (Parker (1994)): each new pixel value is based on a linear interpolation of the 4 nearest pixels. The model image was normalized in such a way that it contains the same number of counts as the images used for comparison. In order to reduce poisson noise from the model image we smoothed the image with a gaussian filter with ″. This hardly influences the resolution of the model image. The best fit expansion rate was barely influenced by the smoothing procedure.
In principle it is also possible to optimize for the expansion center. However, there is a correlation between the expansion center and the attitude correction, so they cannot be fitted independently. For this reason the expansion center was fixed to the expansion center found by Reed et al. (Reed (1995)) to be the best fit to the position/velocity distribution of optical knots ( , ). We experimented with other expansion centers compiled by Reed et al. (Reed (1995)) and found that the expansion factors were very little affected by our choice of the actual expansion center (the expansion rate changed by less than ). The expansion was evaluated within a given region of the image; the region could be either a circle or a polygon.
The optimization of the likelihood was done by scanning the relevant parameter space in increasingly smaller steps. By applying this method in an iterative way we tried to circumvent potential local maxima.
3 The expansion of Cas A
| Dates | background | ||||||
|---|---|---|---|---|---|---|---|
| (yr) | (%) | (yr) | (pixel) | (pixel) | counts/pixel | ||
| 79 - 95/96 | 16.97 | ||||||
| 81 - 95/96 | 14.98 | ||||||
| 90 - 95/96 | 5.44 |
With our method we measure the expansion factor, , which is just the ratio of the sizes of two images. The physically more interesting parameter is the expansion timescale, , which would be the age of the remnant in case no deceleration had taken place. The relation between the two is:
| (1) |
where denotes the plate scale ratio (0.995 in case an EHRI image is compared to a RHRI image) and is the time difference between the two exposures. As is clear from this equation an error in weighs more heavily when is close to 1.
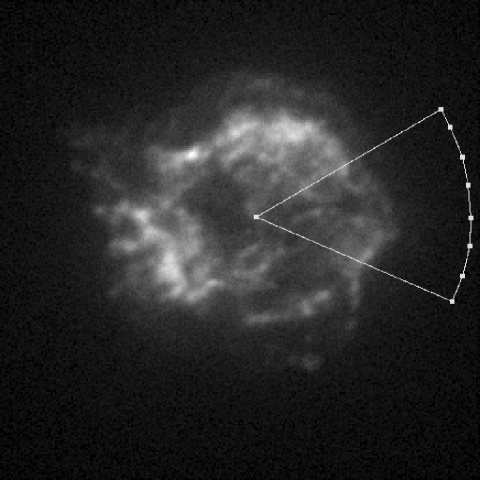
Fig. 2 (right) shows the region of the image used for determining the expansion. In Table 2 we list the values for and the expansion time scales for each time interval. In case images of two different instruments are compared we have to ensure that the different detector characteristic (such as shown in Fig. 1) do not affect the estimate of the expansion timescale significantly. We tested this using the following method.
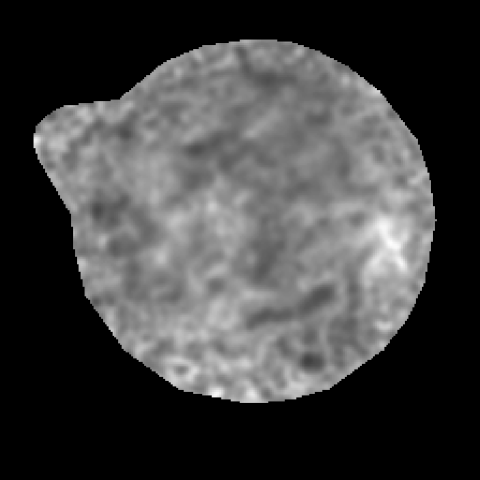
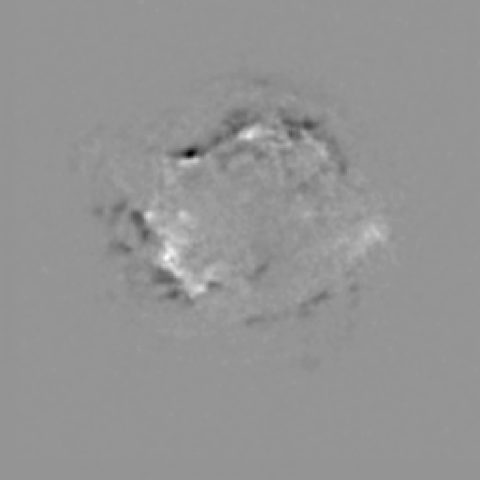
If we know the expansion age of Cas A we can, by correcting the Einstein image for the expansion, estimate the differences of the response of the two detectors to the emission of Cas A. We do not know the exact expansion properties of Cas A, but we do have the best fit values listed in Table 2. So by correcting for the expansion we can obtain a, first order, quantitative estimate of the effect of different detector properties on the exposure of Cas A. We have visualized these differences by dividing the combined Einstein images by the 1995/96 RHRI image on a pixel by pixel basis. In order to reduce the poisson noise we smoothed the images with a gaussian with . The resulting ratio image is shown in Fig. 2 (right). Most of the structure seen in the ratio image is now allegedly arising from differences in detector responses to the spectral characteristics of the X-ray emission of Cas A and to possible efficiency variations in the detectors. The absence of ring-like structures in the ratio image indicates that we have corrected adequately for the expansion of Cas A. Note that the most salient feature in the ratio image, the high ratio in the West, can be attributed to the fact that the interstellar absorption peaks in the West of the remnant as OH and HI absorption studies indicate (Bieging & Crutcher Bieging (1986), Schwarz et al. Schwarz (1997); see also Keohane et al. Keohane (1996)).
To assess the potential sensitivity of our result to the differences displayed in Fig. 2, we corrected the model image with these ratio’s and repeated the expansion measurements for this revised model. Although some interdependence is now present in the image comparison, this procedure is legitimate to bring out the influence if systematic effects due to relative differences in the instrumental response functions. If we determine the expansion age of Cas A using our revised model, we find expansion rates that do not differ more than 10 yr from our best fit expansion rates. From this we conclude that the systematic error caused by different instrument characteristics is . An additional systematic error is the uncertainty in the plate scale which is . Combining the two systematic errors we find that the total systematic error in the expansion age in case an EHRI image is involved is of the order of yr. This means that systematic errors dominate the statistical errors. From now on we will always include estimates of systematic errors.
Table 2 lists the individual expansion measurements. Our overall best fit value for the expansion age of Cas A is (for the epoch 1996). This value is a weighted average of the three uncorrected measurements, with the weight being the value including a 19 yr systematic error for the expansion ages determined by a comparison between a ROSAT and an Einstein HRI image. Note that, although the three measurements are not completely independent since they involve the 1995/96 image, our approach is again justified by the superior statistical quality of the 1995/96 image. The expansion age corresponds to an expansion rate of %yr-1. If we adopt a distance to Cas A of 3.4 kpc (Reed et al. Reed (1995)), the expansion age translates into a velocity of km/s for the bright ring at a radius of 110″. The inferred velocity of the blast wave at a radius of about 160″ is km/s.
The expansion age of 501 yr is remarkable in the sense that it is significantly lower than the expansion age found in the radio (see AR95). The average expansion timescale of all radio knots was found to be yr, for the subsample of faint knots AR95 derived yr (for the epoch 1987). An expansion age comparable to the latter value was derived for the diffuse radio emission. However, AR95 reported substantial variation of the expansion timescale with azimuth. Their shortest timescales, i.e. the timescales of the Eastern and Southeastern sectors, are consistent with our overall expansion timescale. Furthermore, in X-rays the Western region is relatively faint, whereas in the radio it is the brightest region. So there may be a bias in the radio measurements towards the Western region and a bias in our measurement towards the expansion of the Eastern region.
We also searched for variations in the expansion with azimuthal angle. We found that, except for the Western region, all expansion timescales were consistent with the overall expansion timescale within the errors. The sectors for doing the measurements were chosen to be similar to the sectors used by AR95, i.e. we used 6 sectors each spanning 60∘. For the Western region (sector V in AR95) we found for and a weighted average of for the time intervals involving the EHRI. In this case a correction for the instrumental efficiencies was applied. All parameters except the expansion factor were fixed to the appropriate values listed in table 2. The expansion timescale is much larger for a comparison between the EHRI images and the 1995/96 image if we do not correct for the differences in instrumental efficiencies, namely a weighted average for measurements involving the EHRI of and a total weighted average of . So, unfortunately, the effect of the differences in detector characteristics is largest for the Western region making the measurement unreliable (c.f. Fig. 2 right). So we have an indication that the Western region is expanding more slowly than the rest of the remnant, although the evidence based on the X-ray emission alone is not conclusive. A measurement of the overall expansion timescale of Cas A excluding the Western region gives yr.
4 The dynamics of Cas A
4.1 The discrepancy between the X-ray and radio measurements
Our measurement of the expansion age of Cas A is significantly shorter than the expansion age derived from proper motion measurements of compact radio features, although we should, as pointed out, beware of biases caused by the different morphologies of the radio and X-ray image. As put forward in the introduction, the advantage of an X-ray determination of the expansion rate over a measurement based on the compact radio features is that the bulk of the mass radiates in X-rays, whereas the compact radio features are associated with the magnetic fields and relativistic electrons. This does, however, not mean that we can easily discard the radio data for that reason, as the compact radio features, some of which show remarkable resemblance to bow shocks, can be comprehensively described as ejecta with a higher than average density and moving supersonically through diffuse X-ray emitting gas (Anderson et al. Anderson (1994), AR95). This means that it is expected that the diffuse gas is moving more slowly than these compact features. Clearly, our measurement is at odds with this interpretation. However, the kinematics of the Western region in the radio band do display phenomena that are not easily explained by a simple dynamical model. For instance, the compact radio features in the Western region show large deviations from a radially outward motion. Some features even display an inward motion (Anderson et al. Anderson (1994)). Such deviations do bias the expansion rate of the radio features towards a longer timescale, but at the moment we lack a clear understanding of this phenomenon. Another peculiarity which is hard to understand from the point of view of the overall dynamics of Cas A is a small but significant net acceleration of the radio features towards the North. So our understanding of the compact radio features is still incomplete. The discrepancy between our expansion rate and the expansion rate based on the compact radio features certainly deserves serious future attention. We therefore concentrate on the implications of the shorter expansion timescale for the dynamics of Cas A derived from the analysis presented here.
4.2 The reverse-shock model
The explosion leading to Cas A probably took place in 1680, that is if one assumes that the 6th magnitude star observed by Flamsteed was indeed the supernova (Ashworth 1980). Although there are some problems with this identification, this explosion date is supported by the kinematics of the subset of fast moving optical knots which are probably least decelerated (Fesen et al. 1987). So we assume that in 1996, the year of the last RHRI observation of Cas A, the remnant was 316 yr old. Combining this with our overall expansion timescale of 501 yr we arrive at a deceleration parameter of (the ratio of the true age over the expansion age). The deceleration parameter equals the ratio of the current velocity over the average velocity. To put this value in a simple theoretical framework we refer to the self-similar hydrodynamical model of Chevalier (Chev82 (1982)). The Chevalier model includes a blast-wave and a reverse-shock. The model assumes that the density profile of the unshocked gas is distributed as for the ejecta component and for the circumstellar medium with and as free parameters. Optical spectroscopy (Chevalier & Kirshner ChevK78 (1978), ChevK79 (1979)) indicates that Cas A is expanding into the wind of its progenitor, which implies . For type II supernovae the density distribution of ejecta is probably rather steep, , but for more compact stars, such as the Wolf-Rayet star that was the progenitor of Cas A, the density distribution may be less steep.
The radius of the contact discontinuity between ejecta and circumstellar matter evolves in the Chevalier model as . The case corresponds to the Sedov (Sedov (1959)) evolution and does not correspond to any physical solution. The deceleration parameter for the Chevalier model is . So for and the observed value of we need which is very close to the Sedov solution. However, if taken literally it would mean that Cas A is blast-wave instead of reverse-shock dominated as generally believed. One can of course assume that is a reasonable but not quite good representation of the structure of the circumstellar medium around the progenitor. For example, gives , which gives a valid Chevalier model, but lacks the conceptual simplicity of a model. Another assumption of the Chevalier model that may not be valid is the power law density distribution of the ejecta. Only the outer layers of ejecta are thought to have a distribution well represented by a power law. If, however, a substantial fraction of the ejecta has already been shocked, then the evolution of Cas A has entered a phase for which the Chevalier model is not applicable anymore. The fact that for we arrive at a solution close to the Sedov model may indeed indicate that Cas A is in a transition phase from a reverse-shock dominated to a blast-wave dominated (Sedov) phase. A model in which most of the ejecta have already been shocked is in agreement with the mass ratio of the swept up and ejected mass proposed by Vink et al. (1996). Note that also the X-ray spectrum of Cas A cannot be well described by a Chevalier model because the model implies a much larger ratio between the reverse-shock and blast-wave temperatures than observed (Jansen et al. 1988, Vink et al. 1996). A Chevalier model provides a better fit to the X-ray spectrum, but has as the drawback that we know that Cas A is moving through the wind of its progenitor.
Apart from the ejecta density distribution the circumstellar medium may also be more complicated than assumed by the Chevalier models. Indeed, two recent numerical models indicate that the the circumstellar medium may include a dense shell of material originating in the red supergiant phase of the progenitor and swept up by the fast wind of the Wolf-Rayet star (García-Segura et al. GLM96 (1996) and Borkowski et al. Bork96 (1996)). The study by Borkowski et al. (Bork96 (1996)) was made in order to reproduce the expansion rate of Cas A as observed in the radio (AR95) which, however, may not be the correct value as this study indicates. The possible existence and position of such a shell (it may also reside outside the current blast-wave) can provide valuable information about the detailed history and properties of the progenitor, as shown by García-Segura et al. (GLM96 (1996)). However, the numerical models are too specific to see how our result would change their conclusions.
4.3 An encounter with a molecular cloud?
Both numerical models do not pay attention to inhomogeneities that may have led to a possible slower expansion of the Western region or to the differences in expansion velocities of the optical knots between the front and the back of the remnant (Reed et al. Reed (1995)). An explosion in an off-center bubble is a possibility (Reed et al. Reed (1995)). The asymmetry of the bubble may be caused by existing inhomogeneities in the interstellar medium. Another interesting and possibly related suggestion (Keohane et al. Keohane (1996), AR95) is that in the West Cas A is interacting with a molecular cloud seen in OH absorption towards Cas A (Bieging & Crutcher Bieging (1986)). This is the same cloud that is probably responsible for the relative hardness of the Western region seen in Fig. 2. In the case of an interaction with a molecular cloud it is expected that the Western region would be relatively bright. This is in fact the case when the X-ray emission is corrected for the absorption towards Cas A (Keohane et al. Keohane (1996)) which varies strongly over the remnant.
5 Conclusion
This is the first study of the expansion rate of Cas A as seen in X-rays. A similar study was done for Tycho’s SNR (Hughes Hughes97 (1997)) using a somewhat different method. Measuring the expansion timescale of a SNR in X-rays has one major advantage over similar studies in the radio and the optical bands: the X-ray emission is directly connected to the bulk mass of SNRs.
We have found an overall expansion timescale of yr corresponding to an expansion rate of %yr-1. The optical expansion timescale is shorter, namely of the order of 340 yr. This can be easily understood, since the optical knots consist of dense gas which is expected to be less decelerated than the bulk of the ejecta. More intricate is the discrepancy between our expansion timescale and the expansion timescale based on the compact radio features ( yr), since also these radio features are thought to be the marks of denser gas moving through a more diffuse medium. This explanation is clearly not in agreement with our expansion timescale as we discussed in the previous paragraph. However, we lack a coherent picture of the dynamics of the compact radio features. Furthermore, as we already pointed out, the radio image is brightest in the West of Cas A, whereas at the photon energies where the ROSAT and Einstein HRI are most sensitive Cas A is brightest in the East. This may have caused different biases in the radio and X-ray measurements.
An expansion timescale of 501 yr means that the standard reverse-shock Chevalier (Chev82 (1982)) model for a SNR moving through the wind of its progenitor is not applicable to Cas A. It either means that Cas A is in a transition phase between the reverse-shock dominated and the blast-wave dominated phase or it means that the situation is too complex to be well described by simple analytical SNR models.
In the near future high spatial resolution images of Cas A obtained with AXAF will be able to improve the existing measurements. Meanwhile there are other outstanding issues concerning the dynamics of Cas A such as the front back asymmetry of optical knots (Reed et al. Reed (1995)) and the North/South asymmetry in the Doppler shifts observed in the X-ray spectra (Markert et al. Markert (1983)). Together with the expansion rate these facts should ultimately be incorporated into a complete three dimensional dynamical model of Cas A.
Note. During the refereeing process a preprint appeared with a similar measurement as presented in this paper (Koralesky et al. Koralesky (1998)). Their results confirm our analysis.
Acknowledgements.
We thank Lucien Kuiper, Frits Paerels and Karel van de Hucht for useful information and discussions. This research has made use of data obtained through the High Energy Astrophysics Science Archive Research Center Online Service, provided by the NASA/Goddard Space Flight Center and the ROSAT Archive at the Max Planck Institut für Extraterrestische Physik. This work was financially supported by NWO, the Netherlands Organization for Scientific Research.References
- (1) Anderson M.C., Jones T.W., Rudnick L., et al., 1994, ApJ 421, L31
- (2) Anderson M.C., Rudnick L., 1995, ApJ 441, 307 (AR95)
- (3) Ashworth W.B., 1980, J. Hist. Astr., 11, 1
- (4) Bieging J.H., Crutcher R.M., 1986, ApJ 310, 853
- (5) Borkowski K., Zymkowiak A.E., Blondin J.M., Sarazin C. L., 1996, ApJ 466, 866
- (6) Cash W., 1979, ApJ 228, 939
- (7) Chevalier R.A., 1982, ApJ 258, 790
- (8) Chevalier R.A., Kirshner R.P., 1978, ApJ 219, 931
- (9) Chevalier R.A., Kirshner R.P., 1979, ApJ 233, 154
- (10) David L.P., Harnden F.R., Kearns K.E., et al., 1997, “The ROSAT HRI Calibration Report”, U.S. ROSAT Science data center/SAO, Harvard USA
- (11) Fesen R.A., Becker R.H., Blair W.P., 1987, ApJ 313, 378
- (12) García-Segura G., Langer N., Mac Low M.-M., 1996, A&A 316, 133
- (13) Giacconi, R., Branduardi, G., Briel, U., et al., 1979, ApJ 230, 540
- (14) Holt S.S., Gotthelf E.V., Tsunemi H., Negoro H., 1994, PASJ 46, L15
- (15) Hughes J., 1997, in “X-ray Imaging and Spectroscopy of Cosmic Hot Plasmas”, Eds. F.Makino and K. Mitsuda, Universal Academy Press, Tokyo.
- (16) Jansen F.A., Smith A., Bleeker J.A.M., et al., 1988, ApJ 331, 9
- (17) Koralesky B., Rudnick L., Gotthelf E.V., Keohane J.W., 1998, submitted to ApJL
- (18) Keohane J.W., Rudnick L., Anderson M.C., 1996, ApJ 466, 309
- (19) Markert T.H., Canizares C.R., Clark G.W., Winkler P.F., 1983, ApJ 268, 13
- (20) Parker J.R., 1994, “Practical Computer Vision using C”, John Wiley & Sons, Inc., New York
- (21) Reed J.E., Hester J.J., Fabian A.C, Winkler P.F., 1995, ApJ 440, 706
- (22) Sedov L., 1959, “Similarity and Dimensional Methods in Mechanics”, New York, Academic Press
- (23) Schwarz U.J., Goss W.M., Kalberla P.M.W., 1997, A&AS 123, 43
- (24) Tuffs R.J., 1986, MNRAS 219, 13
- (25) Van den Bergh S., Kamper K. W., 1983, ApJ 268, 129
- (26) Vink J., Kaastra J.S., Bleeker J.A.M., 1996, A&A 307, L41
- (27) Vink J., Kaastra J.S., Bleeker J.A.M., 1997, in “X-ray Imaging and Spectroscopy of Cosmic Hot Plasmas”, Eds. F.Makino and K. Mitsuda, Universal Academy Press, Tokyo.