The Metagalactic Ionizing Field in the Local Group
Abstract
We discuss the sources which are likely to dominate the ionizing field throughout the Local Group. In terms of the limiting flux to produce detectable emission ( phot cm-2 s-1), the four dominant galaxies (M31, Galaxy, M33, LMC) have spheres of influence which occupy a small fraction (%) of the Local Volume. There are at least two possible sources of ionization whose influence could be far more pervasive: (i) a cosmic background of ionizing photons; (ii) a pervasive warm plasma throughout the Local Group. The COBE FIRAS sky temperature measurements permit a wide variety of plasmas with detectable ionizing fields. It has been suggested (Blitz et al. 1996; Spergel et al. 1996; Sembach et al. 1995, 1998) that a substantial fraction of high velocity clouds are external to the Galaxy but within the Local Group. Deep detections are the crucial test of these claims and, indeed, provide a test bed for the putative Local Group corona. 111Invited talk, to appear in the Proceedings of the ESO/ATNF Workshop Looking Deep in the Southern Sky, 10-12 December 1997, Sydney, Australia, Eds. R. Morganti and W. Couch
1 Introduction
In keeping with this Workshop, we concentrate on what one can hope to learn, in the coming decade, from deep spectroscopic studies of diffuse line emission. Such techniques are now used by several groups in both hemispheres. (For progress to date, see Reynolds et al. 1997; Bland-Hawthorn 1997.) The spectroscopic methods (e.g. ‘staring’) achieve extremely deep levels (2) and can detect the presence of extremely weak ionizing fields.
To encourage a broader campaign of spectroscopic studies, we deduce the expected level of ionizing flux within the Local Group. We provide an inventory of possible sources, and discuss the prospect of a ubiquitous warm plasma. The discovery of such a medium would have fundamental implications:
A recent review of the cosmic baryon budget finds that a large fraction of ‘missing’ baryons may well be tied up in warm gas within galaxy groups (Fukugita, Hogan & Peebles 1998). To be consistent with weak x-ray detections (Pildis, Bregman & Evrard 1995), the diffuse gas needs to radiate predominantly at EUV wavelengths.
Such an ionizing field could render an HI cloud optically visible everywhere within the Local Group. A truly cosmic ionizing field could render the same cloud visible over cosmological distances (Circovic et al. 1998).
The existence of warm, tenuous gas in loose galaxy groups has important ramifications for the Ly forest at low redshift detected along QSO sight lines (Morris et al. 1991; Bahcall et al. 1991).
An intragroup medium would indicate the presence of Galactic fountains or winds, or even primordial gas dating back to the formation of the group. If confirmed, this medium is expected to radically influence the star-formation history of the Local Group (e.g. Dressler 1986; van den Bergh 1994).
2 The deepest spectroscopic detections
The deepest spectroscopic limits are achieved by Fabry-Perot ‘staring’. Several groups have shown what is possible with modern day optics and detectors (q.v., Bland-Hawthorn 1997). The power of the method comes from dispersing the light of a single emission line onto % of a wide area CCD. A hard experimental limit is about 1 mR (1) at 1Å resolution which is 8 mag below sky within that narrow band. This is close to the experimental limit of space-borne observations in broad optical bands (Vogeley 1998). Both broad and narrow band limits fall far below the zodiacal light level arising from interplanetary dust and gas.
For our deep limit, what is the corresponding ionizing flux? From the surface of an HI slab optically thick to ionizing photons, the emission measure is where is the thickness of the ionised region. The resulting emission measure for an ionizing flux is then () where . The 1 mR spectroscopic limit corresponds to an ionizing flux of less than 104 phot cm-2 s-1. To put this into perspective, this is the expected level of recombination emission from the interstellar medium within the Solar System due to the mean Galactic ionizing field (Reynolds 1984)!
3 Cosmic UV background
From non-detections towards extragalactic HI, the current best 2 upper limit (Vogel et al. 1995) for the universal ionizing background is 0.08 ( phot cm-2 s-1). is the ionizing flux density of the cosmic background at the Lyman limit in units of 10-21 erg cm-2 s-1 Hz-1 sr-1; () is the equivalent photon flux at face of a uniform, optically thick slab. The unexpectedly high number of Ly absorbers towards 3C273 gives 0.006 from the proximity effect (Kulkarni & Fall 1995), although this value is uncertain by at least a factor of 5. Sciama (1993; 1998) has suggested a somewhat stronger ionizing field permeates the Universe due to decaying tau neutrinos with masses 24 eV and lifetimes 1023 s.
4 An inventory of the Local Group
The Local Group is a member of the Coma-Sculptor Cloud within the Local Supercluster, a highly flattened structure extending over more than 10 Mpc (Tully 1988). Outside the Local Group, the closest structures are the Sculptor, Maffei/IC342, and M81 groups. While the Maffei group has the biggest dynamical influence on us, the Sculptor group is expected to produce the stronger ionizing field at the periphery of our group.
The Local Group has at least 40 members (see appendix; Tully 1988). More than 80% of the visual light emerges from the great rajahs, M31 and the Galaxy. This increases to 95% if we include M33 and the LMC. The remaining subjects are dwarf irregulars, spheroidals or ellipticals which congregate around the royal members, or form small associations near the edge of the group. For convenience, we define the Local Volume as a sphere extending to 1 Mpc radius from the Local Group barycentre (LGB). 222R.B. Tully (1998, private communication) points out that a criterion for group membership requires total or continuing collapse towards the common potential of the group. However, the distances, space motions, and the underlying mass distribution are not well enough known to be sure of which of the outermost objects are bound.
4.1 Young stars
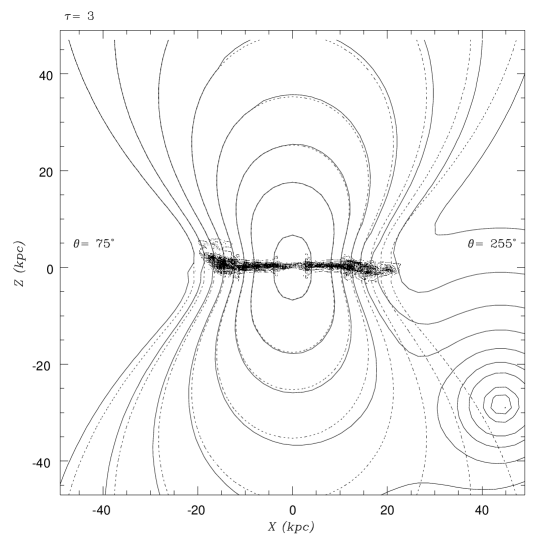
Our model of the ionizing background in the Local Group includes the poloidal radiation fields of the Galaxy, M31 and M33. The Galaxy halo includes the contribution from the LMC (see Fig. 1). To a good approximation, the UV radiation field arising from an opaque, stellar disk is given by (Bland-Hawthorn & Maloney 1998; hereafter BM)
| (1) |
The polar angle () is measured from the spin axis, is the radius in units of 100 kpc, and the Lyman limit optical depth is . In order to explain Magellanic Stream detections and OB star counts, our model favours and for the Galaxy. For the purposes of this Workshop, the ionizing fields for M31 and M33 are arbitrarily scaled with respect to the Galaxy by their blue luminosities for the same opacity. This crude assumption may well be flawed since the evolutionary histories of these galaxies could be quite different.
While the ionizing fields are expected to be weak, we include the contribution of the dwarfs for completeness. Deep HI surveys may have found gas linked to dwarf galaxies (q.v., Young & Lo 1997) and even a very weak field could render such gas optically visible. Deeper surveys already in progress are expected to turn up more HI associations (Staveley-Smith et al. 1996; Briggs et al. 1997).
For the dwarf irregulars, on-going star formation appears confined to the outermost systems, DDO 210 and Phoenix, which may be evidence enough for a diffuse medium throughout the Local Group. The lack of star formation in the more central dwarfs is a possible manifestation of ram-pressure stripping (van den Bergh 1994; Hirashita, Kamaya & Mineshige 1997).
In dwarf spheroidals, there is evidence for a ‘UV upturn’ presumably from horizontal branch (HB) stars. In ellipticals (and S0s), the ‘UV upturn’ population are thought comprise hot HB, post-HB star and post-AGB stars (Dorman 1997; Brown et al. 1997). Our model includes a weak isotropic source for each of the dwarf irregulars and spheroidals.
4.2 Galactic coronae
The depth of x-ray shadows observed towards high-latitude gas clouds is consistent with a 0.25 keV patchy coronal halo encompassing the Galaxy (Burrows & Mendenhall 1991; Snowden et al. 1991; Snowden, McCammon & Verter 1993). Soft x-ray haloes are also observed in a significant fraction of spirals (Bregman & Pildis 1994; Vogler, Pietsch & Kahabka 1996; cf. Kim et al. 1996).
To explore the effect of a hot galactic corona, we assume that the gas distribution is described by a non-singular isothermal sphere, with a density law
| (2) |
where is the core radius and is the core gas density. For hot gas temperatures keV, the emission is dominated by thermal bremsstrahlung. Only photons in the energy range 13.6 eV to 250 eV are important to the ionization state of the gas for the column densities of relevance here. The ionizing photon flux on the inner face of a cloud at radius (for ) in kpc is given by (BM)
| (3) |
where 10 cm-3 is the core gas density. For an optically thin Galactic disk, ; when the disk is completely opaque to ionizing photons, , which reduces the ionizing photon flux by less than a factor of two.
For the Galaxy, absorption lines towards stars in the Magellanic Clouds have been used to infer coronal temperatures and gas densities; for example, Songaila (1981) estimates keV and cm-3. We adopt , n, and assume keV, the virial temperature of the Galactic halo (for an assumed circular velocity of 220 km s-1). This density and temperature distribution matches the emission measure and x-ray luminosity of the diffuse component determined by Wang & McCray (1993).
At such low temperatures ( 2), eq. 3 does not include the strong EUV ionizing lines produced by the gas, and therefore considerably underestimates the true photon flux. We estimate the increase in the effective emissivity using Table 4 in Gaetz & Salpeter (1983). Representative correction factors are 28 ( keV) and 55 ( keV). The cooling time for the gas is yrs. At the lower temperature, the expected ionizing flux at 20 kpc radius is phot cm-2 s-1.
4.3 Local Group corona
The extremely accurate blackbody form of the cosmic microwave background (CMB) sets an important constraint on an ionised intergalactic medium. The presence of a hot plasma distorts the microwave background through Compton scattering of the CMB photons (Sunyaev & Zel’dovich 1969).
The departures from blackbody are quantified by the -parameter such that
| (4) |
where is the Thomson scattering cross section and is the electron mass. The integration is performed over the time taken for the photon to traverse the ionised medium. In most cases, is much greater than the radiation temperature . The expected temperature decrement is then
| (5) |
where is the electron column at an angle () to the LGB sight line. The multipoles, after expanding the sky temperature in spherical harmonics as a function of angular position, are easily derived (Suto et al. 1996). The monopole term reduces to
| (6) |
where is the central density of the Local Group corona, is the distance of the Galaxy from the centre, is the core radius of the corona, and .
The COBE FIRAS data (Mather et al. 1994) imply that the Compton -parameter is less than (95% confidence level). The upper limit translates to (Suto et al. 1996)
| (7) |
We adopt an identical form to eq. 3 for the Local Group flux, and associate with such that
| (8) |
for which
| (9) |
The angular term is well behaved, with a value of 0.94 towards LGB, peaking at 1.2 near , falling to 0.75 at Suto’s canonical value of , and to zero beyond here.
After Suto, we adopt kpc as characteristic of the Local Group, although we use a slightly higher value of cm-3 for the central density (Pildis & McGaugh 1996). The correction factors in 4.2 lead to high values for the upper limit above, viz. ( keV) and phot cm-2 s-1 ( keV) at .
The Compton limit does not provide a strong constraint. The quadrupole anisotropy from COBE (Bennett et al. 1994) is more restrictive by a factor of ten on the product (Suto et al. 1996, eqn. 9) compared to eqn. 7. (For Hickson groups, Pildis & McGaugh restrict this product by another order of magnitude.)
However, for our adopted parameters, the product is typical of spiral groups (Pildis & McGaugh 1996) where keV. Furthermore, the expected ionizing flux out to 500 kpc (eqn. 3) falls in the range .
5 Discussion
If the 3C 273 sight line is representative of the present day Ly forest, the Galaxy and M31 () dominate the cosmic ionizing field out to at least 700 kpc along the polar axis. This is an order of magnitude smaller than the scale of typical galaxy separations at the present epoch. Although, after orienting the galaxies correctly with respect to the supergalactic plane, we find that while the Galaxy-LMC and M31-M33 pairs may experience significant levels of mutual ionization, this is not expected for the Galaxy-M31 pair.
The galactic ionizing fields are highly elongated for our assumed dust opacity (eq. 1). Only a small fraction of the Local Volume (%) is influenced by the stellar UV field. At large galactocentric radius, there exists a toroidal shadow region close to the galactic plane (BM). Within this region, the galactic coronal emission, , could well exceed .
The COBE sky temperature measurements permit a Local Group corona which produces detectable levels of UV flux. The cooling time of the gas is yrs and therefore would need to be replenished (e.g., ram pressure stripping, galactic winds). If confirmed, there are some interesting consequences for : (i) attempts to measure the truly cosmic UV background directly (e.g., Henry 1996) cannot be made from our vantage point; (ii) constraints on from emission (e.g., Vogel et al. 1995) require HI clouds which are not associated with galaxy groups.
More than half of all galaxies reside within small groups, and spirals dominate these groups. Could pervasive coronal emission in galaxy groups explain truncated HI disks in spiral galaxies (cf. Maloney 1993)? Could this same medium explain the unusual ionization conditions observed along sight lines towards extragalactic sources (Sembach et al. 1998)?
Several authors have suggested that some fraction of HVCs, particularly the more compact clouds, are external to the Galaxy (Blitz et al. 1996; Spergel et al. 1996; Sembach et al. 1995, 1998). non-detections towards these clouds would argue for the extragalactic model, and against the pervasive intragroup corona, in which case the clouds could be used to set hard limits on the cosmic ionizing field.
Acknowledgments We are indebted to P.R. Maloney for use of unpublished results arising from collaborations, and to R.B. Tully, G. Da Costa and B. Dorman for their insights.
References
- [1] Bahcall, J.N. et al. 1991, ApJ, 377, L5
- [2] Bennett, C.A. et al. 1994, ApJ, 436, 423
- [3] Bland-Hawthorn, J. 1997, PASA, 14, 64
- [4] Bland-Hawthorn, J. & Maloney, P.R. 1998, ApJ, submitted (BM)
- [5] Blitz, L., Spergel, D.N., Teuben, P.J., Hartmann, D., and Burton, B. 1996, BAAS, 189, #61.01
- [6] Bregman, J.N. & Pildis, R.A. 1994, ApJ, 420, 570
- [7] Briggs, F.H., Sorar, E., Kraan-Korteweg, R.C. & van Driel, W. 1997, PASA, 14, 37
- [8] Brown, T.M. et al. 1997, ApJ, 482, 685
- [9] Burrows, D.N. & Mendenhall, J.A. 1991, Nature, 351, 629
- [10] Circovic, M.M., Bland-Hawthorn, J. & Samurovic, S. 1998, MNRAS, submitted
- [11] Dorman, B. 1997, In Nature of Elliptical Galaxies: Proceedings of the 2nd Stromlo Symposium, eds M. Arnabaldi, G.S. Da Costa & P. Saha, ASP. Conf. Series, 116, 195
- [12] Dressler, A. 1986, ApJ, 301, 35
- [13] Fukugita, M., Hogan, C.J. & Peebles, P.J.E. 1998, ApJ, submitted (astro-ph/9712020)
- [14] Gaetz, T.J. & Salpeter, E.E. 1983, ApJS, 52, 155
- [15] Henry, R.C. 1996, ARAA, 29, 89
- [16] Hirashita, H., Kamaya, H. & Mineshige, S. 1997, MNRAS, 290, L33
- [17] Kim, D.-W. et al. 1996, ApJ, 468, 175
- [18] Kulkarni, V.P. & Fall, M. 1995, ApJ, 453, 65
- [19] Maloney, P.R. 1993, ApJ, 414, 41
- [20] Mather, J.C. et al. 1994, ApJ, 420, 439
- [21] Morris, S.L. et al. 1991, ApJ, 377, L21
- [22] Pildis, R.A. & McGaugh, S.S. 1996, ApJ, 470, L77
- [23] Pildis, R.A., Bregman, J.N. & Evrard, A. 1995, ApJ, 443, 514
- [24] Reynolds, R.J. 1984, ApJ, 282, 191
- [25] Reynolds, R.J. et al. 1997, PASA, 15, 14
- [26] Sciama, D.W. 1993, QJRAS, 34, 291
- [27] Sciama, D.W. 1998, Modern Cosmology & The Dark Matter Problem, Cambridge University Press, 2nd. Ed.
- [28] Sembach, K.R., Savage, B.D., Lu, L. & E.M. Murphy, 1995, ApJ, 451, 616
- [29] Sembach, K.R., Savage, B.D., Lu, L. & E.M. Murphy, 1998, ApJ, submitted
- [30] Snowden, S.L., McCammon, D. & Verter, F. 1993, ApJ, 409, L21
- [31] Snowden, S.L. et al. 1991, Science, 252, 1529
- [32] Songaila, A. 1981, ApJ, 248, 945
- [33] Spergel, D.N., Blitz, L., Teuben, P.J., Hartmann, D., and Burton, B. 1996, BAAS, 189, #61.02
- [34] Staveley-Smith, L. et al. 1997, PASA, 13, 243
- [35] Sunyaev, R. & Zel’dovich, Ya.B. 1969, Comm. Astr. Spac. Phys., 4, 173
- [36] Suto, Y., Makishima, K., Ishisaki, Y & Ogasaka, Y. 1996, ApJ, 461, L33
- [37] Tully, R.B. 1988, Nearby Galaxies Catalog, (Cambridge University Press: New York)
- [38] van den Bergh, S. 1994, ApJ, 428, 617
- [39] Vogel, S. N., Weymann, R., Rauch, M. & Hamilton, T. 1995, ApJ, 441, 162
- [40] Vogeley, M.S. 1998, ApJ, submitted (astro-ph/9711209)
- [41] Vogler, A., Pietsch, W. & Kahabka, P. 1996, A&A, 305, 74
- [42] Wang, Q.D. & McCray, R. 1993, ApJ, 409, L37
- [43] Young, L.M. & Lo, K.Y. 1997, ApJ, 490, 710
Appendix A The Local Group
The Local Group has at least 40 members. Some of the outliers may not be bound to the group. The supergalactic coordinates (SGX,SGY,SGZ) are deduced from the NASA/IPAC Extragalactic Database.
| name | type | SGX | SGY | SGZ | |
|---|---|---|---|---|---|
| M31 | S | 0.68 | -0.30 | 0.17 | 10.48 |
| Galaxy | S | 0.00 | 0.00 | 0.00 | 10.30 |
| M33 | S | 0.71 | -0.43 | 0.00 | 9.78 |
| LMC | Irr | -0.03 | -0.02 | -0.03 | 9.48 |
| SMC | Irr | -0.04 | -0.04 | -0.01 | 8.85 |
| IC 10 | Irr | 0.58 | -0.06 | 0.19 | 8.70 |
| NGC 3109 | Irr | -0.66 | 0.59 | -0.89 | 8.48 |
| NGC 205 | E | 0.69 | -0.30 | 0.17 | 8.48 |
| M32 | E | 0.68 | -0.31 | 0.17 | 8.30 |
| NGC 6822 | Irr | -0.19 | -0.21 | 0.44 | 8.30 |
| WLM | Irr | 0.13 | -0.93 | 0.13 | 8.30 |
| NGC 404 | E | 2.15 | -1.15 | 0.27 | 8.30 |
| NGC 185 | E | 0.60 | -0.18 | 0.16 | 8.30 |
| Leo A | Irr | 0.66 | 1.82 | -0.93 | 8.30 |
| NGC 147 | E | 0.57 | -0.17 | 0.16 | 8.00 |
| IC 5152 | Irr | -0.77 | 0.50 | -0.01 | 8.00 |
| IC 1613 | Irr | 0.30 | -0.35 | -0.62 | 8.00 |
| Pegasus | Irr | 0.98 | -1.36 | 0.76 | 7.95 |
| Sextans A | dIrr | -0.30 | 0.88 | -0.80 | 7.90 |
| Sextans B | dIrr | -0.09 | 0.94 | -0.78 | 7.70 |
| DDO 210 | dIrr | -0.12 | -0.37 | 0.47 | 7.48 |
| 1001-27 | dIrr | -0.67 | 0.56 | -0.87 | 7.00 |
| Fornax | dSph | -0.01 | -0.12 | -0.07 | 6.85 |
| DDO 187 | dSph | -0.27 | 1.94 | 0.89 | 6.85 |
| DDO 155 (GR8) | dIrr | -0.34 | 1.49 | 0.12 | 6.60 |
| Sculptor | dIrr | -0.01 | -0.08 | -0.01 | 6.60 |
| Andromeda I | dSph | 0.52 | -0.29 | 0.14 | 6.30 |
| Andromeda II | dSph | 0.52 | -0.24 | 0.13 | 6.30 |
| Andromeda III | dSph | 0.62 | -0.31 | 0.14 | 6.10 |
| SAGDIG | dIrr | -0.26 | -0.23 | 0.51 | 6.30 |
| Phoenix | dIrr | -0.11 | -0.39 | -0.15 | 6.30 |
| Leo I | dSph | 0.08 | 0.23 | -0.12 | 6.00 |
| Leo II | dSph | 0.00 | 0.19 | -0.13 | 5.90 |
| Tucana | dSph | -0.62 | -0.68 | -0.01 | 5.78 |
| Andromeda IV | dSph | 0.53 | -0.31 | 0.05 | 5.78 |
| LGS 3 | dIrr | 0.46 | -0.41 | 0.04 | 5.70 |
| Sextans | dSph | -0.02 | 0.06 | -0.05 | 5.70 |
| Draco | dSph | 0.04 | 0.04 | 0.05 | 5.60 |
| Ursa Minor | dSph | 0.04 | 0.04 | 0.03 | 5.48 |
| Carina | dSph | -0.04 | -0.02 | -0.07 | 5.30 |