Near–Infrared Imaging of Early–Type Galaxies III.
The Near–Infrared Fundamental Plane
Abstract
Near–infrared imaging data on 251 early–type galaxies in clusters and groups are used to construct the near–infrared Fundamental Plane (FP)
The slope of the FP therefore departs from the virial expectation of at all optical and near–infrared wavelengths, which could be a result of the variation of along the elliptical galaxy sequence, or a systematic breakdown of homology among the family of elliptical galaxies. The slope of the near–infrared FP excludes metallicity variations as the sole cause of the slope of the FP. Age effects, dynamical deviations from a homology, or any combination of these (with or without metallicity), however, are not excluded. The scatter of both the near–infrared and optical FP are nearly identical and substantially larger than the observational uncertainties, demonstrating small but significant intrinsic cosmological scatter for the FP at all wavelengths. The lack of a correlation of the residuals of the near–infrared FP and the residuals from the Mg2– relation indicates that the thickness of these relations cannot be ascribed only to age or metallicity effects. Due to this metallicity independence, the small scatter of the near–infrared FP excludes a model in which age and metallicity effects “conspire” to keep the optical FP thin. All of these results suggest that the possible physical origins of the FP relations are complicated due to combined effects of variations of stellar populations and structural parameters among elliptical galaxies.
1 Introduction
Correlations among the properties of elliptical galaxies have been used both as measures of their homogeneity as a population and as indicators of the distances of individual galaxies. The discovery of a color–magnitude effect (Baum (1959)) was followed by the measurement of relative distances of galaxies and clusters using the color–magnitude relation (Sandage (1972); Visvanathan & Sandage (1977); Sandage & Visvanathan 1978a,b). The relation’s small scatter was used as a constraint on elliptical galaxy formation time-scales (Bower, Lucey, & Ellis (1992)). The correlation between luminosity and velocity dispersion (Faber & Jackson (1976)) was likewise used as a distance indicator (Tonry & Davis (1981); Dressler (1984)), but Terlevich et al. (1981) discovered a weak correlation between the residuals of the relation and Mg2, implying that there might be a second parameter which contributes to the intrinsic scatter of the Faber–Jackson relation.111Dressler et al. (1987) describe how this evidence for the bivariate nature of elliptical galaxies found by Terlevich et al. (1981) might actually have been driven more by distance errors in the Terlevich et al. sample, which was drawn primarily from the field, and from a surface brightness correlation which was later found to be the second parameter. After correcting for surface brightness effects, Dressler et al. found little or no correlation among the residuals of the Faber–Jackson relation and Mg2. Subsequent studies (Dressler et al. (1987); Djorgovski & Davis (1987)) that included large samples of elliptical galaxies found that surface brightness was a second parameter which caused a large portion of the scatter in the Faber–Jackson relation. In this perspective, the intrinsic properties of elliptical galaxies are only found to lie on a plane within the three–dimensional parameter space of the observables. This Fundamental Plane (FP) is thus a set of bivariate correlations between the observed properties of elliptical galaxies; the color–magnitude and Faber–Jackson relations are projections of that plane onto two of the three axes.
The importance of the exact form of the slope of the FP was immediately identified as possibly providing a strong constraint on the mass–to–light ratios () of elliptical galaxies (Dressler et al. (1987); Djorgovski & Davis (1987)). In particular, the virial theorem produces a prediction that (where is the effective radius, is the central velocity dispersion, and is the mean surface brightness enclosed within ) if two assumptions are made: (1) is the same for all elliptical galaxies, and (2) elliptical galaxies form a homologous family in their scaling properties. The latter assumption was generally taken to be true, hence virtually all researchers in the last decade have proceeded to explore the effects of the variations of implied by the FP correlations. For example, the slope of from Lynden–Bell et al. (1988) in the –band implies that varies systematically with the galaxy’s luminosity as .
More recently, there have been a variety of theoretical (Capelato, de Carvalho, & Carlberg 1995, 1997; Ciotti, Lanzoni, & Renzini (1996)) and observational (Graham & Colless (1997); Busarello et al. (1997)) investigations into the question of whether or not elliptical galaxies form a homologous scaling family. The results of these studies are not yet clear, but they seem to imply that structural deviations of the light profiles of ellipticals from a homologous family cannot affect the FP appreciably (Graham & Colless (1997)), while dynamical deviations from a homologous family can (Capelato et al. 1995; Busarello et al. (1997); cf. Graham & Colless (1997)). Underlying all of these studies is an important point: if there are significant and systematic deviations from a homology, then these deviations should be strictly independent of wavelength observed in constructing the global photometric parameters which enter the FP.
In a broad sense, some of these possible implications of the FP make specific predictions which can be tested by obtaining additional data. For example, if the form of the FP is a direct result of a dependence of on due to variations in the stellar populations parameters of age and/or metallicity, then observations in the near–infrared should show a significantly different form for the FP correlations as the m light is far less sensitive than optical light to line–blanketing and somewhat less sensitive to age effects. Alternatively, if the origin of the FP is due to a systematic deviation of elliptical galaxies from a homologous family, then the exact form of the FP should be independent of wavelength. It is also possible that some combination of these effects could be required by a simultaneous analysis of the FP at optical and near–infrared wavelengths.
The present paper is an attempt to address these possible origins for the FP correlations by exploring their form using near–infrared imaging data. Early work on the FP in the –band was done by Recillas–Cruz et al. (1990, 1991), who obtained aperture photometry for galaxies in Virgo and Coma, and Djorgovski & Santiago (1993), who used aperture photometry from Persson, Frogel, & Aaronson (1979). Both studies relied on optical estimates of . It follows directly from the existence of color gradients that should be smaller for longer wavelengths and this point will be shown explicitly in a future paper (Pahre, de Carvalho, & Djorgovski (1998)) for these optical and near–infrared data. The present paper is more than just a revisiting of the –band FP—it is an attempt to study the global properties of elliptical galaxies using near–infrared photometry that is fully independent of the optical photometry, while at the same time using a methodology for deriving global photometric parameters that is identical to the method at optical wavelengths.
An imaging survey of this kind and scale has only recently become possible with the introduction of large format IR detectors ( pixel2). This project was initiated during the commissioning phase of a wide–field, near–infrared imaging camera (Murphy et al. (1995)) for the Palomar 60–inch Telescope. In the first paper of this series, early results from this survey on the –band FP (Pahre, Djorgovski, & de Carvalho (1995)) indicated that there is a modest change in slope from the optical to the near–infrared, but not nearly as much variation as would be expected if stellar–populations alone were the cause of the slope of the FP (Pahre & Djorgovski (1997); Pahre, Djorgovski, & de Carvalho (1997)). The full –band survey and the complete catalogs of global properties are described in the second paper of this series (Pahre (1998)) and are summarized in §2. All of the data contained in the previous contributions (Pahre et al. 1995, 1997; Pahre & Djorgovski 1997) were re–calibrated, some were re–reduced, and the global photometric parameters re–derived in a consistent manner as described in Pahre (1998). The FP correlations and their many projections are derived in §3 as a way of exploring various aspects of these near–infrared data. The Mg2– relation is constructed for the same galaxies in §3.4. Simple models will be compared to these results in §4, but it will be shown that naive models cannot explain the many observed properties of ellipticals nor are such models unique.
2 Description of the Data
The data used for this paper derive from Pahre (1998). That paper presented near–infrared –band imaging of 341 early–type galaxies, and used those data to measure the global photometric parameters of the half–light effective radius , the mean surface brightness enclosed by that radius, the total magnitude , and the diameter at which the mean surface brightness, fully corrected for cosmological effects and extinction, drops to mag arcsec-2. The latter quantity is an analog of the –band parameter defined by Dressler et al. (1987). The near–infrared data were corrected for the effects of seeing. As shown in that paper, the random uncertainties of the measured quantities are: 0.06 dex on ; 0.21 mag on ; 0.09 mag on ; 0.010 dex on ; and 0.015 dex on , the quantity which will enter the FP.
The galaxies in that sample are primarily drawn from nearby rich clusters of galaxies, although additional galaxies were added from groups and the general field. The galaxies were not selected according to any explicit criteria of completeness (such as a magnitude–limited sample would be), but by the availability of companion optical imaging and spectroscopic data. The primary goal of this effort was to provide a large sample of galaxies for which the variations of the FP correlations between the optical and near–infrared wavelengths could be explored. The data probe the full range of properties (, , ) displayed by the family of giant elliptical galaxies, and a significant portion of the sample is comprised of S0 galaxies.
The optical global photometric parameters (, , and ) and spectroscopic parameters (central velocity dispersion and Magnesium line index Mg2) were compiled from the literature by Pahre (1998). All of the photometry were drawn from the , , , , (or ), or bandpasses and converted to magnitudes for a general catalog. Furthermore, separate catalogs were constructed for individual comparisons to preserve the wavelength information for each optical bandpass. The spectroscopic parameters were corrected for observed aperture size effects to a common physical scale of kpc; small offsets between data sets have been applied according to prescriptions developed by other authors in the literature. The values were then averaged to reduce the random uncertainties and minimize systematic errors due to some data sets. Of the 341 galaxies imaged in the –band, 95% have velocity dispersions, 69% have Mg2 indices, and 91% have optical photometric parameters (either or ). The typical uncertainties for individual measurements of and Mg2 are dex and mag (Smith et al. (1997)), respectively. A substantial fraction of the entire sample has more than one measurement of these parameters which were then averaged, so these two uncertainty estimates can be taken as a universal upper limit to the measurement uncertainties.
Many, if not most, of the literature sources suggest that their velocity dispersions are less reliable below km s-1, but a bias in the slope of the FP can be introduced by imposing a cut on . It will be important to investigate what effect changing the lower cutoff for has on the slope and scatter of the FP. Small measures of the effective radius, such as arcsec (the median seeing was arcsec FWHM), have large random uncertainties and probably substantial systematic errors, and should probably also be discarded. In the sample, 4% of the galaxies have morphological type SB0 or later, and another 4% have S0/a type; caution should be exercised when studying the global properties of these galaxies. One galaxy (D45 in cluster Abell 194) appears to be a misidentification either in the optical or near–infrared as evidenced by its color mag, which appears to be much too blue compared to the mean mag for the entire sample. Five galaxies in the Virgo cluster were removed from the sample, as their accurate distances as derived by the surface brightness fluctuations method (provided by J. Blakeslee and J. Tonry; see Tonry et al. (1997)) show that they are either in the background W Cloud (NGC 4168, NGC 4261, and NGC 4365) or the foreground (NGC 4660 and NGC 4697).
3 Analysis of the Elliptical Galaxy Correlations
3.1 The Near–Infrared Fundamental Plane
Galaxies were drawn from the sample described in §2. Only those galaxies residing in a cluster or group with four or more observed galaxies were included in the FP fits, resulting in 16 clusters/groups and 249 galaxies with . Two of the five Leo I Group galaxies were excluded as a result of these selection criteria, although the remaining three galaxies were retained in the sample for completeness.
The “standard” FP equation is usually written as
| (1) |
where is usually identified as the “slope” of the FP and are the “intercepts.” The intercept of the relation will vary with distance. The galaxies in each of the 16 groups and clusters are assumed to lie at the same distance, hence there are different intercepts .
The Equation 1 was fit by minimizing the sum of the absolute deviations of the points orthogonally from the relation using the program GAUSSFIT (Jefferys et al. (1987)). During the first iteration, two points which are outliers (D9 in Cen30 and S201 in Hydra) were identified and excluded from the analysis. The resulting FP in the near–infrared –band is
| (2) |
The uncertainties in the coefficients were determined by 100 iterations of bootstrap resampling of the data-points. The individual intercepts for the fit, and the rms about the fit for each cluster or group, are listed in Table 1. Since the rms is quoted in units of , the uncertainty on each intercept is therefore . The relation in Equation 2 is equivalent to the scaling relation .
Changing the lower cutoff for from dex to dex changes the value of by dex, changes by dex, reduces the scatter by 10% to dex, and excludes 23 galaxies (9% of the total). Hence, the solution to the FP is robust to the lower cutoff, although the galaxies with the lowest appear to contribute the largest to the observed scatter. Minimizing the orthogonal variance (instead of the absolute value of the deviation) from the FP relation with dex results in a small change in the slope of the FP to:
| (3) |
Since the coefficients in Equations 2 and 3 are equivalent within the uncertainties, the fit to the FP is insensitive to the exact fitting method. The method of minimizing the absolute value of the orthogonal deviation from the fit is to be preferred, however, as it is less sensitive to outliers.
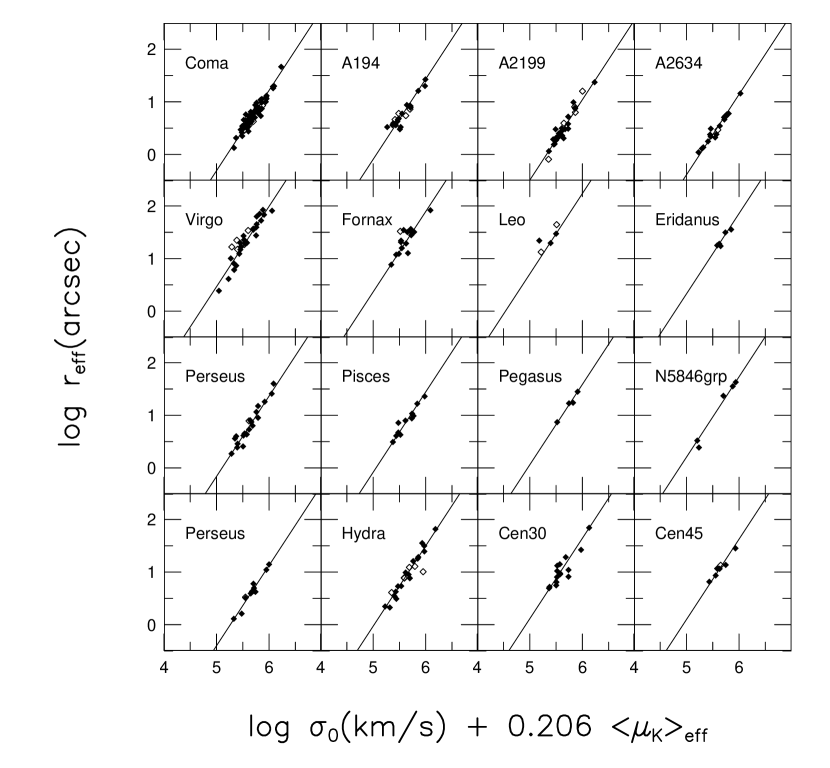
The simultaneous fit to all clusters is displayed in Figure 1 with the data subdivided into the 16 individual clusters or groups. It is clear from this figure that the simultaneous fit is a representative description of the properties of the early–type galaxies in all of the clusters. There is no clear deviation from this mean relation.
The 11 clusters with more than ten galaxies were fit individually to Equation 1 as a test of the universality of the FP relation. The difficulty with all 11 separate fits, however, is that the number of galaxies in each cluster is small enough that the slope of the relation is not accurately determined. Once again, the uncertainties on the fitted coefficients and have been determined using the bootstrap procedure. In eight of the 11 cases, the fits have within one standard deviation of the value from the simultaneous fit, suggesting both that the uncertainties are reasonably estimated and that better fits are limited by the number of galaxies per cluster. These individual fits are listed in Table 1.
The same 11 clusters were also fit individually by constraining from the previous simultaneous fit. This is possible because virtually every study of the FP (optical and near–infrared) obtains a similar value for this parameter, hence it should be possible to constrain its value a priori. These fits show significantly smaller uncertainty in their determination of than the unconstrained fits, and are listed in Table 1. In this case, seven of the 11 clusters have a slope within one standard deviation of the value from the simultaneous fit.
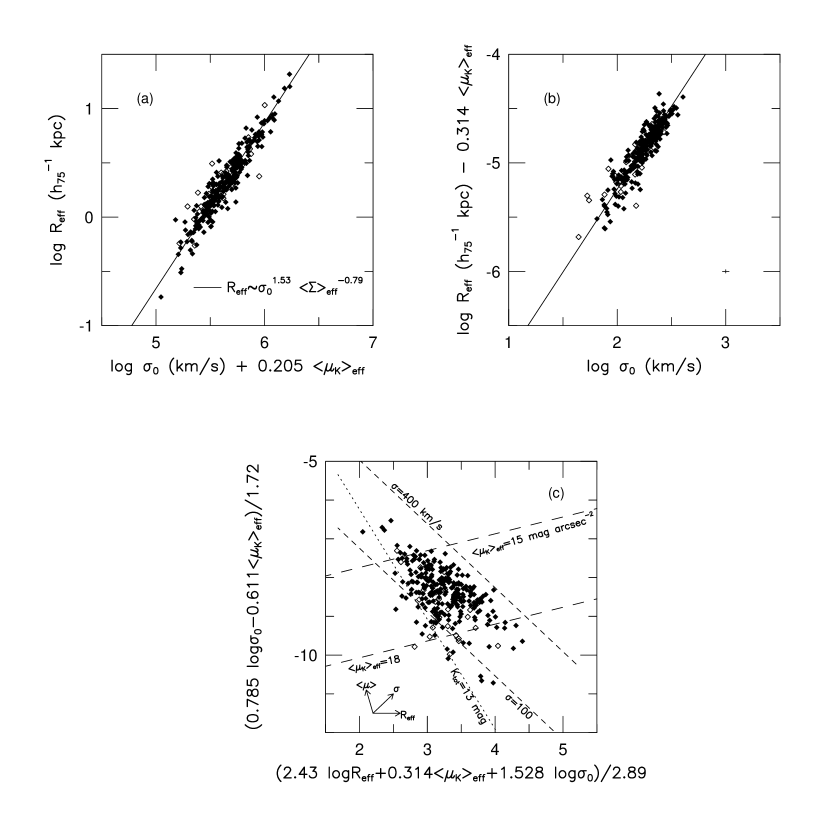
The adopted form of the FP in Equation 2 is plotted for all 301 galaxies in these 16 clusters and groups in Figure 2, both in face–on and edge–on perspectives. While the edge–on view with as the ordinate222In this paper, a distinction will be made between the angular effective radius , measured in arcsec, and the effective radius in physical scale, measured in kpc. is the most common method of displaying the FP, the edge–on view with as the ordinate is easier to interpret. Virtually every study of the FP (optical and near–infrared) obtains the same relationship between and , but there may be significant variation in the relationship between and , depending on wavelength. Furthermore, this edge–on perspective of the FP, seen from its short side, separates the correlated measurement errors in and from the independent measurement errors in . The FP in physical units as plotted in Figure 2 is .
In the face–on view of the FP in Figure 2(c), it is seen that galaxies do not uniformly populate this planar surface. While the –band data in this paper are not drawn from a strictly magnitude–limited sample, they do behave as though a mag limit were imposed. Most of the galaxies are found to have mag arcsec-2 (long–dashed lines), although there are no clear selection effects causing this distribution of galaxy properties. Furthermore, there are no galaxies with properties in the upper–right portion of the figure, which could be caused by the lack of galaxies with central velocity dispersions km s-1, although there is no selection limit imposed on this portion of the FP.
3.2 The – Relation
Dressler et al. (1987) introduced a parameter which was defined as the diameter at which the circular mean surface brightness (fully corrected for cosmological effects and Galactic extinction) dropped to a fiducial value. This parameter was chosen, in effect, to be a combination of the and terms in the FP correlations, thereby simplifying the FP to a – relation. They defined this fiducial surface brightness to be mag arcsec-2 in the –band: the surface brightness was faint enough that was typically much larger than the seeing disk, while bright enough that interpolation (rather than extrapolation) was used to evaluate from their aperture magnitude data.333The notation of will be adopted for the rest of the paper to distinguish the parameter as defined in the –band from the equivalent diameter as defined in another bandpass. The name “– relation” will refer to the correlation in all bandpasses.
Lucey & Carter (1988) defined an equivalent parameter in the –band to be the diameter at which the mean surface brightness drops to 19.8 mag arcsec-2 (this assumes a mean galaxy color of mag), Smith et al. (1997) defined for the –band to be at mag arcsec-2 (assuming mag), Jørgensen et al. (1995a) defined the Gunn –band to be at mag arcsec-2 (assuming mag), and Pahre (1998) defined the –band to be at mag arcsec-2 (assuming mag). By using typical colors for early–type galaxies in constructing these definitions, the average value of measured for a sample of galaxies should be approximately independent of bandpass. The slope of the – relation may vary between bandpasses, however, causing there to be a systematic variation of the parameter as a function of in different bandpasses (while keeping the mean similar). For example, if and , then .
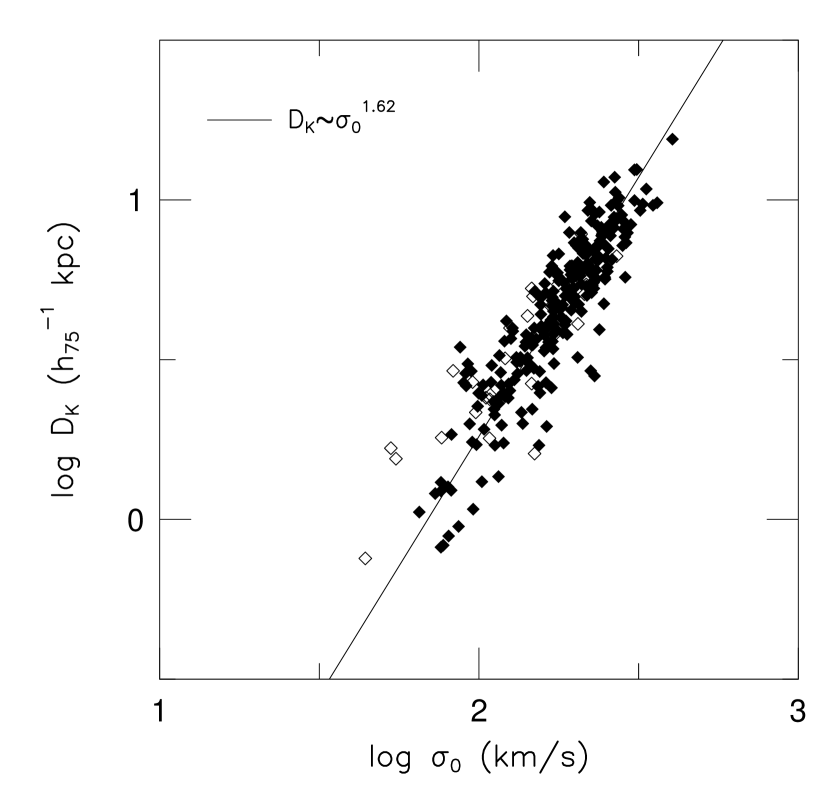
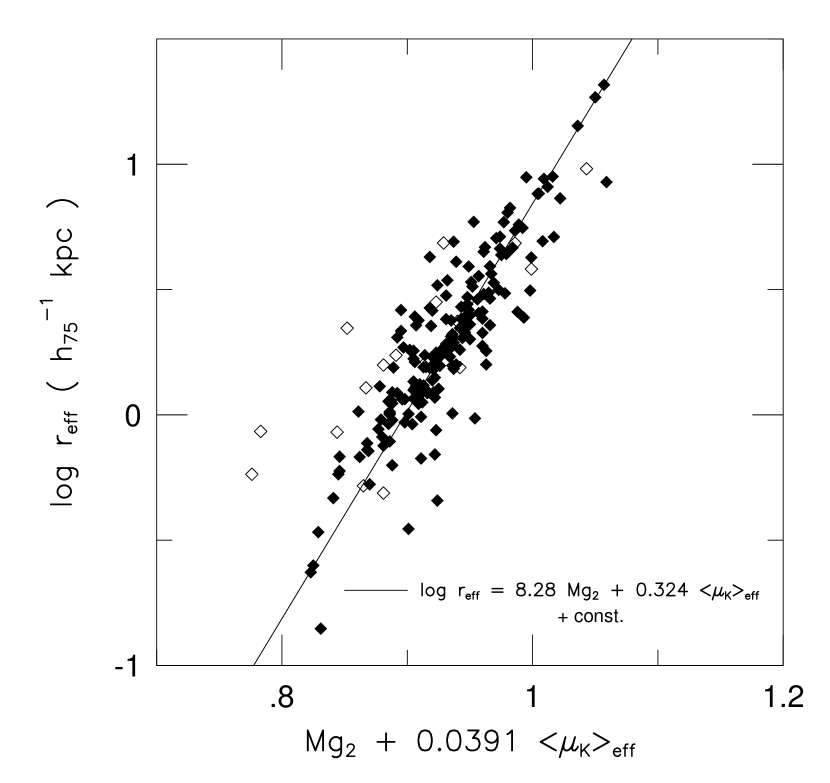
The – relation was fit for the galaxies in the same 16 clusters and groups as in §3.1, excluding galaxies using similar criteria ( arcsec, , late types), and using the bootstrap method to estimate uncertainties in the fitted coefficients. The best fitting relation is
| (4) |
and is displayed in Figure 3. The slope of this relation is consistent, given the estimated uncertainties, with the full FP relation in Equations 2 and 3. The scatter of the – relation, however, is 15% higher than the –band FP, despite the fact that the measurement uncertainty of is actually smaller than that for (Pahre (1998)). This is most likely due to the fact that the – relation is nearly, but not quite, viewing the FP edge–on.
3.3 The FP As Seen in –Space
Since elliptical galaxies only populate a plane in the three–dimensional space of the observables , it is straightforward to construct an orthogonal transformation from this observed coordinate system to another one which might facilitate a physical interpretation of the underlying parameters. Since there are many possible transformations to accomplish this, the chief practical difficulty is identifying a transformation which permits a robust and unbiased physical interpretation of the true galaxy properties (Djorgovski, de Carvalho, & Han (1988)). A transformation of this kind was proposed by Bender, Burstein, & Faber (1992):
| (5) |
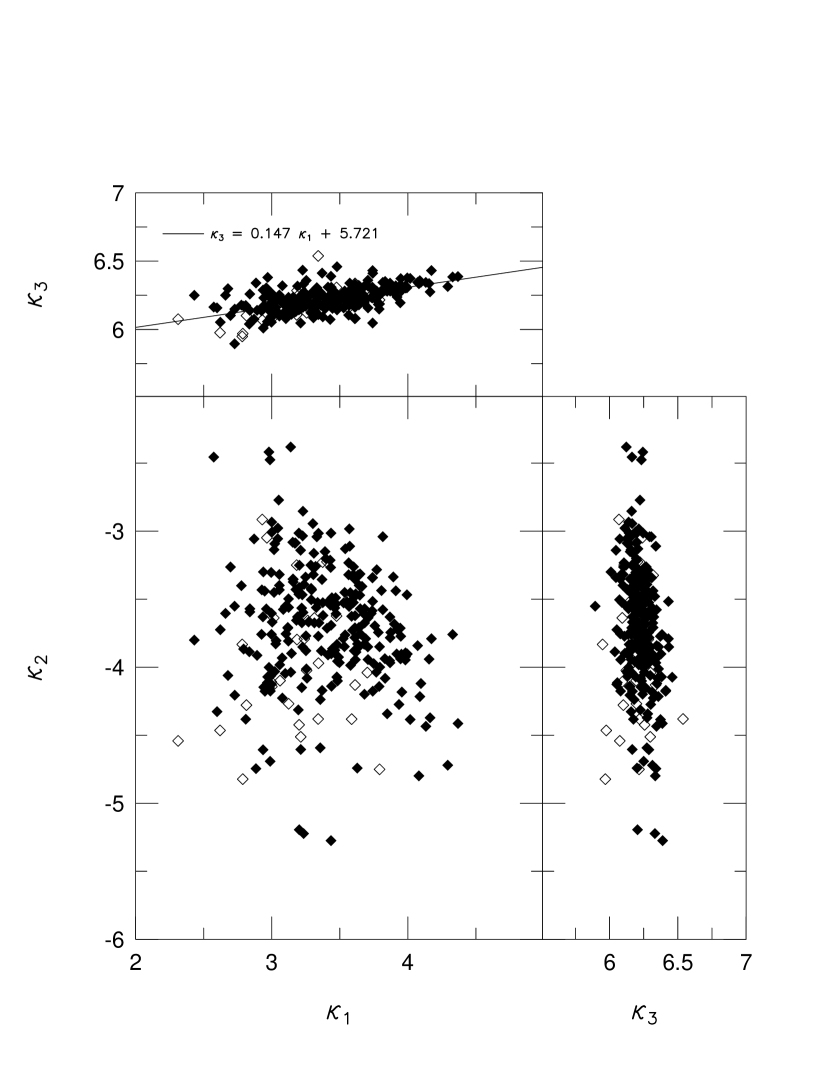
where the quantities were constructed with the hope that would be proportional to mass, would be proportional to mass–to–light ratio, and (which is required to be orthogonal to and ) would be proportional to the product of mass–to–light ratio and the third power of mean surface brightness. This “–space” is displayed in Figure 4 for the –band survey. Given the above interpretation of and , the fitted line between these two variables
| (6) |
then implies that the “observed mass–to–light ratio”444For the reasons discussed later in this section, we prefer to distinguish between this observed relationship (between and ) and the intrinsic and ; the intrinsic properties may or may not be fully described by the axes and . in the –band varies as . This conclusion is dependent on elliptical galaxies forming a dynamically homologous family in which the central velocity dispersion scales to the effective velocity dispersion (the velocity dispersion within the effective radius) independently of the mass or luminosity of the galaxy. The uncertainties in Equation 6 were derived using bootstrap resampling of the data points. The cumulative observational uncertainties in this equation are dex in , which is substantially smaller than the rms of the fit, implying a substantial intrinsic scatter of the “observed mass–to–light ratio” for any given “mass.”
While it is desirable to choose an orthogonal coordinate system which might directly relate the observables to underlying physical properties of elliptical galaxies, this conceptualization of the FP has a number of problems. First, the quantity is not equivalent to , the half–mass radius, but instead varies with the observed wavelength. This generally follows from the presence of color gradients in elliptical galaxies (e.g., Franx, Illingworth, & Heckman (1989); Peletier et al. 1990a,b), but will be shown explicitly for the case of comparing –band and –band effective radii in the next paper in this series (Pahre, de Carvalho, & Djorgovski (1998)). It follows that the value of , which was intended to create a quantity which is proportional to mass, systematically varies as a function of wavelength while mass, of course, does not. Using the terminology of Djorgovski et al. (1988), the mapping from to gravitational radius is accomplished in the equation ; the argument here is that the structure function is not a constant, as is implicitly assumed in the construction of –space by Bender et al. (1992), but is instead a function of wavelength.
Second, while the evidence is not yet strong, the lowest luminosity ellipticals show no detectable color gradients (Peletier et al. 1990a ), suggesting that there could be a dependence of the size of the color gradient on luminosity (and hence mass). The size of the color gradients also depends on the wavelength sampled (Franx et al. 1989; Peletier et al. 1990a,b). The mappings from to mass and to mass–to–light ratio are therefore a function of both wavelength and size of the color gradient (which is, in turn, a function of mass). Again using the terminology of Djorgovski et al. (1988), this means that the composite structure functions and (see their Equations 5–8) are also not constant, as is implied by the construction of –space, but are instead functions of wavelength and mass.
Third, the use of the central velocity dispersion in deriving mass at the effective radius assumes dynamical homology among elliptical galaxies when mapping (the central velocity dispersion) to (the velocity dispersion within the effective radius). Whether or not the internal stellar velocity distributions of elliptical galaxies form a homologous family is a point of considerable debate. Empirical arguments (Jørgensen, Franx, & Kjærgaard 1995b , Busarello et al. (1997)) and numerical simulations of dissipation-less merging (Capelato et al. 1995) seem to suggest that the way scales to is a function of galaxy mass or luminosity. The mapping from to mass and to mass–to–light ratio are therefore a function of mass or luminosity, and possibly a function of other physical processes which are currently poorly understood. Once again using the terminology of Djorgovski et al. (1988), the mapping from the intrinsic velocity distribution to the observed in the equation is accompanied by a dependence of on galaxy mass (or luminosity) and systematic deviations from a dynamical homology.
In summary, because the mapping from the observables to –space is a function of wavelength, luminosity, and deviations from dynamical homology, and furthermore because the mapping from –space to mass and mass–to–light ratio is also a function of wavelength, luminosity, and deviations from dynamical homology, we eschew the use of –space since it is an obfuscation, rather than an illumination, of the fundamental physical quantities of elliptical galaxies which we wish to understand. At its best, the –space formalism is merely an intermediate orthogonal transformation between the observables and the desired physical properties .
3.4 The Mg2– Relation
The Mg2– relation is a correlation between two distance independent quantities and hence useful both as a diagnostic and as a constraint on formation processes for elliptical galaxies as a family. Guzmán (1995), for example, found that the residuals of the Mg2– relation and the – relation showed systematic differences between the Hydra–Centaurus region and the Coma cluster, thereby suggesting that there are differences between the global properties of galaxies in those two environments.
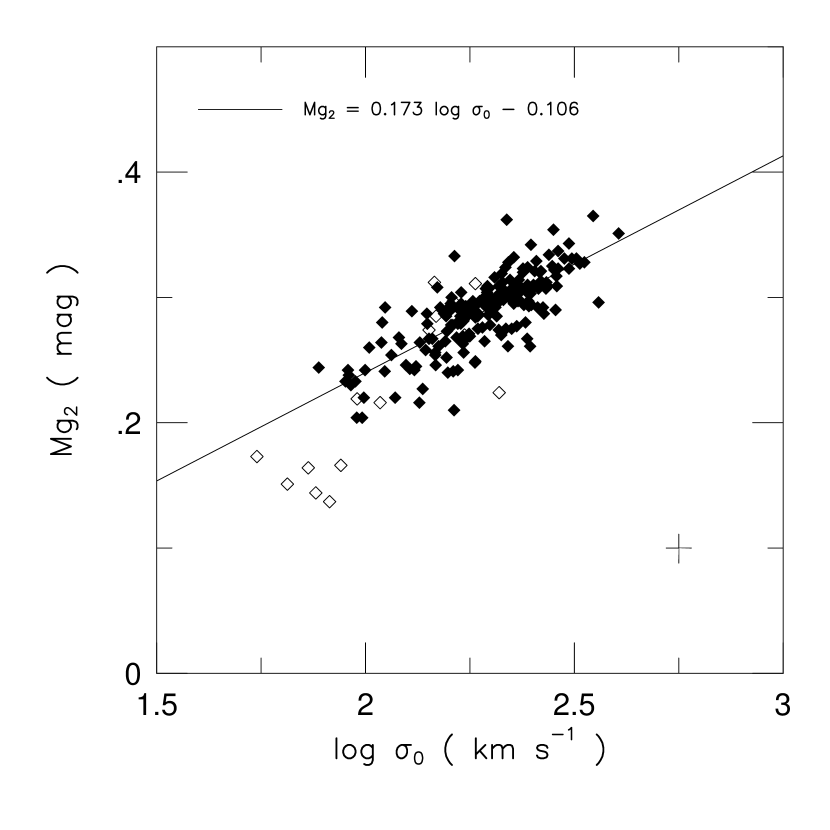
Only a fraction of galaxies for which is available also have Mg2 values available. Of the entire sample of 301 early–type galaxies in these 16 clusters and groups, only 188 galaxies (62%) fit the criteria of and have Mg2 measurements. There are six galaxies at low that show anomalously low Mg2 and are therefore excluded: M32, NGC 3489 in the Leo Group, and NGC 4239, NGC 4468, NGC 4476, and NGC 4733 in the Virgo cluster (NGC 4489 was previously excluded for ). Many of these are dwarf galaxies which are known to follow different FP correlations. The criterion used for this exclusion was that all galaxies satisfy Mg. The best fitting Mg2– relation is
| (7) |
This relation is plotted in Figure 5. The slope of this relation is slightly shallower than the value of found by Jørgensen (1998), and the scatter is slightly smaller than the mag of Jørgensen. Inclusion of the six galaxies anomalously low in Mg2 and the one galaxy with produces a Mg2– relation Mg with a scatter of mag; this is closer to, and statistically indistinguishable from, Jørgensen’s results. The form in Equation 7 will be used, however, as it best represents the properties of the normal elliptical galaxies.
3.5 The Mg2 Near–Infrared Fundamental Plane
An alternative form of the FP was proposed by de Carvalho & Djorgovski (1989): substitute a stellar populations indicator, such as the Mg2 index, for the dynamical or mass indicator in the FP relation. The motivation for this is that since Mg2 and are strongly correlated with each other (as shown above in §3.4) then metallicity could actually be the fundamental physical property that causes the slope of the FP to deviate from the virial expectation. de Carvalho & Djorgovski also showed that a metallicity sensitive color could be substituted for , although that approach will not be pursued here due to the heterogeneity of the derived optical–infrared colors in Paper II (see Pahre (1998)).555Basically, the fundamental requirement for such an investigation of the “color FP” is to understand the difference between an “aperture” color–magnitude relation, the standard form which relies on a color measured in a fixed physical aperture size for all galaxies, and a “global” color–magnitude relation, which is evaluated at some fiducial scaling radius. Part of the slope of the “aperture” color–magnitude relation is certainly due to the presence of color gradients which act in the sense that ellipticals are redder in their centers: the smallest galaxies have their colors evaluated at large where their color is bluer, while the largest galaxies have their colors evaluated at small where their color is redder. Future work should explicitly distinguish between the two effects of color gradients and global color differences in order to place a constraint on the global properties of ellipticals. The resulting FP in the near–infrared –band using the Mg2 index in place of is
| (8) |
The slope of this relation is , as predicted by the slope of the Mg2– relation combined with the standard form of the near–infrared FP, i.e., . The observational uncertainties increase when Mg2 is used instead of since the latter quantity has times greater uncertainty, while the slope has changed by more than a factor of five from Equation 2 to Equation 8. The scatter in the near–infrared Mg2 FP, however, has increased by much more than this difference, suggesting that Mg2 is not nearly as good an indicator as the velocity dispersion in describing the fundamental and regular physical properties in elliptical galaxies that give rise to the FP. The Mg2 index could be identifying real differences in the stellar populations among galaxies and hence shows larger scatter when it is substituted into the FP.
If part of the scatter in the –– FP can be attributed to differences in stellar populations among elliptical galaxies, then the introduction of a stellar populations “correction” factor based on the Mg2 index should be able to reduce the scatter of the FP even though a small amount of additional observational uncertainty is added in the process. The idea for this comes from the attempt by Guzmán & Lucey (1993) to construct an “age–independent” distance indicator. Here the method will be applied to the near–infrared data.
Using Bruzual (1983) evolutionary spectral synthesis models, Guzmán & Lucey showed that the effects of a burst of star formation involving 10% of a galaxy’s mass would appear as a change of Mg2 roughly constant for times Gyr or so after the burst. Hence, an offset in magnitude could be applied to each galaxy independently based on its departure Mg2 from the Mg2– relation. Guzmán & Lucey also showed that while the effect in the optical –band was , the effect in the near–infrared was much smaller at
| (9) |
This effect can basically be understood as a filling–in of the Mg2 feature by the addition of a continuum flux from hot, young stars. The changes in the Mg2 index are expected to be small, as Mg2 is far more sensitive to metallicity than it is to age or IMF (Mould (1978)).
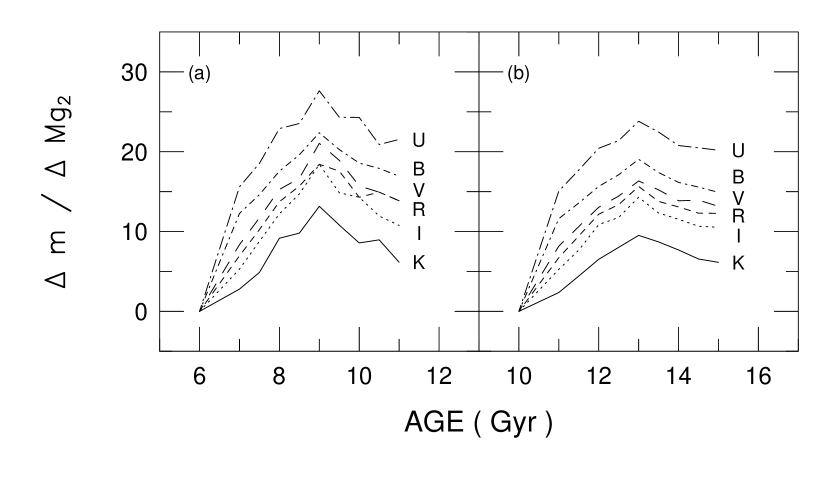
The Guzmán & Lucey procedure is repeated here for the Worthey (1994) stellar populations models in order to determine if the size of the predicted age effects are similar despite significant differences between the Bruzual (1983) and Worthey (1994) models. The model adopted is similar to Guzmán & Lucey in that it involves M⊙ total mass, 90% of which is 15 Gyr old in the present day, 10% of which is 5 Gyr old, and all of which has solar metallicity. A similar model is investigated that involves 90% of the galaxy being 11 Gyr old in the present day and 10% being 5 Gyr old. The results from the Worthey models are plotted in Figure 7 for the bandpasses.
The Worthey models show modest agreement with the Guzmán & Lucey calculations based on Bruzual (1983) models for the optical bandpasses, although the value of mag Mg2 is systematically 30–50% higher. In the –band, however, Worthey’s models are 3–4 times higher in this quantity. The most likely explanation for this is the difficulty that many models have in producing enough Mg relative to Fe for very metal–rich populations (see Worthey, González, & Faber (1992), for example), although more fundamental problems in the treatment of cool stellar atmospheres in the infrared for the Worthey models (see Charlot, Worthey, & Bressan (1996)) could also be relevant. As a result of this discrepancy, the effects of a late burst of star formation involving a small fraction of the galaxy mass on the FP cannot be assumed a priori.
A better approach is to measure directly the possible contribution of younger stellar populations using the FP itself, and then using the observations to constrain the models. Combining Equations 1 and 7, defining , and assuming that the mean surface brightness term in the FP is the only one affected by yields:
| (10) |
where the primed coefficients are the “age–independent” form of the FP. The Guzmán & Lucey analysis predicts , while the Worthey models predict .
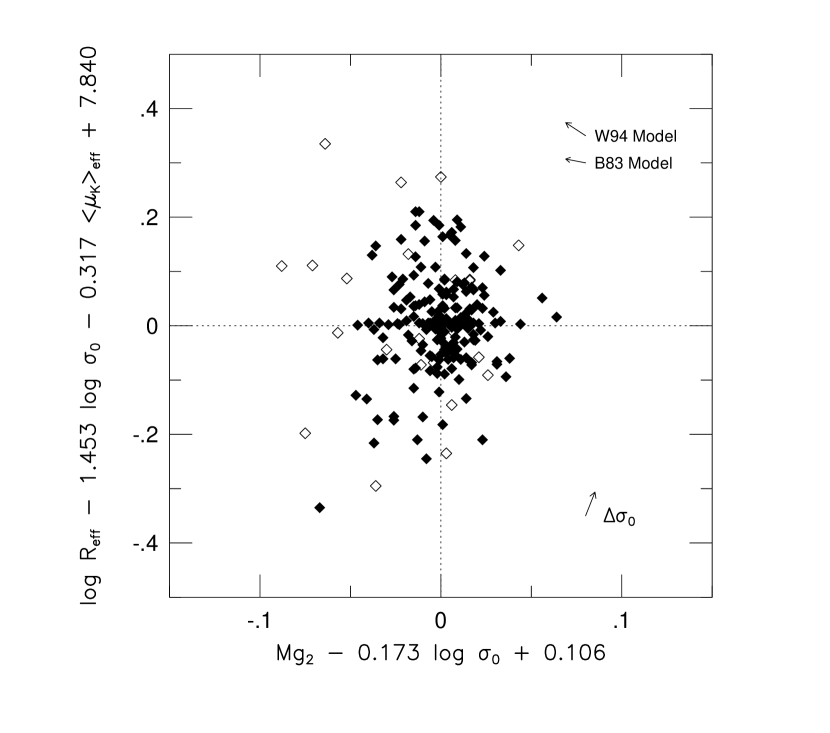
Unfortunately, a minimization of Equation 10 does not reveal an optimal value of since values of increase the scatter of the equation due to the added measurement uncertainties. Put another way, there was no significant improvement in the scatter (by %) of the FP for any in the range . Since the intrinsic thickness of the near–infrared FP is clearly resolved without including a Mg2 term (i.e., Equation 2 and Figure 2), then some of that thickness could be due to variations in age among the stellar populations of elliptical galaxies. This effect can be viewed from a similar perspective by attempting to correlate the residuals of the near–infrared FP with the residuals of the Mg2– relation. This – diagram is shown in Figure 8. This figure shows no correlation among the residuals in the direction of the age vectors, implying that the resolved intrinsic scatter of both the near–infrared FP and the Mg2– relations cannot be caused by age effects alone.
Instead, insight can be gained by looking for changes in the relative distance modulus between a given cluster and the Coma cluster. When , all 16 clusters and groups show changes in their distance moduli relative to Coma of mag, which is smaller than the typical uncertainty of mag in the distance to a cluster of galaxies for a scatter of dex. The difference in relative distance modulus between the and cases, however, reach as high as 0.12–0.18 mag in the case of several clusters (Virgo, Cen30, and Pegasus), which is marginally significant. Since the Worthey (1994) models probably overestimate due to their difficulty in producing Mg for metal–rich populations, the conclusion is that mag is a firm upper limit to the effects of age differences on the distance moduli derived using the near–infrared FP. This result for the –band is similar to that found in the –band by Jørgensen et al. (1996), who found a minimally–significant contribution of . They probably found no good correlation for the reason given above—that the increase of measurement uncertainties as increases prevents effective minimization during the fitting—hence this may not be a significant constraint on a superimposed intermediate age contribution. Repeating the analysis using for the Abell 2199 and Abell 2634 clusters for the galaxies in the and matched catalog produces a similarly small change in their distance moduli relative to Coma. In summary, there is little evidence that adding a Mg2 term (based on the Mg2– relation) to the near–infrared FP to account for age differences in the ellipticals in different clusters causes a significant improvement over the zero–point for the relation and hence distances derived from it.
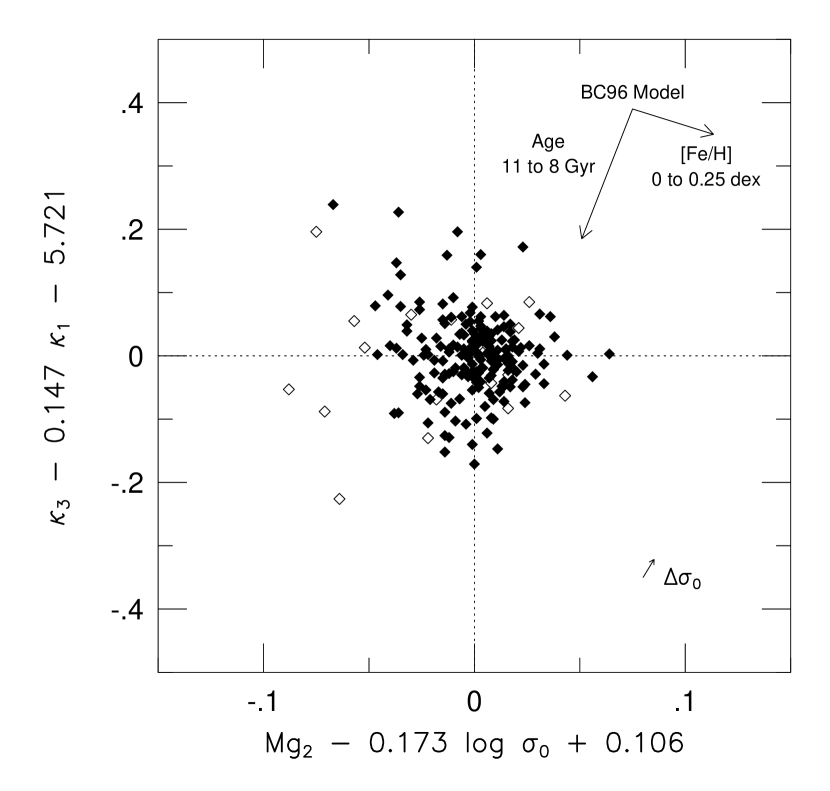
A similar approach could be pursued by looking at the correlation between the residuals of the Mg2– relation and the residuals of the – relation. If differences of Mg2 at a fixed indicate differences of stellar populations, and if differences of at a fixed indicate differences in due to stellar populations effects, then the residuals of these two relations (Equations 10 and 6) should correlate in a manner that is consistent with stellar populations effects. These residuals are plotted against each other in Figure 9.
This figure is an excellent diagnostic for distinguishing between age and metallicity effects, since Mg2 decreases for younger stellar populations while it increases for higher metallicities, but decreases for both. [If the vertical axis were measured at any optical wavelength, then age and metallicity would instead act nearly parallel.] The lack of any preferred correlation along either the age or metallicity vectors in Figure 9, while at the same time having a substantial intrinsic scatter for both relations, strongly indicates that both age and metallicity variations exist at any given point on both the Mg2 and – relations.
The H index is expected to be a good indicator of the presence of a young stellar component, and either the Mg2 or Fe indices should be good indicators of the mean metallicity of the stellar content. The large intrinsic scatter between the H and Mg2 indices, the lack of a correlation altogether between H and Fe, the strong correlation between Mg2 and , and the weak correlation between Fe and (Jørgensen (1998)) all indicate that there exist significant variations in both age and metallicity for any given value of . This is fully consistent with the argument above based on the residuals of the Mg2– and – relations.
3.6 The Faber–Jackson Relation
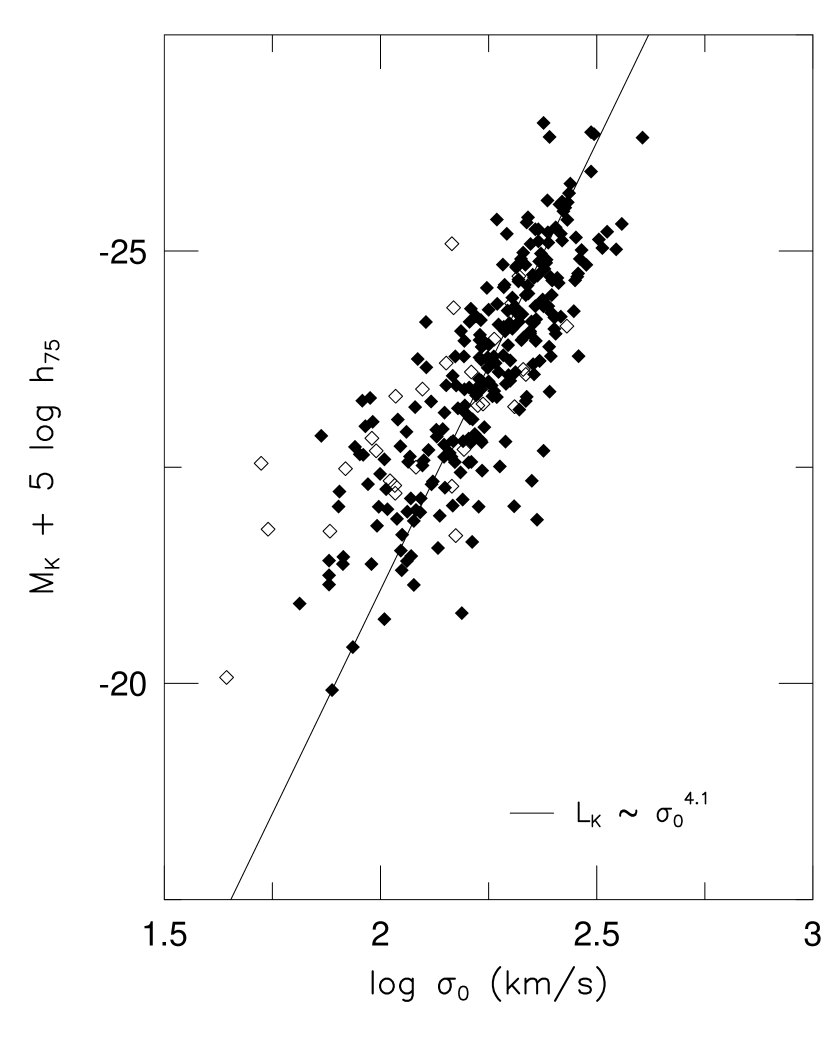
The correlation between luminosity and central velocity dispersion for elliptical galaxies was first noticed by Faber & Jackson (1976). If we fit the relation , this is equivalent to fitting . The best fitting Faber–Jackson relation for the –band data is
| (11) |
assuming km s-1 and that the Coma cluster ( km s-1) is at rest with respect to the Hubble flow. The relation is plotted in Figure 10. The scatter of this relation is significantly smaller in the Coma cluster alone (rms mag).
3.7 The Modified Faber–Jackson Form of the FP
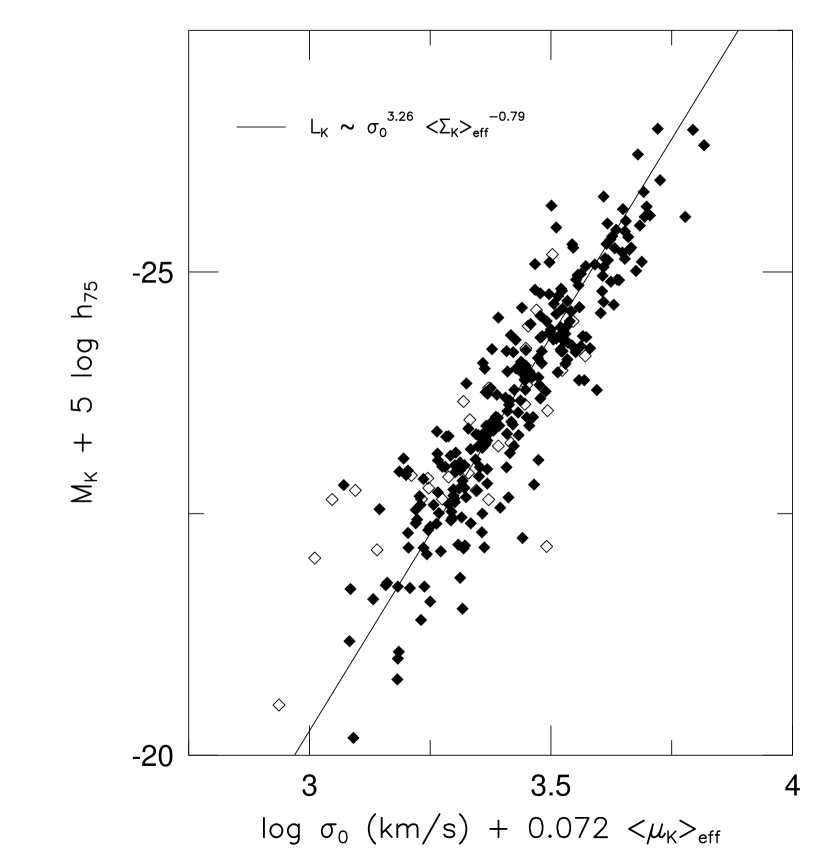
Since there is substantial scatter in the Faber–Jackson relation due to variations in surface brightness among galaxies at a given luminosity and central velocity dispersion, an alternate form of the FP is to substitute for . This will be referred to as the “modified Faber–Jackson” relation, as it adds the additional term to the Faber–Jackson relation. The form of this equation is
| (12) |
where the primed coefficients are used here for the modified Faber–Jackson relation. Since in the case of a pure de Vaucouleurs profile , the value can be substituted for resulting in and , thereby relating Equations 1 and 12 to each other. The best–fitting relation of the modified Faber–Jackson form of the FP is:
| (13) |
which has a scatter only 10% larger than the standard form of the near–infrared FP given in Equation 2. This equation represents the scaling relation , which is fully equivalent within the uncertainties to the standard form of the near–infrared FP. Since the uncertainty on is mag, the total observational uncertainties in Equation 2 and 13 are similar. Hence Equation 13 also shows substantial intrinsic scatter in the properties of elliptical galaxies at any point along the FP.
3.8 The Kormendy Relation
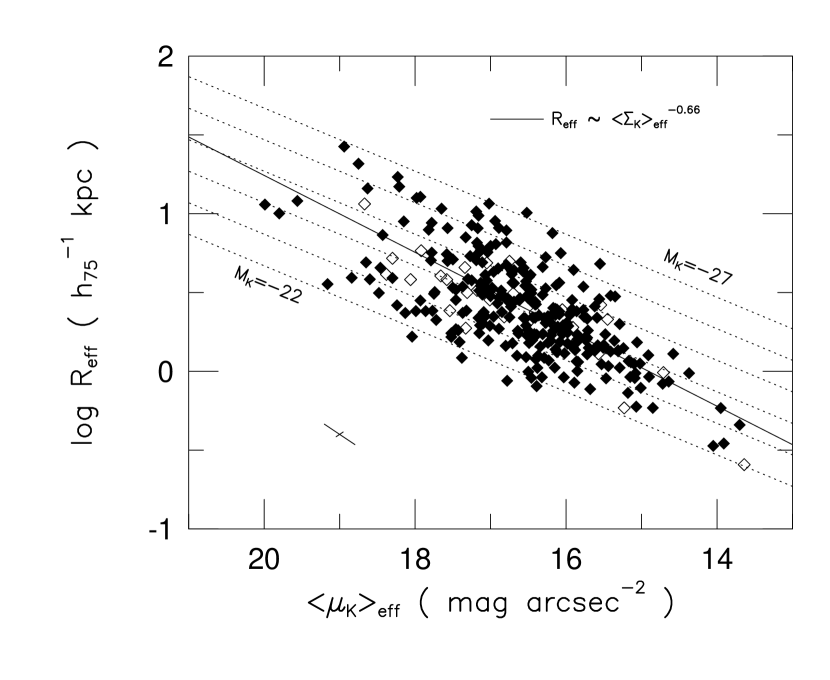
Effective radius and mean surface brightness, which are two of the three terms in the FP, are correlated with each other (Kormendy (1977)). The best fitting Kormendy relation for the –band data is
| (14) |
assuming km s-1 and that the Coma cluster ( km s-1) is at rest with respect to the Hubble flow. The relation is plotted in Figure 12. The scatter of this relation is significantly smaller in the Coma cluster alone (rms dex). Measurement errors in and are correlated and act in a direction nearly parallel to the Kormendy relation, but are not nearly large enough to account for the spread in galaxy properties along the relation. Changes in luminosity are skewed with respect to this relation and shown in Figure 12. For this reason it is necessary that a magnitude–limited sample be defined in a consistent way for all clusters studied before conclusions based on changes in the zero–point (due to distances for nearby clusters or evolutionary brightening for higher redshifts) can be made.
3.9 The Radius–Luminosity Relation
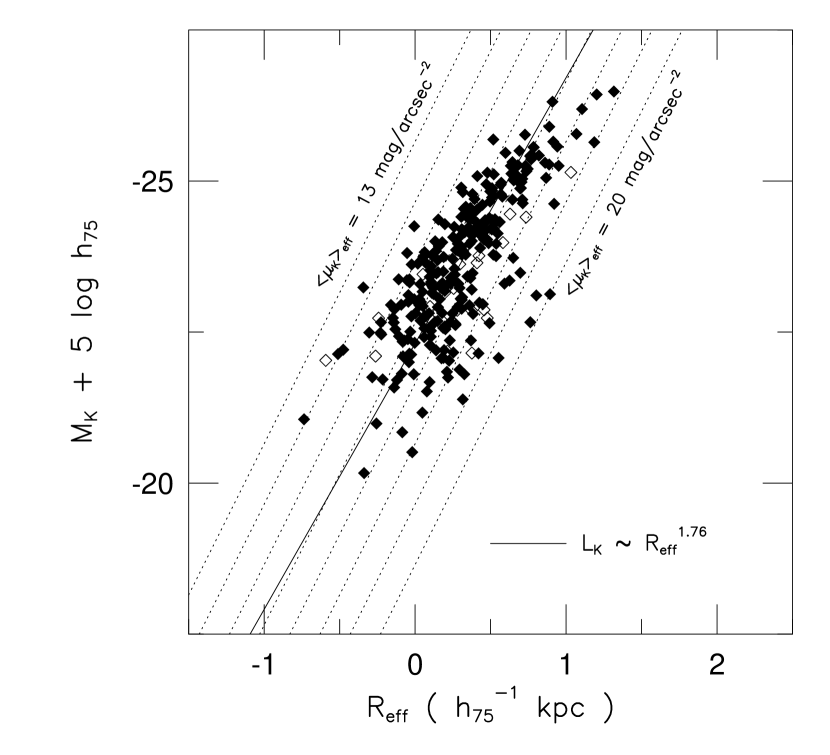
The correlation between the effective radius and total magnitude for elliptical galaxies has long been used for distance scale work and especially cosmological tests (see Sandage & Perelmuter (1990) and references therein). The best fitting radius–luminosity relation for the –band data is
| (15) |
assuming km s-1 and that the Coma cluster ( km s-1) is at rest with respect to the Hubble flow. The relation is plotted as Figure 13. There is intrinsic scatter to this relation that is a result of the variation in surface brightness at a given radius and luminosity; lines of constant surface brightness are plotted in the figure to demonstrate this effect.
4 Exploring Simple Models for the Origins of the Elliptical Galaxy Scaling Relations in the Near–Infrared
The near–infrared FP has been shown in §3.1 to be represented by the scaling relation . This relation shows a significant deviation from the optical forms of the FP: (Jørgensen, Franx, & Kjærgaard (1996)) and (Hudson et al. (1997)) in the –band; or in the –band (Guzmán, Lucey, & Bower (1993)). There are two simple conclusions to draw from these data: (1) the slope of the near–infrared FP deviates from the virial expectation of , and (2) the slope of the FP increases with wavelength. A third insight derives from the fact that the scatter of the FP is very similar at all wavelengths. These three points are sufficient to discuss several simple models for the physical origins of the FP.
The age–metallicity model of Worthey, Trager, & Faber (1995)—based on the form of the FP in the optical, various line indices, and simple stellar populations model comparisons—incorrectly predicts that the near–infrared FP should follow the virial form. Another model, that the FP slope is caused by deviations of the velocity distributions of elliptical galaxies from a homologous scaling family (Capelato et al. 1995), cannot account for the variations of the slope of the FP with wavelength. If this breaking of homology has its origin in dissipation-less merging, then this effect also cannot explain the correlation between Mg2 and . A final model, which suggests that deviations of the light distributions of elliptical galaxies from the de Vaucouleurs form is the cause of the FP slope, is unable to account for the slope of the FP in the optical (Graham & Colless (1997)), and for the same reasons it cannot explain the near–infrared FP slope.
The deviation of the slope of the near–infrared FP from the virial expectation, assuming homology and constant among ellipticals, is a very significant result. This requires a breakdown of one or both assumptions: either is systematically varying along the FP, or elliptical galaxies are systematically deviating from a homologous scaling family. If age is the stellar populations parameter which causes variations in the slope of the FP with wavelength, then age alone might possibly produce the slope of the –band FP. This conclusion, however, is severely limited by the possibility of homology breaking along the elliptical galaxy sequence.
Allowing for structural deviations from homology, in the form of a Sersic profile, does not appear to cause significant changes to the slope of the FP for high S/N, –band data in the Virgo cluster (Graham & Colless (1997)). Instead, allowing for dynamical deviations from homology, via galaxy to galaxy variations in the mapping from to , appears to cause significant changes in the slope of the FP (Busarello et al. (1997); cf. Graham & Colless (1997)). Busarello et al. found a relationship between the velocity dispersions to be . Substituting for into the –band FP solution in Equation 2 produces
| (16) |
which is statistically consistent with the virial expectation of . This argument suggests that the deviation of the near–infrared FP from the virial expectation can be fully explained by systematic deviations of the velocity structure of elliptical galaxies from a homologous family, removing the requirement of large age spreads among elliptical galaxies.
Since either dynamical non-homology or large age spreads could produce the slope of the near–infrared FP, it is impossible to distinguish between these two simple models without further analysis. In addition, any model which incorporates either age or dynamical deviations from a homology along with metallicity variations cannot be excluded in this simple analysis, either. This strongly suggests that a much more detailed analysis, along with a more complicated model with several different variables, is necessary to explain the global properties of elliptical galaxies.
One last ad hoc model can be constructed in which there is a conspiracy between metallicity and age effects that act in a manner to keep the FP thin. In this model, there can be a large spread in age and metallicity at any given point of the FP—under the constraint that the two effects of age and metallicity work opposite to each other and thereby cancel out to maintain a small scatter. While this model would work at optical wavelengths, the independence of near–infrared light to metallicity would cause the thinness of the optical FP to break down into a thick, near–infrared FP. Since the near–infrared FP has similar observed and intrinsic thicknesses when compared to the optical FP, especially when considering the additional observational uncertainties on caused by for the steeper slope of the near–infrared FP, this model can be excluded.
5 Discussion
The near–infrared FP that has been constructed in this paper has several important properties: (1) it deviates from the virial expectation (assuming constant and homology); (2) it is steeper than the optical FP relations; (3) it has a similarly small scatter when compared to the optical FP relations; and (4) it has a small, but significantly resolved, intrinsic scatter. These observational constraints are sufficient to exclude a number of simple models for the origin of the FP, but they do not provide unique discrimination between composite models which include either age, systematic deviations from dynamical homology, or both. Small additional contributions due to metallicity variations are also possible.
Better insight is gained by including the Mg2 index into the analysis. The Mg2 form of the FP has much larger scatter than the standard form, which argues that Mg2 does not uniquely specify the depth of the potential well for each galaxy. This is entirely consistent with the resolved intrinsic scatter of the Mg2– relation. If some physical process like galactic winds (Yoshii & Arimoto (1987)) caused the metallicity and potential well for all elliptical galaxies to behave like a one–parameter family, then some other physical property, such as dissipation-less mergers or a large scatter in formation times, would be required to produce the small intrinsic scatter of the Mg2– relation and the large intrinsic scatter of the Mg2 form of the FP.
The near–infrared FP has the unique property that the –band light is virtually independent of metallicity. For this reason, residuals of the –band FP (or the –band relationship between and ) and the Mg2– relations could provide a strong discrimination between age and metallicity effects. The lack of any clear correlation between these residuals implies that neither age nor metallicity is a unique contributor to the intrinsic scatter of the FP or the Mg2– relations.
The Fundamental Plane is not just a simple correlation of the observed properties of elliptical galaxies, but rather a unique tool for studying the intrinsic physical properties spanned by these galaxies. The remarkable homogeneity of properties of elliptical galaxies that is implied by the regularity and thinness of the optical FP is clearly reproduced by their similarly regular properties in the near–infrared bandpass.
| Cluster or | Simultaneous Fit | Individual Fits | Constrained Fits | ||||||||||
|---|---|---|---|---|---|---|---|---|---|---|---|---|---|
| Group | rms | rms | rms | ||||||||||
| (dex) | (dex) | (dex) | |||||||||||
| (1) | (2) | (3) | (4) | (5) | (6) | (7) | (8) | (9) | (10) | (11) | (12) | ||
| Coma | -7.950 | 60 | 0.086 | 1.33 | 0.19 | 0.302 | 0.03 | 0.082 | 1.57 | 0.15 | 0.088 | ||
| A194 | -7.734 | 16 | 0.107 | 1.57 | 0.21 | 0.254 | 0.05 | 0.106 | 1.60 | 0.16 | 0.110 | ||
| A2199 | -8.128 | 23 | 0.093 | 1.53 | 0.22 | 0.342 | 0.03 | 0.088 | 1.40 | 0.16 | 0.086 | ||
| A2634 | -8.028 | 15 | 0.076 | 1.19 | 0.74 | 0.292 | 0.06 | 0.061 | 1.24 | 0.30 | 0.063 | ||
| Cen45 | -7.543 | 6 | 0.071 | ||||||||||
| Cen30 | -7.526 | 14 | 0.124 | 1.72 | 0.41 | 0.299 | 0.08 | 0.123 | 2.05 | 0.39 | 0.139 | ||
| Fornax | -7.274 | 15 | 0.137 | 2.56 | 0.65 | 0.339 | 0.06 | 0.156 | 2.11 | 0.30 | 0.128 | ||
| Hydra | -7.669 | 17 | 0.086 | 1.76 | 0.34 | 0.344 | 0.03 | 0.080 | 1.77 | 0.15 | 0.086 | ||
| Klemola 44 | -8.041 | 11 | 0.067 | 1.50 | 0.58 | 0.309 | 0.05 | 0.068 | 1.74 | 0.28 | 0.069 | ||
| Pegasus | -7.580 | 4 | 0.048 | ||||||||||
| Perseus | -7.802 | 19 | 0.100 | 1.98 | 0.59 | 0.310 | 0.05 | 0.125 | 1.66 | 0.33 | 0.104 | ||
| Pisces | -7.723 | 11 | 0.087 | 1.04 | 0.27 | 0.350 | 0.05 | 0.055 | 1.17 | 0.19 | 0.055 | ||
| Virgo | -7.175 | 27 | 0.115 | 1.77 | 0.25 | 0.374 | 0.03 | 0.120 | 1.62 | 0.12 | 0.118 | ||
| Eridanus | -7.312 | 5 | 0.061 | ||||||||||
| Leo | -6.932 | 3 | 0.253 | ||||||||||
| N5846grp | -7.436 | 5 | 0.101 | ||||||||||
Note. — (1) The FP fits in this table are to the form of Equation 1. (2) The simultaneous fit for columns 2–4 corresponds to the solution in Equation 2, allowing only the intercepts to vary between clusters. (3) The individual cluster FP fits in columns 5–9 are for only those 11 clusters with numbers of galaxies . (4) The constrained, individual cluster fits of columns 10–12 were obtained by fixing . (5) The rms in all cases is evaluated along the axis.
References
- Baum (1959) Baum, W. A. 1959, PASP, 71, 106
- Bender, Burstein, & Faber (1992) Bender, R., Burstein, D., & Faber, S. M. 1992, ApJ, 399, 462
- Bower, Lucey, & Ellis (1992) Bower, R. G., Lucey, J. R., & Ellis, R. S. 1992, MNRAS, 254, 601
- Bruzual (1983) Bruzual, A. G. 1983, ApJ, 273, 105
- Busarello et al. (1997) Busarello, G., Capaccioli, M., Capozziello, S., Longo, G., & Puddu, E. 1997, A&A, 320, 415
- Capelato, de Carvalho, & Carlberg (1995) Capelato, H. V., de Carvalho, R. R., & Carlberg, R. G. 1995, ApJ, 451, 525
- Capelato, de Carvalho, & Carlberg (1997) Capelato, H. V., de Carvalho, R. R., & Carlberg, R. G. 1997, in Galaxy Scaling Relations: Origins, Evolution, and Applications, Proceedings of the Third ESO–VLT Workshop, eds. L. N. da Costa & A. Renzini (Springer–Verlag: Berlin), 331
- de Carvalho & Djorgovski (1989) de Carvalho, R. R., & Djorgovski, S. 1989, ApJ, 341, L37
- Charlot, Worthey, & Bressan (1996) Charlot, S., Worthey, G., & Bressan, A. 1996, ApJ, 457, 625
- Ciotti, Lanzoni, & Renzini (1996) Ciotti, L., Lanzoni, B., & Renzini, A. 1996, MNRAS, 282, 1
- Djorgovski, de Carvalho, & Han (1988) Djorgovski, S. G., de Carvalho, R., & Han, M.-S. 1988, in The Extragalactic Distance Scale, ASP Conf. Ser. Vol. 24, eds. S. van den Bergh & C. J. Pritchet (San Francisco, ASP), 329
- Djorgovski & Davis (1987) Djorgovski, S., & Davis, M. 1987, ApJ, 313, 59
- Djorgovski & Santiago (1993) Djorgovski, S., & Santiago, B. X. 1993, in Proceedings of the ESO/EIPC Workshop on Structure, Dynamics, and Chemical Evolution of Early–Type Galaxies, ed. J. Danziger, et al., ESO publication No. 45, 59
- Dressler (1984) Dressler, A. 1984, ApJ, 281, 512
- Dressler et al. (1987) Dressler, A., Lynden-Bell, D., Burstein, D., Davies, R. L., Faber, S. M., Terlevich, R. J., & Wegner, G. 1987, ApJ, 313, 42
- Faber & Jackson (1976) Faber, S. M., & Jackson, R. E. 1976, ApJ, 204, 668
- Franx, Illingworth, & Heckman (1989) Franx, M., Illingworth, G., & Heckman, T. 1989, AJ, 98, 538
- Graham & Colless (1997) Graham, A., & Colless, M. 1997, MNRAS, 287, 221
- Guzmán, Lucey, & Bower (1993) Guzmán, R., Lucey, J. R., & Bower, R. G. 1993, MNRAS, 265, 731
-
Guzmán (1995)
Guzmán, R. 1995, in Proceedings of the Heron Island Workshop on Peculiar
Velocities in the Universe,
http://qso.lanl.gov/~heron/ - Hudson et al. (1997) Hudson, M. J., Lucey, J. R., Smith, R. J., & Steel, J. 1997, MNRAS, in press
- Jefferys et al. (1987) Jefferys, W. H., Fitzpatrick, M. J., McArthur, B. E., and McCartney, J. E. 1987, “GaussFit: A System for Least Squares and Robust Estimation,” The University of Texas at Austin
- Jørgensen (1998) Jørgensen, I. 1998, MNRAS, in press
- (24) Jørgensen, I., Franx, M., & Kjærgaard, P. 1995a, MNRAS, 273, 1097
- (25) Jørgensen, I., Franx, M., & Kjærgaard, P. 1995b, MNRAS, 276, 1341
- Jørgensen, Franx, & Kjærgaard (1996) Jørgensen, I., Franx, M., & Kjærgaard, P. 1996, MNRAS, 280, 167
- Kormendy (1977) Kormendy, J. 1977, ApJ, 218, 333
- Lucey & Carter (1988) Lucey, J. R., & Carter, D. 1988, MNRAS, 235, 1177
- Lynden-Bell et al. (1988) Lynden–Bell, D., Faber, S. M., Burstein, D., Davies, R. L., Dressler, A., Terlevich, R. J., & Wegner, G. 1988, ApJ, 326, 19
- Mould (1978) Mould, J. R. 1978, ApJ, 220, 434
- Murphy et al. (1995) Murphy, D. C., Persson, S. E., Pahre, M. A., Sivaramakrishnan, A., & Djorgovski, S. G. 1995, PASP, 107, 1234
- Pahre (1998) Pahre, M. A. 1998, ApJS, submitted
- Pahre, de Carvalho, & Djorgovski (1998) Pahre, M. A., de Carvalho, R. R., & Djorgovski, S. G. 1998, AJ, submitted
- Pahre & Djorgovski (1997) Pahre, M. A., & Djorgovski, S. G. 1997, in The Nature of Elliptical Galaxies, Proceedings of the Second Stromlo Symposium, eds. M. Arnaboldi, G. S. Da Costa, & P. Saha, ASP Conf. Ser. Vol. 116, (San Francisco: ASP), 154
- Pahre, Djorgovski, & de Carvalho (1995) Pahre, M. A., Djorgovski, S. G., & de Carvalho, R. R. 1995, ApJ, 453, L17
- Pahre, Djorgovski, & de Carvalho (1997) Pahre, M. A., Djorgovski, S. G., & de Carvalho, R. R. 1997, in Galaxy Scaling Relations: Origins, Evolution, and Applications, Proceedings of the Third ESO–VLT Workshop, eds. L. N. da Costa & A. Renzini (Springer–Verlag: Berlin), 197
- (37) Peletier, R. F., Davies, R. L., Illingworth, G. D., Davis, L. E., & Cawson, M. 1990a, AJ, 100, 1091
- (38) Peletier, R. F., Valentijn, E. A., & Jameson, R. F. 1990b, A&A, 233, 62
- Persson, Frogel, & Aaronson (1979) Persson, S. E., Frogel, J. A., & Aaronson, M. 1979, ApJS, 39, 61
- Recillas-Cruz et al. (1990) Recillas-Cruz, E., Carrasco, L., Serrano, P. G., & Cruz-González, I. 1990, A&A, 229, 64
- Recillas-Cruz et al. (1991) Recillas-Cruz, E., Carrasco, L., Serrano, P. G., & Cruz-González, I. 1991, A&A, 249, 312
- Sandage (1972) Sandage, A. 1972, ApJ, 176, 21
- (43) Sandage, A., & Visvanathan, N. 1978, ApJ, 223, 707
- (44) Sandage, A., & Visvanathan, N. 1978, ApJ, 228, 81
- Sandage & Perelmuter (1990) Sandage, A., & Perelmuter, J.-M. 1990, ApJ, 361, 1
- Smith et al. (1997) Smith, R. J., Lucey, J. R., Hudson, M. J., & Steel, J. 1997, MNRAS, in press
- Terlevich et al. (1981) Terlevich, R. J., Davies, R. L., Faber, S. M., & Burstein, D. 1981, MNRAS, 196, 381
- Tonry & Davis (1981) Tonry, J. L., & Davis, J. 1981, ApJ, 246, 680
- Tonry et al. (1997) Tonry, J. L., Blakeslee, J. P., Ajhar, E. A., & Dressler, A. 1997, ApJ, 475, 399
- Visvanathan & Sandage (1977) Visvanathan, N., & Sandage, A. 1977, ApJ, 216, 214
- Worthey (1994) Worthey, G. 1994, ApJS, 95, 107
- Worthey, González, & Faber (1992) Worthey, G., González, J. J., & Faber, S. M. 1992, ApJS, 398, 69
- Worthey, Trager, & Faber (1995) Worthey, G., Trager, S. C., & Faber, S. M. 1995, in Fresh Views of Elliptical Galaxies, ASP Conf. Ser. Vol. 86, eds. A. Buzzoni & A. Renzini (San Francisco: ASP) 203
- Yoshii & Arimoto (1987) Yoshii, Y., & Arimoto, N. 1987, A&A, 188, 13