11affiliation: We wish to dedicate this paper to the memory of Robert M. Light, whose selfless service to the WFPC-1 IDT made this work and many others possible. 22affiliation: Based on observations with the NASA/ESA Hubble Space Telescope, obtained at the Space Telescope Science Institute (STScI), which is operated by the Association of Universities for Research in Astronomy (AURA), Inc., under National Aeronautics and Space Administration (NASA) Contract NAS 5-26555.
Abstract
Multicolor HST WFPC-2 images are used to study the central structure of the three Local Group galaxies M31, M32, and M33. PSF-deconvolution and modeling of image aliasing are required to recover accurate brightness profiles within The data present a study in contrasts that suggests different evolutionary histories. In M31, the nucleus is double-peaked, as found by WFPC-1 and confirmed by WFPC-2. The dimmer peak, P2, is closely centered on the bulge isophotes to , implying that it is the dynamical center of the galaxy. Directly on P2 lies a UV-bright compact source that was discovered by King et al. (1995) at 1700 Å. WFPC-2 images now show that this source is resolved, with It dominates the nucleus at 3000 Å, and its spectral energy distribution is consistent with late B-early A stars. This probable nuclear star cluster may consist of young stars and be an older version of the central cluster of hot stars that now sits at the center of the Milky Way, or it may consist of heavier stars built up from collisions in a possible cold disk of stars orbiting P2. Aspects of its formation remain highly problematic. In M32, new images show that the central cusp continues to rise into the HST limit with slope and the central density The and color profiles are essentially flat, and there is no sign of an inner disk, dust, or any other structure. This total lack of features seems at variance with a nominal stellar collision time of yr, which implies that a significant fraction of the light in the central pixel should come from blue stragglers. This discrepancy is eased but not completely removed if the stellar population is young ( yr). The stubborn normalcy of M32 at tiny radii may be emerging as an important puzzle. In M33, the nucleus has an extremely steep power-law profile for that appears to become somewhat shallower as the HST resolution limit is approached. The profile for can be described as having either a cusp or a small core with The central density is , and the implied central relaxation time is only yr, indicating that the nucleus is highly relaxed. The accompanying short collision time of yr predicts a central blue straggler component that is quantitatively consistent with the strong and color gradients seen with HST and from the ground. When combined with the Galaxy, the nuclei of the Local Group show surprisingly similar radial density profiles but divide into two classes according to velocity dispersion and black hole content: M31, M32, and the Milky Way are dominated dynamically (and stabilized against relaxation) by massive central black holes, while M33 lacks a dominant black hole. An obvious hypothesis is that a sizable stellar spheroid (which M33 lacks) is necessary to grow a massive black hole. A further implication is that the black hole growth in M31, M32, and the Milky Way was accompanied by evolution in the stellar density profiles, stellar populations, and dynamical structure of these nuclei such that their past appearance may have differed significantly from what they look like today. In short, HST observations are taking us to scales where understanding the central structure of galactic nuclei is intimately connected to the detailed interactions among their central stellar populations.
1 Introduction
The three Local Group galaxies M31, M32, and M33 have central structures as diverse as their global morphologies. M31 has a double nucleus of unknown origin embedded in a bulge that has a relatively large core (Lauer et al. 1993). M32 has a smooth brightness profile that monotonically rises to extreme stellar densities but that contains no separate nuclear component (Lauer et al. 1992). M33, in contrast, has an extremely compact star cluster at its center that has little apparent relation to the surrounding galaxy. M31 and M32 both have strong nuclear rotation and velocity dispersion gradients that are evidence for massive central black holes (for M31 see Dressler & Richstone 1988, Kormendy 1988, and Bacon et al. 1994; for M32 see Tonry 1984, Tonry 1987, Dressler & Richstone 1988, Bender, Kormendy, & Dehnen 1996, van der Marel et al. 1997, and van der Marel et al. 1998), while the low rotation and velocity dispersion of the M33 nucleus place tight upper limits on the mass of any central dark object (Kormendy & McClure 1993).
One common element among these galaxies is their proximity. HST observations of all three systems have spatial resolution of only a scale inaccessible for any other galactic system beyond the Local Group. Sub-parsec resolution proves crucial for even beginning to reveal the central properties of these galaxies. M31, M32, and M33 thus may be important “stand-ins” for galaxies at much larger distances. Extensive work on M31 and M32 was conducted with WFPC-1 and FOC prior to the spherical aberration correction. WFPC-2 observations now offer the opportunity to revisit these galaxies with both improved spatial resolution and dynamic range, with the hope of clarifying some of the issues unresolved by earlier work.
Prior to HST, the central structure of M31 was considered to be the prototypical example of a dense nuclear star cluster embedded within the core of a separate bulge system. HST, however, showed that the M31 nucleus was double. The light that had dominated the ground-based images and spectra at optical and near-IR wavelengths actually came from a bright component (designated P1 by Lauer et al. 1993) apparently physically separate and displaced by from a less luminous system, P2, that itself was at the true photometric and dynamical center of the bulge. One obvious explanation was that P1 represented the final stages of another galaxy being cannibalized by M31; however, this picture presented numerous difficulties related to the timing, dynamics, and detailed physical properties of the central components (Lauer et al. 1993). Tremaine (1995) suggested that the brightness peak at P1 could be explained as the apogalatica of stars orbiting P2 in an eccentric disk. Separately, King, Stanford, & Crane (1995) showed that P2 actually outshone P1 at far-UV wavelengths, with perhaps some of the light associated with P2 having a nonthermal origin.
The resolution of the WFPC-1 and FOC was more than adequate to reveal the important morphological details of the M31 nucleus. Understanding its complex form, and testing the Tremaine model in particular, is more likely to require higher-resolution dynamics than better imaging data. Nevertheless, the new WFPC-2 observations presented here have vastly improved dynamical range over the older data, permitting careful tests for color gradients within the nucleus that might indicate interesting changes in the stellar population, as well as allowing a search for subtle effects of dust or other components. The data have been also taken with extremely high and improved spatial sampling to reveal any secular morphological evolution of the nucleus at future epochs.
The central structure of M32 may be typical of small elliptical galaxies in general. WFPC-1 showed that the central stellar density of M32 may exceed for , yet its density profile at a scale accessible with HST in the Virgo cluster, is typical for a low-luminosity elliptical (Lauer et al. 1995). Further, M32 shows no evidence for harboring a separate nuclear star cluster, disk, dust, or any other structure apart from the smooth, monotonic rise of the overall stellar density distribution. A remaining issue is the precise form of the central profile at which is poorly constrained by the WFPC-1 images. Lauer et al. (1992) showed that M32 could be fitted with models that ranged from those with a small core, to those with a cusp interior to this radius, with a corresponding range in central density of to This scale is of sharp interest as central relaxation and even stellar collisions are important over the age of the universe at these densities, unless the central dynamics are strongly dominated by a massive black hole. The new WFPC-2 observations of M32 have the previous spatial resolution, allowing for a much improved lower limit to the central density of M32. Further, as for M31, the improved dynamic range allows for the detection of subtle color gradients that may be associated with changes in the central stellar population.
The nuclear star cluster at the center of M33 may reach central stellar densities similar to that of M32 (Kormendy & McClure 1993). Kormendy & McClure further showed that the nucleus has a strong color gradient in the sense that the center of the cluster is bluer than its outskirts. They discuss the intriguing possibility that stellar collisions at the center of the M33 nucleus have substantially altered its stellar population by making a young generation of blue stragglers. The contrast with M32 is particularly interesting. Lauer et al. (1992) argue from the lack of color gradients and other data that relaxation and stellar collisions have not taken place in the center of M32. The cross-sections for relaxation and physical collisions between stars decrease rapidly with increasing stellar velocity dispersion (for velocities less than the stellar escape velocities), due to the decreasing size of the gravitational sphere of influence of the individual stars. The black hole believed to be at the center of M32 (see Kormendy & Richstone 1995 for a review) would thus raise orbital speeds and greatly lengthen the relaxation and collision time scales in M32. Kormendy & McClure, in contrast, show that M33 has a central velocity dispersion of only 21 km s-1, thus making it highly likely that stellar relaxation and physical collisions have strongly modified the structure of the M33 nucleus. A basic goal of the new WFPC-2 observations is to obtain an improved estimate of the central density of the M33 cluster, as well as to explore further the centrally blue color gradient detected by Kormendy & McClure.
We present the new images and profiles of M31, M32, and M33, followed by comparisons and contrasts among the three galaxies and the Milky Way nucleus in the following sections. Our overall conclusion is that M31, M32, and the Milky Way have had similar formation histories but that M33 stands apart owing to its lack of a black hole. This difference may be related to the presence of a spheroidal component in the first three galaxies but the lack of one in M33. However, even the black-hole nuclei differ in detail, and the differences beg an explanation. An important part of this work is understanding the resolution limits of the new WFPC-2 data. Although the spherical aberration correction in the WFPC-2 optics represents a vast improvement over the aberrated WFPC-1 observations, the HST+WFPC-2 PSF remains important, and its blurring effects must be accounted for in quantitative work by either deconvolution or modeling.
2 Observations and Analysis
2.1 Observational Material
The WFPC-2 observations of M31, M32, and M33 are summarized in Table 1. The galaxies were centered in the high-resolution PC1 CCD for all images. The exposure times were set with the general goal of exceeding in the central pixel of the galaxies, although time constraints prevented the F300W exposures of M31 from achieving this level. In addition, little if any galaxy light was seen in the F160W exposures of M31 despite the long exposure, due to the poor far-UV sensitivity of WFPC-2. A low gain setting (DN) was used for the F555W and F814W exposures to reach levels high enough to measure the separation of P1 and P2 with especially high precision. The and M31 exposures were also dithered by 0.5 PC pixels, mapping out a subpixel pattern to counter the undersampling present in PC images. Dithered F555W images of the quadrupole gravitational lens 2237+0305 (discovered by Huchra et al. 1985) were also obtained near in time to M31, with the lens positioned at the same location on the PC1 CCD. These observations are not presented here but can serve as an astrometric reference for M31 observations taken at future epochs. Deep exposures at the normal gain setting (DN) were also obtained in F555W and F814W for M31, and F555W for M33, to look for faint point sources near the centers of these galaxies.
Basic reduction of the images was accomplished with calibration products kindly provided by the WFPC-2 Investigation Definition Team (IDT). The observations were obtained with the telescope guiding in fine-lock, and, with the exception of the dithered F555W and F814W exposures of M31, the multiple images in each filter sequence were generally registered to better than 0.05 pixels, enabling excellent cosmic ray rejection. The guiding performance for all images was excellent, with the jitter always being or less.
Cosmic ray rejection was complex for the dithered M31 images, as the 0.5 pixel shifts were enough to cause significant changes in the image structure that could be mistaken for cosmic ray events by a simple statistical examination of the pixel values. The rejection of cosmic rays was done iteratively; cosmic rays in a given image were identified by using an average of the remaining frames shifted to its position for comparison. This process was repeated a second time after initial identification of cosmic rays in the comparison frames.
The final F555W and F814W images of M31 were built from the dithered sets by simply interleaving the four images for each filter. The images used for analysis thus have pixels spaced every or 0.5 PC pixel. These images can be viewed as M31 convolved with the HST+PC PSF and a box the size of a PC pixel, but then sampled with a grid finer than that of the PC. The F555W and F814W M31 images are thus Nyquist-sampled.
2.2 Image Deconvolution
Despite the dramatic improvement in image quality provided by the corrective optics installed in WFPC-2, PSF blurring is still important in the new data, and deconvolution or modeling of the images will still be required for quantitative analysis. This can be seen clearly in Figures 1

and 2, which compare the F555W

brightness profiles for M32 and M33 before and after 40 iterations of Lucy-Richardson deconvolution (Richardson 1972; Lucy 1974) to the deconvolved WFPC-1 profiles of the same systems. The central few pixels of the profiles as observed with WFPC-2 are clearly depressed compared to the same profiles after deconvolution. Indeed, in M32 the effects of blurring persist at greater than 5% of the local surface brightness as far out as In contrast, the deconvolved profiles of both WFPC-1 and WFPC-2 are in excellent agreement at the few percent level for with the superior resolution of WFPC-2 evident in the central two points in the profiles. Deconvolution simulations of WFPC-1 data conducted by Lauer et al. (1992) had predicted that the WFPC-1 data could provide accurate brightness profiles for after deconvolution; the current deconvolved WFPC-2 profiles provide direct verification of this. Indeed, as can be seen in both Figures 1 and 2, the WFPC-1 deconvolved profiles actually prove more faithful to the brightness distributions of the galaxies than do the WFPC-2 profiles prior to deconvolution.
To explore the effects of deconvolution further, deconvolution simulations are presented in Figure 3 on the

same M32 galaxy model simulated by Lauer et al. (1992) but with appropriate to the present observations. The figure shows the residuals of profiles at various levels of deconvolution as compared to the input model. The dashed line shows the difference between the model and observation prior to deconvolution. verifying the difference between the WFPC-2 observed and deconvolved profiles of M32 shown in Figure 1. As can be seen, most of the deconvolution correction takes place in the first few iterations of Lucy-Richardson. Ten iterations restore the profile to about the same level of resolution as did 80 iterations on WFPC-1 images. After 40 iterations, the profile matches the model with errors of typically only a few percent over the entire profile; for (outside the central pixel), the deconvolved profiles can be taken as a faithful rendition of the intrinsic galaxy profile to %. In this particular experiment, even the central pixel is recovered at the few percent level. As was emphasized by Lauer et al., however, the exact central deficit depends on the input model; the particular residual in this experiment should not be applied as a general correction. Again, image modeling is likely to be required at this stage. The final residual blurring of the central pixel is also considerably smaller in WFPC-2 than in WFPC-1, allowing the possibility of using an integrated central luminosity constraint, which was essentially impossible with WFPC-1.
Evaluating the deconvolved profiles also requires understanding the effects of uncertainties in the PSF. We evaluate this potential source of systematic error by using different stellar images as representations of the PSF. Fortunately, it appears that plausible variations in the PSF produce both clear and benign effects in the deconvolved profile. The sole effect of plausible uncertainties in the core of the PSF is to modulate the brightness of the central pixel relative to its immediate neighbors. In particular, we find that the central pixel may vary by mag when deconvolved with different PSFs. A more important problem is how the galaxy images are centered within a pixel, as at F555W the WFPC-2 images are undersampled. Such undersampling causes aliasing, which can artificially broaden sharp cusps or nuclei at the galaxy centers. We discuss the particular effects of this error on M32 and M33 below; but, in brief, after accounting for aliasing one can discriminate among various interesting possibilities for the intrinsic central brightnesses of the two galaxies. A final concern is allowing for the extended wings of the PSF. The wings only contribute to low wavenumbers in the Fourier domain; thus they mainly affect the accuracy of the overall slope of the profile on arcsecond scales rather than at the HST resolution limit. Nevertheless, because color gradients are generally very shallow in galaxies, accurate representation of the PSF wings in all colors is vital for measuring such gradients.
The PSFs used for the deconvolutions were constructed from several individual star exposures obtained over the time span of the galaxy observations. The bulk of the images came from a routine monthly calibration program that imaged a standard star centered in the PC. Other data came from WFPC-1 IDT stellar photometry programs. For the F555W PSF, the dithered gravitational lens images of 2237+0305 provided excellent sampling of the PSF core. In all cases, only deep exposures that had well-exposed wings were used. The composite PSFs have total exposure levels of and extend out to the size of the images is pixels, or (the PSFs used for the dithered M31 images have the same angular extent but double the sampling).
2.3 M31
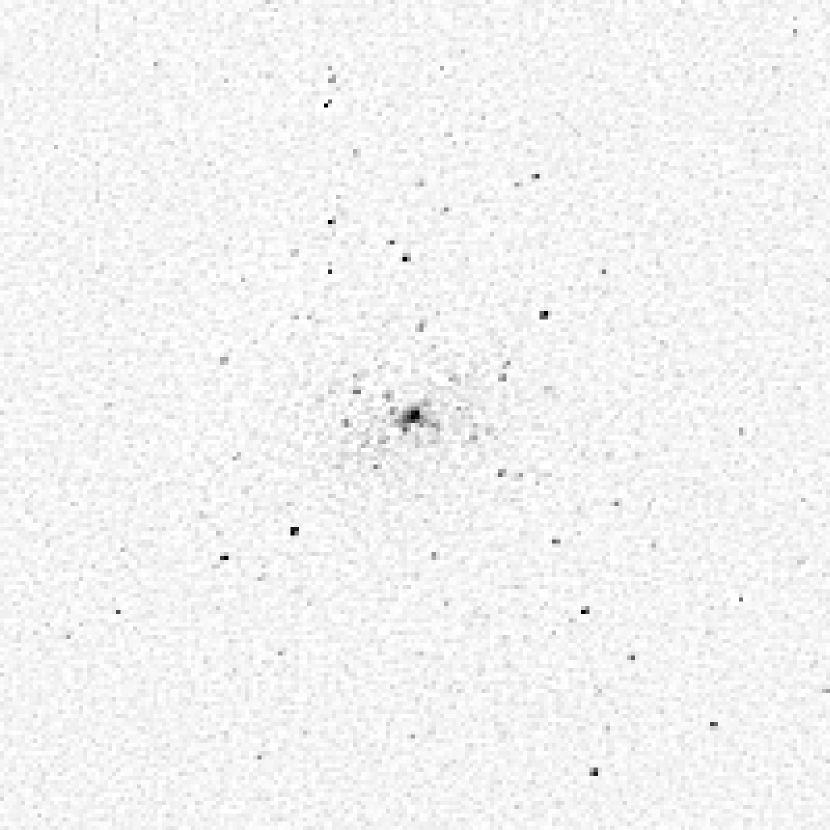
The F555W, F814W, and F300W images of the M31 nucleus after deconvolution (with 40 iterations) are shown in Figures 4 and 5.


![[Uncaptioned image]](/html/astro-ph/9806277/assets/x6.png)

Note that the F555W and F814W images have been constructed from dithered image sets and thus have double the normal PC pixel scale, while the F300W image is undithered. The images show the same gross morphology that was already evident in the WFPC-1 images (Lauer et al. 1993); thus we will not repeat the extensive set of decomposition experiments that were tried by Lauer et al. (1993) and King et al. (1995). We do, however, present the V-band brightness profile as measured with the portion of the image dominated by P1 excluded from the fit in Table 3. One obvious consequence of the improved dynamical range of the new data is the detection of strong surface brightness fluctuations in the V and I images, visible as strong mottling (Figure 4). Ajhar et al. (1997) have measured surface brightness fluctuation (SBF) amplitudes for the images presented here. In F555W, the typical SBF “star” has At the central surface brightness in P1 of 13.4, there are thus SBF stars in each pixel, giving a relative noise level of 7%. In F814W, the surface brightness of P1 is 12.0, which for SBF implies a noise level of 12%. Clearly at HST resolution, we are running out of the very stars that trace the structures that we are trying to understand; the dominant error is not photon noise but the finite number of stars that make up M31 itself. SBF is less apparent to the eye at F300W, but this image clearly contains a number of bright stellar sources surrounding the nucleus. The pattern of these sources matches that seen in the King et al. (1992) FOC image taken at F175W; King et al. argued that these are PAGB stars.
Another improvement provided by the WFPC-2 images is a clearer picture of the structure of P2 and its immediate surroundings. P2 apparently corresponds to both the center of the galaxy and the massive black hole inferred to exist within the nucleus (see below). The F300W image is particularly interesting, as the dominance of the two peaks has reversed from that seen in the redder colors; at 3000 Å a compact blue source is strongly evident, centered on P2 (Figure 4). King et al. (1995) already showed that P2 was much brighter than P1 in the far-UV (at 1750 Å); we now see that the cross-over must occur between F300W and F555W. In the WFPC-2 F555W image, the compact source at P2 is still evident, if greatly reduced in amplitude. Normalized surface brightness distributions centered on P2 are shown in Figure 6

for the three colors presented here. The strength of the compact source in F300W is clearly evident; even at F555W the source causes the profile to rise above a shallow power-law cusp at Only at F814W is there no evidence of a source superimposed on the cusp. In passing, we note that WFPC-1 showed only that the F555W P2 profile consisted of a shallow cusp; the limited dynamic range of the aberrated observations made it exceedingly difficult to detect the faint compact central source against a bright background.
The blue P2 source is compact, but not point-like — it is slightly resolved. This is evident in Figure 7,
where we show the F555W image subtracted from the F300W image after it was sampled to match the P2 centroid in the F300W image and scaled to match the surface brightness of the outer portions of the nucleus. The residual blue excess of the P2 source clearly extends over several pixels, while the stellar sources noted above are only 1-2 pixels in size. The F300W profile (Figure 6) shows that the source has a half-power radius of or 0.2 pc. We estimate its flux by integrating the excess blue light within a 4 pixel radius in the difference image. The apparent luminosity of the source is By comparing the F555W and F814W images, we similarly conclude that the P2 source has King et al. (1995) raised the possibility that the P2 source was nonthermal emission from a low-level AGN and found it convenient to present their F175W luminosity in flux units. Using the zero-points given in Holtzman et al. (1995), we find and where we have adopted (Burstein & Heiles 1984) and (based on extrapolation from the O6 extinction table of Holtzman et al.). These fluxes can be compared to observed by King et al. The physical nature of the P2 source is discussed in
The new data confirm the conclusion reached by Lauer et al. (1993) that P2 corresponds to the photocenter of M31. The location of isophote photocenters as a function of V surface brightness is shown in Figure 8.

Centers were calculated by measuring the “center of mass” of all pixels within mag of a given isophote level. Isophotes with all have centers within of P2. Indeed, the centroid of pixels with is only from P2. As can be seen in Figure 9, which shows the central brightness profile of M31 after excluding the area strongly affected by P1, isophotes of this brightness are in radius and thus define the outer portions of the nucleus (that is the portion of the brightness profile that rises above the bulge profile). Isophotes at larger radii are affected by dust but also appear to have centers within of P2. Notably, the offsets seen in these cases are perpendicular to the P1-P2 vector (see the lowest surface brightness points in Figure 8); their projection on the P1-P2 vector is thus still close to P2.
Color variations appear to show that the center of the nucleus (the region within of P2) has a slightly different stellar population than the outer portions of the nucleus and surrounding bulge. Figure 10 shows the ratio of the F555W and F814W images. P1 is clearly redder in than the surrounding galaxy, but the region of red excess also extends into the region surrounding P2 on the opposite side from P1. The central region of P1 has while the color in a similar-sized aperture displaced from P2 in the “anti-P1” direction has The bulge and outer portion of the nucleus are bluer still with for On the other hand, P1 and its anti-region are bluer than the bulge in , with P1 having the anti-P1 part of P2 having and the isophotes with having In passing, we note that this result is in apparent contradiction to the results of King et al. (1995), who found redder-than-bulge colors in from pre-COSTAR FOC and WFPC-1 data in the region outside For comparison, P2 itself has and For convenience, these color measurements are summarized in Table 2.


That the center of the nucleus is redder than the bulge in yet bluer in may be reasonable; such combinations can in principle be created by simultaneous changes to both stellar population age and metallicity. However, an indisputable conclusion from the color difference is that the central nucleus contains stars with an origin different from the surrounding bulge. This may support the Tremaine (1995) eccentric disk model of the doubly-peaked nucleus; the disk would consist of material that has fallen into the nucleus after the central structure of M31 was already organized. Additional support for the Tremaine disk may come from the morphology of the red-excess region evident in Figure 10, given that it clearly extends to both sides of P2; P1 would simply be a local density enhancement in a population with a more extended spatial distribution. The intermediate color of the anti-P1 part of P2, that is a color between that of P1 and the bulge, may reflect underlying dilution of the disk by the bulge. It is also noteworthy that the intensity minimum between P1 and P2 that defines the double-peaked appearance of the nucleus has a color bluer than that of P1 but which matches the bulge.
2.4 M32
The F814W image of the M32 nucleus after deconvolution (with 40 iterations) is shown in Figure 11; a color image is shown in Figure 12.


Surface photometry profiles are presented in Figure 1 and Table 4. The surface photometry was measured with the algorithm of Kent (1983), as modified by Lauer (1985) for high-resolution applications. The algorithm uses sinc-interpolation and Fourier harmonics to measure the brightness distribution along isophotes at every integer-pixel step in semimajor axis length.
The most impressive feature of M32 is its incipient resolution into stars, as was also seen in M31. The surface brightness fluctuations in F814W are especially strong; as in M31, they dominate the profile error budget. Ajhar et al. (1997) have measured SBF amplitudes for the images presented here. In F555W the typical SBF “star” has With a central surface brightness of 10.96, or 17.67 per PC pixel, there are SBF stars in the central pixel, giving a relative noise level of 2.8%. In F814W, and implying a noise level of 5.0%. These errors are close to the deconvolution uncertainties in the central pixel.
Aside from the strong SBF pattern, we find no evidence for dust, disks, or any other structures present in M32 down to levels of a few percent in local surface brightness. Figure 13 shows a color
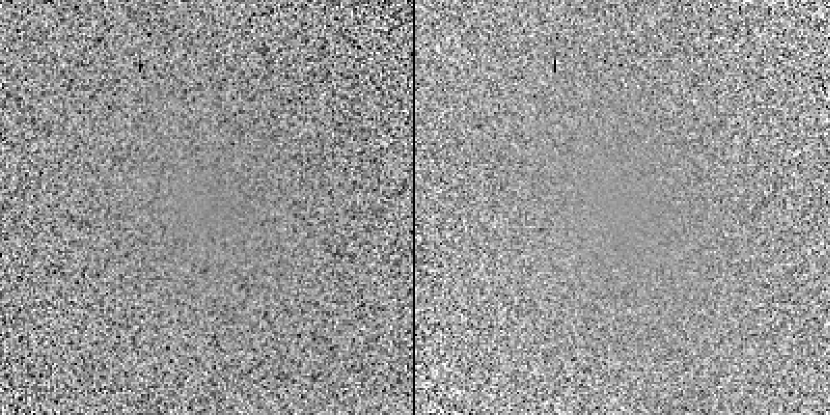
ratio image made by dividing the V image by the I image, and the residual map resulting from subtraction of models reconstructed from the F555W profile. All such comparisons are flat on average (although the color-ratio image shows dark “pits” due to the red color of barely resolved bright stars). The isophote shape profiles additionally show no evidence for any structures not accounted for by elliptical isophotes. Figure 14 shows the isophote shape parameters


for both F555W and F814W, which give the relative fourth harmonic deviations of the isophotes from perfect ellipses. Both profiles are noisy due to strong surface brightness fluctuations but show no evidence for the isophotes to be significantly “boxy” or “disky” (which would give significantly negative or positive respectively). This verifies the conclusions of Lugger et al. (1992) and Lauer et al. (1992) and stands in contrast with the claim by Michard & Nieto (1991) that the inner isophotes of M32 were disky, having positive Michard & Nieto specifically argued that a disk was visible in their reddest images and thus might be comprised of AGB stars. The F814W profile, while noisier than F555W, shows no greater evidence for a disk. It is also noteworthy that the ellipticity of M32 remains constant throughout the inner portion of the galaxy, having for (Figure 15). Lauer et al. (1992) argued that the isophote ellipticity in M32 stayed constant into the resolution limit, based on deconvolution simulations with WFPC-1; the constant ellipticity is shown directly here with WFPC-2 data.
As noted in the new WFPC-2 observations of M32 are in excellent agreement with the WFPC-1 F555W profile of Lauer et al. (1992) for but rise above the old WFPC-1 profile at smaller radii due to the improved resolution of WFPC-2. The new data allow us to resolve some of the ambiguity in the central structure of M32 due to uncertainties in the WFPC-1 profile. Lauer et al. (1992) showed that the central structure of M32 was well bracketed by a “core” model of the form:
| (1) |
where in the V-band corresponds to and a “cusp” model of the form:
| (2) |
where corresponds to Both of these models are shown in Figure 16.

All but the central point of the V profile fall on the cusp model. The core model fits less well, rising above the observed profile for and falling below the central two points. Since the deconvolution simulations show that the profile is accurate to at all but the central point, the cusp model can be taken as an excellent description of the M32 profile for or 0.3 pc.
Understanding the light distribution of M32 at smaller radii clearly depends on how well we can use the central point in the brightness profile as a constraint. If we take the effective radius of the central pixel as of the pixel width, or then it is offering information on the central 0.1 pc of M32. Superficially, the central point of the V profile falls below the cusp model by 0.34 mag. It appears that this deficit is not due to residual blurring from incomplete deconvolution. Simulated observations of the cusp model presented in show that even the central point in the deconvolved F555W profile can be recovered to with an accurate PSF. Further, the deconvolved image matches the observed image extremely well when it is convolved back to the resolution of the latter; if the deconvolution were incomplete, its central brightness would be too low to match the observation after this operation. Fitting the observed image with the PSF convolution of the deconvolved image plus a scaled PSF to make up for any central shortfall in the deconvolved image shows that the central pixel is likely to be underestimated by only mag. Systematic errors in the PSF are important and will cause corresponding profile errors larger than this amount. Using a different PSF that was less well sampled than the dithered F555W PSF used for the present results gives a deconvolved profile 0.06 mag brighter in the center. As noted above, the intrinsic error in the central brightness itself is 0.03 mag due to the finite number of central stars, in good agreement with the 0.04 mag of noise measured in the central pixel patch by comparing the image with a model reconstructed from the photometry. Adding the PSF error and surface brightness error in quadrature gives the total error in the central pixel of 0.07 mag.
The most serious difficulty with measuring the central brightness is that at F555W the PC images are undersampled by and are thus aliased. Aliasing causes spatial information above the Nyquist sampling frequency to contribute erroneously to structure at frequencies below the sampling frequency. In simpler terms, it causes irreversible broadening of features. This in fact appears to be happening at the very center of M32. Unfortunately, the photocenter of M32 appears to be significantly displaced from a pixel center. The CCD-row offset of the photocenter is only 0.15 pixels, but the CCD-column offset is 0.46, causing significant broadening of the M32 nucleus in this direction. To understand the quantitative effect of aliasing, we constructed an image of the M32 cusp model faithful to the orientation and centroid of the observation. The model image was constructed with subsampling of the PC pixels, with additional subsampling of the central portion of the cusp itself. When a profile was measured from the synthetic image positioned and binned to match the PC sampling, the value of the central pixel was fainter by 0.21 mag than the input model, leaving the the central difference between the cusp model and observed profile at only mag, no longer highly significant. A similar treatment of the core model shows that, once aliasing is accounted for (and the core model is rescaled in brightness to match the observed profile at ), the central observed point exceeds the central brightness of the core model by mag. The aliased central points of both models are shown in Figure 16 as horizontal lines bounding the observed central point.
The conclusion is that the center of M32 is significantly more concentrated than the core model. Despite aliasing corrections, the central point still falls below the cusp model, although with low significance. Lauer et al. (1992) concluded that the asymptotic slope of the cusp model has Taking the corrected central point as accurate implies for A Nuker-law fit of the form (Lauer et al. 1995)
| (3) |
to the -profile for gives corresponding to and this fit is shown in Figure 16; note that this model is essentially identical to the cusp model at all but the central pixel, where it predicts slightly less luminosity. In passing, we note that the large errors in the fit parameters include their high covariance; the overall form of the model is tightly constrained over the domain fitted (Byun et al. 1996). Taking the Nuker model as the best representation of the profile implies that the central mass density in stars (Figure 17)is at least at the HST resolution limit (assuming in solar units, and 770 kpc distance).

Clearly M32 remains “cuspy” at the resolution limit of HST. Answering the question of whether we are seeing the cusp start to flatten, however, should be addressed by obtaining new images with sub-pixel dithering.
At larger radii, the WFPC-2 observations place excellent constraints on color gradients that were not possible with WFPC-1. As noted in even with WFPC-2, the effects of the PSF still extend to surprisingly large radii, and accurate color gradients require deconvolution and a PSF accurate on large spatial scales. In the case of M32, it appears that the lack of color gradients at radii observable from the ground (for Michard & Nieto 1991; and Lugger et al. 1992) continues into the center at least in Figure 18 shows the color profile.

A fit to the trace for gives which is essentially flat. The color for becomes tantalizingly bluer. However, the intrinsic color error of the central point is 0.06 mag from SBF alone, and 0.10 mag when PSF errors are included — the apparently bluer color is not significant. As a check on this result, we obtained F336W PC exposures of M32 from the STScI archive and processed them as we did the present observations. The resulting color gradient is also shown in Figure 18; the fitted gradient is Further, Cole et al. (1998) found no far-UV (1600 Å) versus gradient for The colors should be a more sensitive test for hot stars at the center of M32 than as the color becomes redder towards the center, we find no evidence that M32 harbors any population similar to that at the center of P2. From the errors, we estimate that any blueing trend in the central pixel of M32 is no more than 15% of the blueing seen within pc in M31.
2.5 M33
The F555W image of the M33 nucleus after deconvolution is shown in Figure 19; a color image is shown in Figure 20.
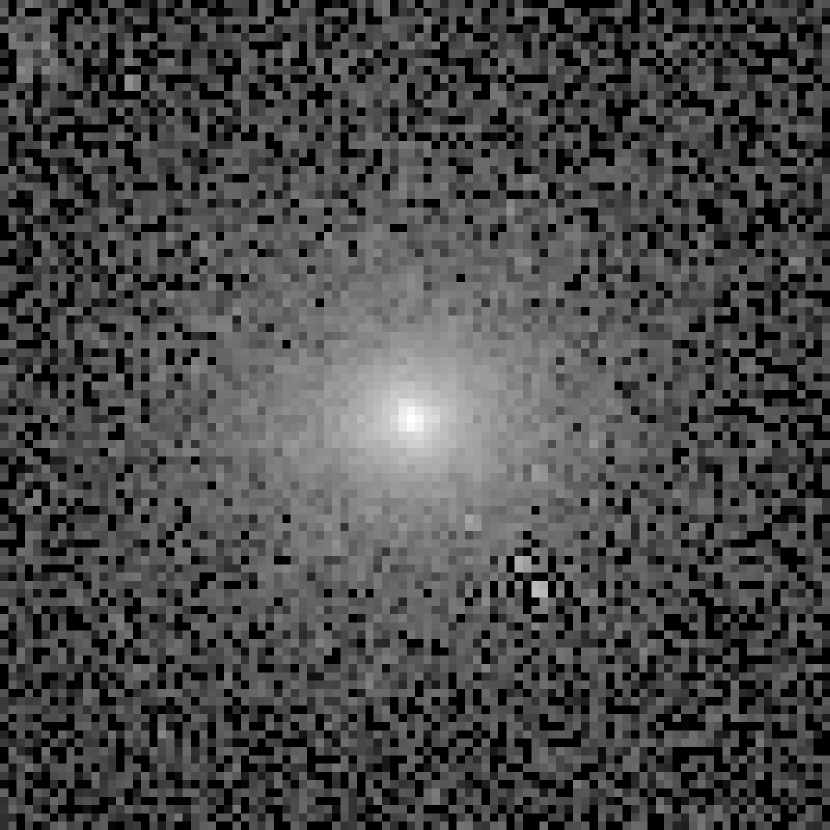

Surface photometry profiles are presented in Figure 2 and Table 5. Both the images and surface photometry plots show vividly that M33’s nucleus is extremely compact. While the central F555W surface brightness is brighter than 11 mag/□ arcsec, the brightness profile falls rapidly as a power law with slope for the first semi-decade in radius (), steepening to over the next semi-decade (). At , the nucleus profile begins to fall below the disk, having decreased to or dimmer than the central value. At the nucleus may be showing signs of incipient resolution into stars, but as the disk begins to dominate, it is difficult to associate any of the point sources at larger radii with the nucleus itself.
We first consider the WFPC-2 constraint on the central luminosity density. Kormendy & McClure (1993) argued that the M33 nuclear core radius must have based on seeing-convolved models. As shown in Figure 2, the present observations match the best Kormendy & McClure B-band profile for (assuming ), but climb to surface brightnesses over an order of magnitude brighter at small radii. Near the HST resolution limit, the M33 profile is still climbing steeply. If we take the deconvolved profile as accurate excluding the central point, then the first and second points out give consistent with the slope measured at The central point a priori is most likely to be a lower-limit on the true central surface brightness. Deconvolution experiments on simulated M33 profiles show that we can recover the central intensity at the few percent level, provided that the PSF is accurate; however, as with M32, aliasing of the images is important. The photocenter of M33 in the F555W image is displaced 0.41 pixels in the CCD row direction and 0.30 pixels in the column direction from the center of a pixel.
As with M32, we constructed models with steep central power-law profiles on a subpixel grid, and then binned the models to match the observations. For cusps with the aliasing of the M33 image depresses the central intensity from its true value by over 0.2 mag. The procedure for estimating the central brightness of M33 was to assume that its intrinsic profile continues inward as a constant power-law for and construct models for a range of slopes that produced central decrements bracketing the observations. The best fitting model gives after accounting for aliasing; the uncertainty reflects an adopted error in the observed central intensity of 0.07 mag due to PSF uncertainties and surface brightness fluctuations. This result suggests that the M33 nucleus profile is still becoming shallower near the HST resolution limit, continuing the slow decrease in logarithmic slope seen over Inward extrapolation of the slope seen just outside the center predicts an intensity decrement between the central and next pixel in the profile of 0.94 magnitudes, compared to the observed decrement of only 0.59 mag.
In contrast, Kormendy & McClure (1993) fitted their profiles to a form that included an “analytic” core, that is, one that requires smoothly as In this spirit, we also modeled the central portion of the profile with the form:
| (4) |
Fits to the V-band image give PC pixels. Defining as the half-power point implies thus or for a distance to M33 of 785 kpc. This form is no more favored than the constant cusp; thus this core size should be regarded only as an upper limit. We note that Massey et al. (1996) claimed from the present images obtained from the STScI archive; however, they neglected to account for the effects of the PSF or aliasing.

Abel inversion of the M33 brightness profiles implies that its nucleus reaches central mass densities of at least (Figure 17). While the peak luminosity density of M33 exceeds that of M32, Kormendy & McClure (1993) conclude that M33 has central a value less than that of the stellar population of M32. M32 thus reaches much higher mass-densities on the scales probed by HST.
The structural analysis was performed on the V-band image, as it has higher spatial resolution than the I-band image. Comparison of the V and I profiles reveals a strong central color gradient, which appears to be consistent with the color gradient observed by Kormendy & McClure (1993) at CFHT resolution. Figure 21 shows the color profile obtained from the two deconvolved profiles. The color appears to be constant at for but becomes bluer, with closer to the center. The low surface brightness of the nucleus at yields large errors with the fine-resolution brightness profiles used to generate the color profiles; using larger bins reduces the noise but still shows that is essentially constant for In passing, we note that even is significantly bluer than the typical for the central regions of elliptical galaxies (Lauer et al. 1998), consistent with the well known blue color of the M33 nucleus (van den Bergh 1991). These colors are as observed, without reddening corrections. For (Burstein & Heiles 1984), giving the central intrinsic and at larger radii.
Kormendy & McClure find over This gradient is larger in amplitude and occurs at larger radii than the gradient, but their data were not corrected for seeing. When the present data are degraded to the best CFHT seeing of the new profile appears constant for

but shows an essentially linear gradient for in good agreement with the general shape of the Kormendy & McClure profile (Figure 21). The present results thus confirm the Kormendy & McClure result that the nucleus becomes bluer towards the center. The larger compared to is consistent with the central population containing hotter stars, as discussed in the next section.
The surface photometry of M33 also includes information on the shape of the nucleus. Inspection of the images shows that the nucleus appears to be slightly flattened, which is confirmed by the isophote ellipticities plotted in Figure 22. The average isophote shape over the central arcsecond has with the nucleus becoming somewhat rounder towards its center. The position angles of the isophotes also appear to be constant, with average As discussed later, the relaxation time in the M33 nucleus is extremely short; the ellipticity of the nucleus is probably more likely due to rotation rather than an anisotropic velocity ellipsoid. Kormendy & McClure (1993) find a small velocity gradient of km s-1 arcsec-1 (with slit ), suggestive of rotation, which can be compared to the central velocity dispersion of km s-1. The slightly flattened shape of the nucleus appears to be consistent with this modest amount of rotation.
3 Discussion
3.1 M31
A key advance provided by the WFPC-2 images of M31 is the detailed look at the color and morphology of P2. As noted above, King et al. (1995) first observed the far-UV dominance of P2; the present data show that P2 dominates at 3000 Å as well and is much bluer in than P1, the rest of nucleus, and the surrounding bulge. As noted by Lauer et al. (1993) and confirmed here, P2 closely corresponds to both the dynamical and photocenter of M31, and thus is likely to coincide with the black hole inferred to exist at the center of M31 (Kormendy & Richstone 1995). King et al. were thus tempted to consider that the UV flux of P2 was optical emission associated with a low-level AGN. In support of this hypothesis they cited the radio source observed by Crane, Dickel, & Cowan (1992) and the X-ray source observed by Trinchieri & Fabbiano (1991), both coincident with the center and both having flux densities that bracketed the UV luminosity of P2. At the same time, King et al. realized that this picture probably required P2 to be a point source in the UV, an issue that was difficult to test with the aberrated FOC data.
The present images show that P2 actually has a half-light radius of at 3000 Å and is clearly extended in as well. This result suggests the more prosaic possibility raised by King et al. that there is tightly bound cluster of early-type stars associated with P2. The range of fluxes from 1750 Å to can potentially be explained by a population with K, which corresponds to late B to early A-type spectral class. This is in good agreement with the FOC F175W and F275W flux measurements by Brown et al. (1998), who estimate K, for P2. The smooth appearance of the P2 cusp implies that the stars are individually faint compared to the total luminosity; a turnoff at corresponding to K, would be suitably fainter than the total P2 blue source magnitude of
Although a cluster of warm stars might explain the blue center of P2, the origin of such a cluster is somewhat problematic. One obvious possibility is that the cluster consists of recently formed stars. The presence of gas and dust in the bulge of M31 would provide raw material for such stars. However, at 0.2 pc, the nominal core of the blue population, the local circular velocity about the black hole is km s-1, and the rotation curve is Keplerian with strong shear; it is difficult to picture even a disk of dense gas here as a favorable site for recent star formation (we discuss this issue further in ).
It may be possible that stellar collisions play a role in explaining the blue population. King et al. (1995) briefly considered this picture but dismissed it without quantitative discussion; however, the new stellar density profile suggests that this idea merits closer attention. In general, the mean time for any star to suffer a collision in a Maxwellian distribution of identical stars is
| (5) |
where is the stellar number density, is the 1-d stellar velocity dispersion, is the stellar mass, is the stellar radius, and is the “Safronov number” (Binney & Tremaine 1987). Abel inversion of the F555W profile centered on P2 implies that, near the HST resolution limit, the P2 stellar mass density has the form given the bulge (Kormendy 1988), and 770 kpc distance (Figure 17). For km s-1 implied by the nominal black hole 111For an density cusp surrounding a black hole, where is the black hole mass (Young 1980). A cusp of this type is not strictly correct for P2, but it is an excellent match to M32., the mean collision time for solar-type stars is (this calculation is summarized in Table 6). For a stellar population with lifetime yr, roughly 16% of main sequence turnoff stars would collide, and thus roughly 16% of the total stellar luminosity (see 3.2) would be radiated from blue-straggler-type stars of higher surface temperature. Within the accuracy of this calculation, this is not far from the 20% excess light contributed by the blue population of P2 in the V-band.
On the other hand, the stellar density profile presented in Figure 17 presumes constant which will not to be valid if P2 has been modified by stellar collisions; the central density will be overestimated and thus the collision time underestimated. The central blue part of P2 is clearly visible in the density profile as a distinct inflection; naive inward extrapolation of the outer part of the P2 cusp yields a more modest and at 0.1 pc. With this collision time, the contribution of blue light would be only %. Furthermore, the K effective temperature of the warm component, corresponding to a mean spectral type earlier than A0, is hotter than blue stragglers seen in globular clusters, which are typically late A or F stars. It is not clear that single collisions of two main-sequence turnoff stars can yield stars this hot (Bailyn 1995). Hotter, more massive merger products could of course be produced by collisional runaway caused by the sinking of massive merged stars to the center. However, the small fraction of light involved in the P2 blue excess suggests that no such runaway has occurred. Moreover, the dynamical relaxation time at 0.1 pc in M31 is yr on account of the high velocity dispersion near the black hole, further evidence against such a runaway. Finally, there is no guarantee that massive blue stragglers would actually form from the energetic stellar collisions in M31, as the star-star impact velocity at 0.1 pc is 1800 km s-1 (assuming a 1-d velocity dispersion of 700 km s-1 and an isotropic velocity ellipsoid). This exceeds the main-sequence stellar escape velocity of km s-1, the point where major mass loss sets in in stellar collision models (Benz & Hills 1988).
Note, however, that all preceding arguments implicitly assume a single hot stellar population with a more-or-less isotropic velocity ellipsoid. In 4 we revisit these estimates under the assumption that a cold disk of stars is present in the nucleus and find that the collision time in such a system could be shorter and more favorable. Such a cold disk is a key assumption in the Tremaine (1995) eccentric-disk model of the nucleus. Evidence in favor of it comes from both the bluer population at the center of P2 and the red color of the inner portions of the nucleus. The former evidence favors young stars and suggests that significant infall of gas to the center of M31 may have occurred well after its initial formation. The latter evidence indicates that the population of the nucleus differs significantly from the bulge, again supporting its formation as a separate event. the color map is much more symmetrical than the intensity distribution. The color uniformity makes it more difficult to accept P1 as a separate stellar system grafted onto the nucleus rather than as a simple rearrangement of the basic nuclear stellar population.
3.2 M32
The previous WFPC-1 observations of M32 admitted a wide variation in possible central structure for (Lauer et al. 1992). The new observations show that the surface brightness of M32 is still rising as a cusp interior to reaching in stars alone. The corresponding lower limit from WFPC-1 was only At the same time, the WFPC-2 images extend to greater sensitivity and smaller radii the conclusion that the inner structure of M32 is featureless aside from the inward continuation of a strong cusp. The center of M32 has no detectable disk, dust, boxy isophotes, or isophote shape changes. The and color gradients are nearly flat, showing no dramatic change in the stellar population as one approaches the postulated central massive black hole.
The recent FOS observations of van der Marel et al. (1997) show that the velocity dispersion continues to rise into the center at HST resolution, thus the rapid relaxation implied by the Lauer et al. (1992) “core model” without a black hole can be ruled out. In general, the relaxation time scale is
| (6) |
where is the stellar mass density and is the number of stars in the system (Binney & Tremaine 1987). The present observations show that the central mass density profile has the form For km s-1 as implied by the black hole mass of van der Marel et al. (1998), yr throughout the center of M32 (assuming ), too long to have a significant structural effect.
Lauer et al. (1992) argued that a black hole of this magnitude would greatly increase the collision time scale over that calculated for M32 without a black hole; however, they also noted that significant collision effects might still be expected at scales poorly probed by the WFPC-1 observations. From equation (5) and the and profiles presented in the previous paragraph, we estimate yr at 0.1pc, increasing outwards roughly linearly with radius (see Table 6).
This new central collision time scale in M32 may be low enough to imply detectable changes in the spectral energy distribution if the stellar population is old. We assume that collisions acting on a base population of turn-off stars of age and mass are creating blue stragglers of lifetime yr and mass . Let the bolometric luminosity of the blue stragglers be and that of the turn-off stars be . If the system is older than the blue-straggler lifetime, then creation of blue-stragglers from collisions, , is in rough equilibrium with their death rate, . Assume further that the bolometric luminosity of a star is simply . Then , and the ratio of bolometric luminosities emitted in steady state would be
| (7) |
If the M32 central stellar population is old, i.e., yr, the flux ratio is of order unity, and the predicted fraction of emitted blue flux would exceed that from P2 in M31 by a 5 (cf. . In fact, the color gradient discussion in 2.4 failed to find any blueing in the central pixels of M32, limiting it to at most 15% of that seen in M31.
Some easing of this dilemma would occur if the stellar population were young. Estimates based on H put the light-weighted central stellar age near yr (Gonzalez 1993, Trager et al. 1998), which would reduce the predicted blueing effect by a 5. However, the predicted blueing would still be comparable to that seen in M31, as its estimated age is also rather young ( yr, Gonzalez (unpublished)) and the ratio is similar in the two galaxies. Furthermore, the bulk of the population could be older than the lightweighted age, and we have also neglected the extra collisions that would occur during the post-main sequence phases. On the other hand, collision speeds may be high enough to prevent efficient formation of blue stragglers (see ). In sum, the stubborn refusal of M32 to reveal any departures from utter normalcy at small radii may be stressing simple theories of its central structure, a problem that deserves closer scrutiny with realistic multi-component evolving dynamical models.
3.3 M33
The key to the M33 nucleus may be that, unlike M32, it lacks a massive central black hole to stabilize its structure. Kormendy & McClure (1993) have emphasized their impressively low upper limit of only for a central black hole in M33; with our smaller limit on the core radius, we can reduce this further to With a central velocity dispersion of only km s-1 but a central density nearly as high as that in M32, the stellar collisions and relaxation, in particular, will be much more important for M33. Stellar collisions indeed may be the explanation for both the relatively blue color of the M33 nucleus and its apparent population of young stars (van den Bergh 1991).
Hernquist, Hut, & Kormendy (1991) emphasized the short central relaxation time in the M33 nucleus and the likelihood that it has undergone core collapse, based on a preliminary analysis of the Kormendy & McClure (1993) observations. The present observations imply an even shorter relaxation time than estimated in either work; from equation (6) and assuming km s-1 for M33,
| (8) |
The implied core-collapse time is only yr, taking (Cohn 1980); it is thus highly likely that the nucleus has already undergone core collapse.
Hernquist et al. (1991) were pessimistic that the blue color of the nucleus could be explained via blue stragglers generated in stellar mergers but did not present a quantitative argument. Kormendy & McClure (1993), in contrast, were intrigued that stellar collisions might indeed be important. Simple calculations of the central stellar collision time scale suggest that collisions are highly likely over the age of the nucleus. For the case with equation (5) reduces to For the M33 nuclear parameters, this gives
| (9) |
In other words, even for an intermediate-aged nucleus, the probability that a solar-type star will have experienced a collision at the center of M33 approaches unity.
If we assume that the present turnoff of the parent old population in M33 is at then the typical blue-straggler collision product will resemble an A5 V star. Explaining the larger versus color gradient requires only that stars added to the center of the nucleus be of spectral type earlier than F5 or so. For an A5 star with and a fractional contribution to the total nuclear light of is sufficient to explain both central color gradients; a contribution of A0 stars or a contribution of F0 stars would also work.
Due to the low mass-to-light ratios of A-type stars, the implied mass contributions are modest and are well within the predicted mass fraction of collision products. For an assumed for the old nucleus population (see below) and an A5 luminosity of at V, the implied mass-fraction of blue stragglers is only Allowing for the finite lifetime of an A5 star, yr, compared to the nominal yr collision time still implies that the blue population required is only of that predicted by the naive application of equation (9). Explaining the blue population with somewhat more massive and hotter collision products, such as A0 stars, would imply a still more modest collision efficiency. Even a population of blue stragglers dominated by F0 stars still fits within the naive predictions of the collision rate by an order of magnitude.
The sharp radial drop in stellar density in the outer nucleus means that collisions will be effective only at the very center. The collision rate calculated above is for at the rate is lower by an order of magnitude. The strong dependence of collision rate with radius might explain both the scale and onset of the central nuclear color gradients. The typical stellar orbit in a potential similar to that of the nucleus is likely to have a factor of three ratio between its pericenter and apocenter distances (assuming an isotropic velocity ellipsoid). Any collision products generated within are likely to have significant diffusion out to but have little presence at still larger radii, in qualitative agreement with the color gradients observed.
A qualitative argument suggests that the above collision rate may indeed be somewhat overestimated. If the M33 nucleus has undergone relaxation and collapse as suggested by Hernquist, Hut, & Kormendy (1991), then significant mass segregation may have taken place at its center, suggesting that the modest velocity dispersion measured by Kormendy & McClure (1993) may be more representative of the star light rather than mass. The massive blue stragglers should be in equi-partition with the older stars, suggesting that the true velocity dispersion, and hence collision time scale, is higher.
A bias of this sort may in fact be suggested by the low calculated by Kormendy & McClure (1993). Models presented by Worthey (1994) show that the old nucleus population will most likely have a conclusion that appears robust over a wide range of metallicities provided that the bulk of the population is at least 5 Gyr old, an assumption supported by the spectral synthesis work of Schmidt, Bica, & Alloin (1990) discussed below. The low blue-straggler population will dilute this of course, but not by the factor of five required; the above model with 30% of the light in A5 stragglers, for example, has To obtain an apparent would require measuring a that is too low, not unreasonable if much of the light comes from A stars with masses that of the typical star. Regardless, such arguments imply that at best is only longer than a naive application of equation (9) might suggest. This does not change the conclusion that collisions are important, as the calculation still has a factor of to spare.
The possibility that collisions are responsible for the young population in M33 contrasts with the traditional conclusion that the M33 nucleus is a site of repeated episodes of star formation since its initial formation (see van den Bergh 1991). Given the inherent freedom in appealing to episodic star formation, we cannot argue that the collision scenario is by any means favored, and indeed it may have difficulty accounting for the UV spectral energy distribution of the nucleus. Schmidt, Bica, & Alloin (1990) use spectral synthesis to conclude that a yr population contributes of the nuclear light, consistent with the collision model, but they also argue that a significant contribution from a very young yr component is also present. Massey et al. (1996) also infer a hot young component in the nucleus from far-UV photometry. Under the pure collision scenario, such hot components would have to be stars produced in second-generation mergers of the initial blue stragglers, or perhaps stars formed from gas left over from mass-loss in the collisions. Such effects can only be evaluated by full models of the nucleus rather than the simple arguments presented here. We only argue here merely point out that, unless the collision time has been severely underestimated, collisions should have readily observable effects on the gross properties of the M33 nucleus.
4 Toward a Unified Picture
We conclude with an attempt to place the Local Group nuclei into a common evolutionary scenario. As the nearest examples of nuclei in giant galaxies, they may provide a view of phenomena in more distant nuclei, including AGNs. For example, the steep density profiles of M31 and M32 place them in the “power-law” category of central density profiles according to Lauer et al. (1995). Understanding the origin of M31 and M32 may thus illuminate the origin of all power-law profiles, which typify small ellipticals and bulges generally; “power-law” galaxies may also serve as the building blocks of the shallower core-type profiles of massive ellipticals (Faber et al. 1997).
The Introduction strongly emphasized the distinct properties of these three nuclei; in actual fact their inner density profiles prove to be broadly similar, with central densities at 0.1 pc and radial slopes . However, central dispersions differ enormously, with M31 and M32 in the range 200-800 km/s while M33 has a much lower km s-1. This difference of course reflects the putative presence of black holes; M31 and M32 have estimated black hole masses in the range , while a black hole is undetectable in M33 at the level
This tentative division into two types according to black hole content is heightened by adding the fourth large galaxy in the Local Group, the Milky Way. The Milky Way nucleus combines the properties of M321 in interesting ways: it has a stellar density profile that is rather similar to the other three, with a peak central density at 0.1 pc , falling off radially beyond 0.3 pc as (Haller et al. 1996). Like M31 and M32, it has high central velocity dispersion km s-1 and an estimated central black hole mass similar to M32 of (Haller et al. 1996). However, it also has a young central cluster of blue stars (see review by Morris & Serabyn 1996), and in this regard it more resembles M33. Significantly — unlike any of the others — the Milky Way is barred, which strongly perturbs the central gas dynamics and appears to create the conditions for a steady inflow of gas into the central pc at a rate of roughly 0.03-0.05 yr-1 (Morris & Serabyn 1996). Bar aside, the Milky Way seems to fit well with M31 and M32. Indeed, from the standpoint of central structure, the Milky Way looks like a barred spiral galaxy with a transplanted M32 spheroid. For purposes of comparison, we therefore lump it with M32 and M31.
As a group, it may be significant that the stellar collision time scales for all four Local Group galaxies hover at or below values that would have barely detectable dynamical effects over a Hubble time. This suggests that the systems have evolved via similar paths to this state, or will do so eventually. One such scenario has been outlined by Murphy, Cohn, & Durisen (1991, MCD), who have modeled the evolution of compact star clusters in the vicinity of seed black holes, including the effects of black hole growth and stellar relaxation, stellar mass loss, and stellar collisions (but not mass ejection by supernovae). The inner density profiles and black hole masses of their Models 3 and 4 at an age of Gyr are qualitatively consistent with M31, M32, and the Milky Way. Interestingly, the initial central density profiles in all MCD models start out much lower and flatter within 1 pc than the evolved profiles — the dense, steep profiles seen at Gyr are due to the combined effects of stellar relaxation, loss-cone depletion, and adiabatic pulling by the growing black hole. Early evolution of the stellar profile is rapid owing to the initially low stellar velocity dispersion, which induces short stellar relaxation and collision times. As the black hole grows, however, the stellar velocity dispersion rises and the stellar population gets “stiffer;” relaxation shuts down and collisions become less frequent. This is the same stabilizing by the black hole that was invoked by Lauer et al. (1992) to postpone rapid dynamical evolution in M32. The black hole continues to grow at late times via stellar mass loss and loss-cone capture, but only slowly, and the systems after 10 Gyr appear to be in near-steady state, like M31, M32, and the Milky Way.
An important question is why the initial conditions of M33’s nucleus set its evolution on a different path from the that of the others. A possibility is that the M33 galaxy lacks a massive spheroidal component while the other three galaxies have one. If initial central density is the key to subsequent evolution, as the MCD models suggest, then the presence of a surrounding spheroid, and consequent increase in stellar mass loss and/or merger-induced gaseous infall, may be needed to boost nuclear density to the required level to grow a black hole quickly. So far, all detected massive central black holes are in galaxies with spheroids (Richstone et al. 1998) save for one Seyfert nucleus in the bulgeless dwarf Sdm galaxy NGC 4395 (Filippenko, Ho & and Sargent 1993). A major task for the Hubble Space Telescope is to search for black holes in bulgeless galaxies.
The lack of a central black hole in the M33 nucleus leads to its profoundly short central relaxation time, yr, several orders of magnitude shorter than that for M32 or M31 (see Table 6). We have advocated the short central collision time in M33 as a possible explanation for its blue center; however, the lack of any apparent collision effects in M32, with a central collision time only longer serves as a strong caveat that this hypothesis as simply stated may be incomplete. The short relaxation time implies a strong likelihood that the M33 nucleus has core-collapsed. The collision probability increases strongly during collapse, suggesting that the blue-straggler population was formed during the collapse, rather than under any sort of quasi-static conditions. Indeed, the short relaxation time of the nucleus already implies that any naive calculations based on the presumption that its structure has not evolved over the age of its stellar population are likely to be in error. In contrast, the long relaxation times in M31 and M32 argue for little recent structural evolution, suggesting that the naive collision calculations may be closer to the truth in these two nuclei.
The longer native collision time in M31 compared to M32 makes the presence of a central blue excess there but not in M32 a compelling problem. Because the blue region is resolved, it must be produced mainly by starlight. This is interesting because all conceivable types of hot stars — blue stragglers, hot horizontal branch stars, young upper main-sequence stars — are short-lived. Hence, understanding the origin of this blue flux sets constraints on current or very recent events in M31. Since the main-sequence stellar collision time is longer in M31 than in M32 (see and ), we must appeal to some other difference between the two nuclei. We consider some possibilities in turn:
-
1.
The velocity dispersion near the black hole is larger at a given radius in M31 than in M32, so stellar collisions are more violent. As noted in 3.1, this works against the blue-straggler hypothesis for the blue excess in M31, as blue stragglers are less likely to coalesce at these high speeds. The higher overall velocity dispersion in M31 thus does not favor the formation of hot stars, at least not by mergers.
-
2.
The estimated black hole mass in M31 is larger than that in M32, and the maximum Eddington radiation limit is larger by the same factor. If both black holes radiated occasionally at their respective limits, the black hole in M31 would evaporate the envelopes of giants to a larger radius, revealing more bare hot cores. According to Tout et al. (1989), a radiation bath of K causes K giants to lose their envelopes. However, at the M31 black hole Eddington limit of , the effective temperature of the radiation field falls to this level at only 1000 AU, smaller than region of the blue excess (0.2 pc). This model would also require an ad hoc recent maximal burst of AGN activity in M31 within the last few yr.
-
3.
As noted in and , the central stellar population may be younger in M32 than in M31, ( yr vs. yr). By Equation (7), this age difference merely nullifies the difference in the collision times, which also differ by a similar factor; it does not explain why the fractional blue excess is so much larger in M31 than in M32.
-
4.
A cold disk of stars in elliptical orbits is required in the Tremaine (1995) model for the M31 double nucleus, while no such disk is seen in M32. Suppose that some fraction of stars within 0.2 pc in M31 are orbiting in a cold disk with , which is typical of young disk stars in the Milky Way. At 0.1 pc, the random velocity dispersion in the disk, , is km s-1, colder than the isotropic velocity dispersion of 700 km s-1. The focusing enhancement of the collision cross section over the geometrical value is the Safronov number (5) given by , where is the escape velocity from the stellar surface (600 km s-1 for the sun), and is the 1-d velocity dispersion of the disk. In addition, the effective density of the disk stars is also increased by the factor as they are compressed into the disk. Under these assumptions, the new collision time is reduced by the factor , which for km s-1, is a factor of 25. The new collision time is yr, and thus essentially all disk stars would suffer a low-speed collision, causing them to merge. Roughly a fraction of the central light would be emitted with the effective temperature of blue stragglers, and thus is needed to match the magnitude of the blue excess. Though promising, this model still does not reach the high color temperature of K that seems to be needed to match the spectral-energy distribution of the blue excess.
-
5.
M31 possesses neutral gas like the Milky Way — unlike M32, which is barren. The region within 1 pc of the Milky Way black hole appears to be a site of episodic star formation, with a mass of stars formed in the last few million years of about (Morris & Serabyn 1996). In M31, the color temperature of the blue excess indicates a main-sequence turnoff mass near A0 and therefore an age of about yr if modeled as a single-burst population. The blue-excess V luminosity of and resultant (Bruzual & Charlot 1993) imply a mass of , similar to the Milky Way central cluster. The radii of the clusters are also similar, a few tenths of a parsec. If allowed to age undisturbed, the young population centered on the Milky Way black hole would evidently look rather like the blue excess population in M31 in about 1 Gyr. This explanation begs the question of forming stars in such a region, where the random velocities exceed several km s-1 and the shear is intense, but the Milky Way appears to have solved that problem somehow, albeit with velocities about a factor of three smaller. It is also true that the center of M31 is relatively empty of neutral gas now, but an intermittent bar instability might bring gas to the center on periods of a few Gyr. It is intriguing that, in this model, the dynamical structure of M31 might have looked quite different in the past.
None of these proposals for explaining the blue excess population in M31 is without drawbacks. However, all illuminate the importance of carrying studies of galactic nuclei to the next stage, where all significant processes are modeled and related nuclei are compared and contrasted. We hope that the emerging body of high-resolution data on Local Group galaxies will stimulate modelers to match in detail the evolutionary history of these nearby Rosetta Stone objects.
| Galaxy | Filter | Date | Exposure (s) | Peak (e-) | Notes |
|---|---|---|---|---|---|
| M31 | F160BW | 06/18/95 | … | No clear signal | |
| F300W | 06/19/95 | ||||
| F555W | 06/19/95 | Dither sequence, gain=15 | |||
| 06/19/95 | … | Saturated in center | |||
| F814W | 06/19/95 | Dither sequence, gain=15 | |||
| 06/19/95 | … | Saturated in center | |||
| M32 | F555W | 12/26/94 | |||
| F814W | 12/26/94 | ||||
| M33 | F555W | 01/19/95 | |||
| 01/19/95 | … | Saturated in center | |||
| F814W | 01/19/95 |
| Color | P1 | P2 | Anti-P1 | |
|---|---|---|---|---|
Note. — The P1 and anti-P1 colors were measured in boxes centered on P1 and displaced from P2 in the anti-P1 direction, respectively. The P2 colors were measured in a smaller box to isolate the UV-bright portion of the nucleus. The last column represents the bulge outside the nucleus; the radial range is distance from P2.
| PA | |||||
|---|---|---|---|---|---|
| 0.0114 | |||||
| 0.0227 | |||||
| 0.0455 | |||||
| 0.0683 | |||||
| 0.0910 | |||||
| 0.1137 | |||||
| 0.1365 | |||||
| 0.1592 | |||||
| 0.1820 | |||||
| 0.2048 | |||||
| 0.2275 | |||||
| 0.2828 | |||||
| 0.3327 | |||||
| 0.3915 | |||||
| 0.4605 | |||||
| 0.5418 | |||||
| 0.6374 | |||||
| 0.7499 | |||||
| 0.8822 | |||||
| 1.0379 | |||||
| 1.2211 | |||||
| 1.4366 | |||||
| 1.6901 | |||||
| 1.9883 | |||||
| 2.0759 | |||||
| 2.4422 | |||||
| 2.8732 | |||||
| 3.3802 | |||||
| 3.9767 | |||||
| 4.6785 | |||||
| 5.5041 | |||||
| 6.4754 | |||||
| 7.6181 | |||||
| 8.9624 | |||||
| 10.5440 |
Note. — V-band deconvolved surface brightness profile is given as a function of isophote semimajor axis length in arcseconds. The area dominated by P1 has been excluded from the fit.
| PA | |||||
|---|---|---|---|---|---|
| 0.0161 | |||||
| 0.0455 | |||||
| 0.0910 | |||||
| 0.1365 | |||||
| 0.1820 | |||||
| 0.2275 | |||||
| 0.2730 | |||||
| 0.3185 | |||||
| 0.3640 | |||||
| 0.4095 | |||||
| 0.4550 | |||||
| 0.5005 | |||||
| 0.5460 | |||||
| 0.5915 | |||||
| 0.6370 | |||||
| 0.6825 | |||||
| 0.7280 | |||||
| 0.7829 | |||||
| 0.9211 | |||||
| 1.0836 | |||||
| 1.2748 | |||||
| 1.4998 | |||||
| 1.7645 | |||||
| 2.0759 | |||||
| 2.4422 | |||||
| 2.8732 | |||||
| 3.3802 | |||||
| 3.9767 | |||||
| 4.6785 | |||||
| 5.5041 | |||||
| 6.4754 | |||||
| 7.6181 | |||||
| 8.9624 | |||||
| 10.5440 |
Note. — V-band deconvolved surface brightness profile is given as a function of isophote semimajor axis length in arcseconds.
| PA | ||||
|---|---|---|---|---|
| 0.0161 | ||||
| 0.0455 | ||||
| 0.0910 | ||||
| 0.1365 | ||||
| 0.1820 | ||||
| 0.2275 | ||||
| 0.2730 | ||||
| 0.3185 | ||||
| 0.3640 | ||||
| 0.4095 | ||||
| 0.4550 | ||||
| 0.5005 | ||||
| 0.5460 | ||||
| 0.5915 | ||||
| 0.6370 | ||||
| 0.6825 | ||||
| 0.7280 | ||||
| 0.7735 | ||||
| 0.8190 | ||||
| 0.8645 | ||||
| 0.9100 | ||||
| 0.9555 | ||||
| 1.0010 | ||||
| 1.0465 | ||||
| 1.0920 | ||||
| 1.1375 |
Note. — V-band deconvolved surface brightness profile is given as a function of isophote semimajor axis length in arcseconds.
| Galaxy | ( | (km s-1) | (yr) | (yr) | |
|---|---|---|---|---|---|
| M31 “Blue P2” | 720 | 0.2 | |||
| M31 “Outer P2” | 720 | 0.2 | |||
| M32 | 240 | 1.6 | |||
| M33 | 21 | 220 |
Note. — Relaxation times and stellar collision times are given for solar-type stars at 0.1 pc from the centers of M these are calculated from the local mass densities, velocity dispersions, and Safronov numbers shown. The two M31 entries are for densities implied by the blue P2 center directly, or extrapolated inwards from the outer P2 cusp (see text).
References
- (1)
- (2) Ajhar, E. A., Lauer, T. R., Tonry, J. L., Blakeslee, J. P., Dressler, A., Holtzman, J. A., & Postman, M. 1997, AJ, 114, 626
- (3) Bacon, R., Emsellem, E., Monnet, G., & Nieto, J. L. 1994, A&A, 281, 691
- (4) Bailyn, C. 1995, ARA&A, 33, 133
- (5) Bender, R., Kormendy, J., & Dehnen, W. 1996, ApJ, 464, 123
- (6) Benz, W. & Hills, J. G. 1988, ApJ, 323, 614
- (7) Binney, J., & Tremaine, S. 1987, Galactic Dynamics (Princeton University Press, Princeton)
- (8) Brown, T. M., Ferguson, H. C., Stanford, S. A., & Deharveng, J. -M. 1998, ApJ, in press; astro-ph/9803327
- (9) Bruzual, G. & Charlot, S. 1993, ApJ, 405, 538
- (10) Burstein, D. & Heiles, C. 1984, ApJS, 54, 33
- (11) Byun, Y., Grillmair, C., Faber, S. M., Ajhar, E. A., Dressler, A., Kormendy, J., Lauer, T. R., Richstone, D., & Tremaine, S. 1996, AJ, 111, 1889
- (12) Cohn, H. 1980, ApJ, 242, 765
- (13) Cole, A. A. et al. (1998), ApJ, in press; astro-ph/9804014
- (14) Crane, P. C., Dickel, J. R., & Cowan J. J. 1992, ApJ, 390, 9
- (15) Dressler, A. & Richstone, D. O. 1988, ApJ, 324, 701
- (16) Faber, S. M., Tremaine, S., Ajhar, E. A., Byun, Y., Dressler, A., Gebhardt, K., Grillmair, C., Kormendy, J., Lauer, T. R., & Richstone, D. 1997, AJ, 114, 1771
- (17) Filippenko, A. V., Ho, L. C., & Sargent, W. L. W. 1993, ApJ, 410, L75
- (18) Gonzalez, J. J. 1993, PhD. thesis, UC Santa Cruz
- (19) Haller, J. W., Rieke, M. J., Rieke, G. H., Tamblyn, P., Close, L., & Melia, F. 1996, ApJ, 456, 194
- (20) Hernquist, L., Hut, P., & Kormendy, J. 1991, Nature, 354, 376
- (21) Holtzman, J. A., Burrows, C. J., Casertano, S., Hester, J. J., Trauger, J. T., Watson, A. M., & Worthey, G. 1995, PASP, 107, 1065
- (22) Huchra, J., Gorenstein, M., Kent, S., Shapiro, I., Smith, G., Horine, E., & Perley, R. 1985, AJ, 90, 691
- (23) Kent, S. M. 1983, ApJ, 266, 562
- (24) King, I. R. et al. 1992, ApJ, 397, 35
- (25) King, I. R., Stanford, S. A., & Crane, P. 1995, AJ, 109, 164
- (26) Kormendy, J. 1988, ApJ, 325, 128
- (27) Kormendy, J. & McClure, R. D. 1993, AJ, 105, 1793
- (28) Kormendy, J. & Richstone, D. 1995, ARA&A, 33, 581
- (29) Lauer, T. R. 1985, ApJS, 57, 473
- (30) Lauer, T. R. et al. 1992, AJ, 104, 552
- (31) Lauer, T. R. et al. 1993, AJ, 106, 1436
- (32) Lauer, T. R., Ajhar, E. A., Byun, Y.-I., Dressler, A., Faber, S. M., Grillmair, C., Kormendy, J., Richstone, D., & Tremaine, S. 1995, AJ, 110, 2622
- (33) Lauer, T. R. et al. 1998, in preparation
- (34) Lucy, L. B. 1974, AJ, 79, 745
- (35) Lugger, P. M., Cohn, H. N., Cederbloom, S. E., Lauer, T. R., & McClure, R. D. 1992, AJ, 104, 83
- (36) Massey, P., Bianchi, L., Hutchings, J. B., & Stecher, T. P. 1996, ApJ, 469, 629
- (37) Michard, R. & Nieto, J. -L. 1991, A&A, 243, L17
- (38) Morris, M., & Serabyn, E. 1996, ARA&A, 34, 645
- (39) Murphy, B. W., Cohn, H. N., & Durisen, R. H. 1991, ApJ, 370, 60
- (40) Richardson, W. H. 1972, J. Opt. Soc. A., 62, 52
- (41) Richstone, D., et al. 1998, Nature, in press
- (42) Schmidt, A. A., Bica, E., Alloin, D. 1990, MNRAS, 243, 620
- (43) Tonry, J. L. 1984, ApJ, 283, L27
- (44) Tonry, J. L. 1987, ApJ, 322, 632
- (45) Tout, C. A., Eggleton, P. P, Fabian, A. C., & Pringle, J. E. 1989, MNRAS, 238, 427
- (46) Trager. S. C. et al. 1998, in preparation
- (47) Tremaine, S. 1995, AJ, 110, 628
- (48) Trinchieri, G. & Fabbiano, G. 1991, ApJ, 382, 82
- (49) van den Bergh, S. 1991, PASP, 103, 609
- (50) van der Marel, R. P., De Zeeuw, P. T., Rix, H. -W., & Quinlan, G. D. 1997, Nature, 385, 610
- (51) van der Marel, R. P., Cretton, N., De Zeeuw, P. T., & Rix, H. -W. 1998, ApJ, 493, 613
- (52) Worthey, G. 1994, ApJS, 95, 107
- (53) Young, P. 1980, ApJ, 242, 1232