H i and dark matter in the windy starburst dwarf galaxy NGC 1705
Abstract
We present 21cm H i line observations of the blue compact dwarf galaxy NGC 1705. Previous optical observations show a strong outflow powered by an ongoing starburst dominating the H ii morphology and kinematics. In contrast, most of the H i lies in a rotating disk. An extraplanar H i spur accounts for % of the total H i mass, and is possibly associated with the H ii outflow. The inferred mass loss rate out of the galaxy’s core is significant , but does not dominate the H i dynamics. Mass model fits to the rotation curve show that the dark matter (DM) halo is dominant at nearly all radii and has a central density : ten times higher than typically found in dwarf irregular galaxies, but similar to the only other mass-modelled blue compact dwarf, NGC 2915. This large difference strongly indicates that there is little evolution between dwarf irregular and blue compact dwarf types. Instead, dominant DM halos may regulate the morphology of dwarf galaxies by setting the critical surface density for disk star formation. Neither our data nor catalogue searches reveal any likely external trigger to the starburst in NGC 1705.
keywords:
galaxies: individual: NGC 1705 – galaxies: kinematics and dynamics – dark matter – galaxies: ISM – galaxies: starburst1 Introduction
NGC 1705, at a distance Mpc (for ; Meurer et al. 1995; hereafter M95), is a relatively nearby blue compact dwarf (BCD) galaxy, which in an earlier paper (Meurer et al. 1992; hereafter Paper I), we showed had several remarkable features. These include: (1) a prominent “super star cluster”, previously noted by Melnick, Moles, Terlevich [1985], which we refer to as NGC1705-1 following M95; (2) less luminous star clusters, H ii regions and a diffuse distribution of massive stars which along with NGC1705-1 comprise an intense ongoing starburst (see also M95); and (3) a spectacular galactic wind (see also Marlowe et al. 1995), which is powered by this starburst. NGC 1705’s explosive H morphology of multiple loops and arcs extends out to the Holmberg radius kpc and is accompanied by split emission lines. The expulsive nature of the flow is confirmed by UV absorption line kinematics (Heckman & Leitherer, 1997; Sahu & Blades, 1997). Table 1 lists some useful properties of NGC 1705 derived from Paper I, M95, or this work.
| Parameter | value | units |
| R.A. | J2000 | |
| Dec. | J2000 | |
| km s-1 | ||
| 6.2 | Mpc | |
| 2.1 | kpc | |
| 0.23 | ||
| km s-1 | ||
| (H i major axis) | 11 | ° |
| (H i) | 78 | ° |
| kpc | ||
| 62.3 | km s-1 |
NGC 1705 and similar nearby BCDs (e.g. NGC 1569, NGC 5253, NGC 2915) are ideal galaxies to study starbursts and their role in dwarf galaxy evolution. Star formation is an act of evolution, and the intense star formation episode of a starburst, with its consequent gas consumption and expulsion, may be the crucial transition event in the evolution of a dwarf galaxy. Starbursts in BCDs are also easier to study than those in more luminous systems because BCDs tend to have low dust content, and are more numerous (hence easier to find locally) than high luminosity starburst hosts. Here we present a detailed H i study of NGC 1705 which addresses four important questions concerning dwarf galaxy evolution and starbursts.
Firstly, what is the strength and fate of the winds often seen in BCDs (Marlowe et al. 1995; 1997; Hunter, Hawley & Gallagher 1993)? It has been proposed that starburst driven winds may play a key role in enriching the inter galactic medium (Heckman, Armus & Miley 1990). While winds should escape more easily from low mass dwarf galaxies (e.g. Dekel & Silk, 1986), the extended dark matter halos typically detected around galaxies increases their binding energies, making it harder for outflows to escape. The problem can be addressed to the extent that the potential well depth can be determined, i.e. from a rotation curve analysis. NGC 1705 is a particularly compelling case for follow-up H i study because its integrated H and H i profiles have similar widths (Paper I). The kinematics of the H are dominated by the outflow, hence this observation suggests that much of the neutral ISM may also be entrained in the outflow.
Secondly, what triggers starbursts? Is it an external perturbation, such as an encounter, or due to some internal (secular) process such as the formation of a bar (which of course can also be excited externally)? While the most luminous starbursts occur almost exclusively in interacting and merging systems [1995], BCDs tend to be fairly isolated with respect to luminous galaxies [1994], and hence an external trigger is not always apparent. Taylor (1997, and references therein) looked for perturbing sources near BCDs and low surface brightness dwarfs using H i images from the VLA. He found that the incidence rate of HI companions near BCDs is 0.57 compared to 0.24 for those near low surface brightness dwarfs, supporting the hypothesis that the starbursts in BCDs are triggered by external interactions. Nevertheless, their remains a high fraction (%) of BCDs that show little or no signs of external triggers.
Thirdly, what are the evolutionary connections between different dwarf galaxy morphologies? There are two types of moderate to low surface brightness dwarf galaxies. Dwarf ellipticals (dEs) have very little or no detectable ISM, smooth round isophotes, red colours, and often a central nucleus. Dwarf irregulars (dIs) have a high gas content, irregular isophote shape, and blue colours. A starburst may provide the missing link between the two configurations. That is, if a dI undergoes a strong starburst, becoming a BCD, it can blow away its ISM in a galactic wind and then fade to become a dE (e.g. Davies & Phillips, 1988).
Finally, what is the relationship (if any) between dark matter (DM) and starbursts? The size and location of starbursts in infrared luminous galaxies seems to be well governed by the global dynamics of the host; starbursts tend to neatly fill the area covered by the rising portion of the rotation curve, where rotational shear is low [1995]. In dI galaxies DM dominates often even interior to the rotation curve knee (e.g. Carignan & Beaulieu, 1989; Lake, Schommer & van Gorkom 1990). Could there be a difference in the (dark) mass distribution of bursting and quiescent dwarfs? Unfortunately, while a great body of literature exists on the H i and mass distributions of dI galaxies (e.g. Begeman, Broeils, & Sanders 1991), fewer BCDs have been imaged in H i (e.g. Taylor et al. 1995), and only one has had its mass distribution modelled. That galaxy, NGC 2915, has a DM core density about 10 times more dense than typically found in dIs (Meurer et al. 1996; hereafter, M96). Is this a common property of BCDs? If so what are the implications?
Here we report on Australia Telescope Compact Array (ATCA) H i synthesis observations of NGC 1705. Preliminary results from this study were presented by Meurer [1994]. In Section 2 we discuss the new 21cm data, and its reduction. An overview of the radio properties of NGC 1705 are presented in Section 3. The rotation curve of the galaxy is derived, and the mass distribution of NGC 1705 is modelled in Section 4. We discuss the implications of our results in Section 5. Finally our conclusion are presented in Section 6.
2 Data and reduction
NGC 1705 was observed with the ATCA over six runs, here labelled A – F, using different antenna configurations. Five antennas were used in each configuration. The dual linear polarization AT receivers were employed with the correlator set to 512 channels per polarization in each baseline, and with each channel separated by 15.6 kHz. The log of the observations is given in Table 2. The observations were comprised of sets were NGC 1705 was observed for about 40 minutes with the phase centre set to 3′ north of the position of NGC1705-1 given in Table 1 followed by a 4 minute observation of the secondary calibrator B0438-436 (, (J2000), with VLBI positional accuracy better than ; Johnston et al. 1995). The calibration assumes that the secondary calibrator is a point source with constant flux density over the period of each observing run. The absolute flux calibration was set by observations of the primary calibrator 1934-638111We adopt Jy at 20cm for 1934-638 [1990]. Reynolds [1994] gives Jy at 20cm for this source. which was observed at the beginning or end of each observing run. The one exception is run B, for which the primary calibrator data was lost. The flux density of B0438-436 is reported in column 4 of Table 2 for the remaining five runs. The mean 20 cm flux density of B0438-436 for configurations A,C,E,F is Jy which we adopt as the flux density of B0438-436 during run B. The flux density of B0438-436 during run D was mildly discrepant from this mean.
| Run | UT start | Time on source | Baseline range | |
|---|---|---|---|---|
| (dd/mm/yyyy) | (hours) | (Jy) | (m) | |
| A | 17/11/1990 | 3.5 | 61 – 2112 | |
| B | 25/02/1991 | 9.4 | … | 77 – 1362 |
| C | 29/04/1991 | 9.5 | 337 – 2924 | |
| D | 25/05/1991 | 13.1 | 31 – 1286 | |
| E | 17/07/1991 | 10.5 | 31 – 459 | |
| F | 01/12/1991 | 8.9 | 77 – 1486 |
| H i Line images | continuum image | ||||
| Quantity | NA value | UN value | units | RUN value | units |
| image size | pixels | pixels | |||
| pixel size | |||||
| beam | |||||
| noise/pixel | 1.3 | 1.9 | mJy beam-1 | 0.25 | mJy beam-1 |
| (max) | 19 | 25 | K | 80 | K |
The data processing was very similar to that used by M96, to which the reader is referred for details. The steps included data editing, calibration, combining the data from the two polarizations, continuum subtraction (using 300 channels free of line emission), shifting of the data to a common heliocentric rest frame, time averaging to one minute per visibility, combining the individual data sets, and then imaging and “CLEAN-ing” the data (Schwab, 1984; see also Clark, 1980; Högbom, 1974). The resulting uniformly (UN) weighted and naturally (NA) weighted data cubes were made by averaging two spectral channels at a time during the imaging stage resulting in a channel separation of 6.6 km s-1.
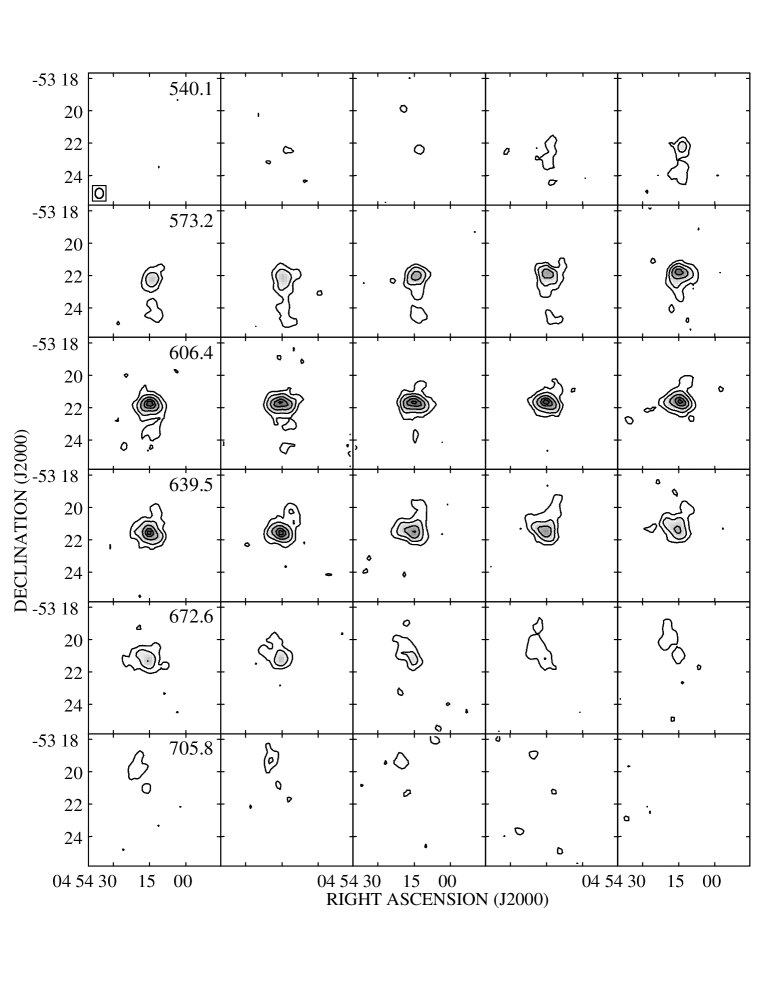
A preliminary examination of the the cleaned NA continuum image showed significant calibration errors. Therefore we improved the calibration by self-calibrating [1984] with this continuum image. This resulted in a 24% improvement in the noise level of the natural (NA) weighted continuum image to 0.31 mJy beam-1, and a 7% improvement in the NA weighted H i data cube to 1.25 mJy beam-1. Planes of the NA data cube containing H i signal are shown in Fig. 1. The final continuum image was made using “robust” uniform (RUN) weighting [1995]. A summary of the properties of the data sets analysed in this paper are presented in Table 3.
3 21cm properties
3.1 HI properties
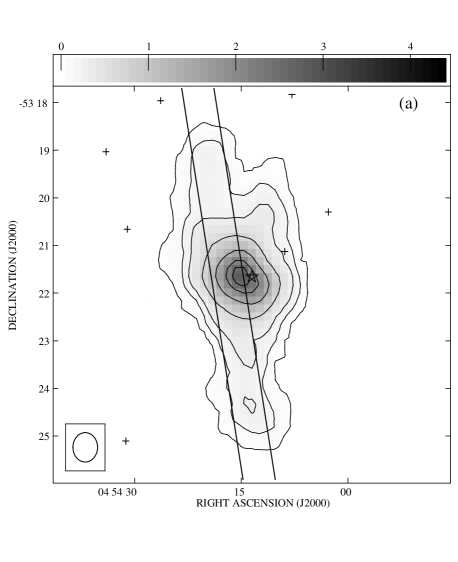
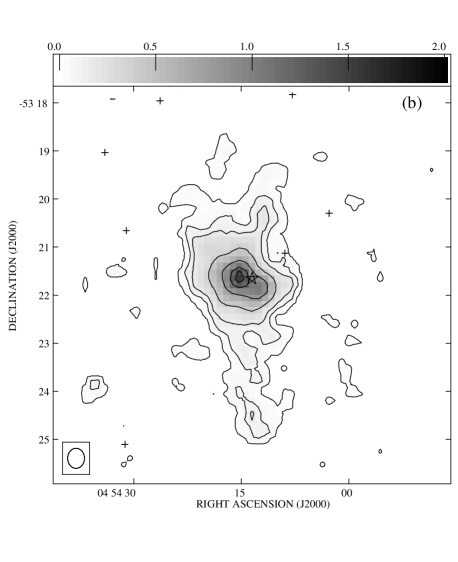
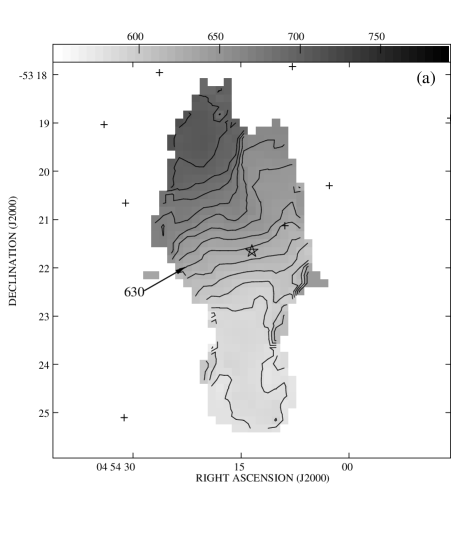
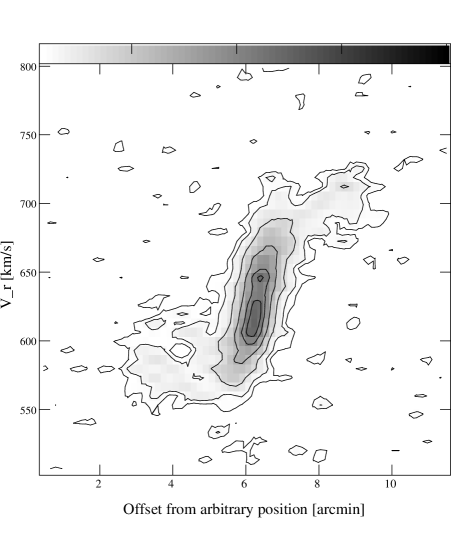
The distribution and dynamics of the H i can largely be surmised from Figs. 2 - 4. Figure 2 shows the total H i distribution of NGC 1705 in the NA and UN zeroth moment maps. The H i is strongly peaked near the position of NGC1705-1. At UN resolution the central H i concentration starts to resolve into two peaks separated by (0.9 kpc) which straddle NGC1705-1. The valley between the peaks is reminescent of the hole in the H i distribution around the brightest cluster in the similar galaxy NGC 1569 [1990]. This was attributed by Israel and van Driel to supernovae evacuating a cavity in the ISM. At lower surface brightnesses the H i distribution is elongated along a position angle (measured relative from north towards the east), and there is a strong velocity gradient along this axis, as shown in Figure 3 which plots the NA and UN velocity fields obtained from the first moment of the data cubes. The overall impression is that we are viewing a highly inclined disk. This impression is supported by Fig. 4 which shows a position-velocity (PV) cut (40 arcsec wide) along the H i major axis, here rotation is clearly evident.
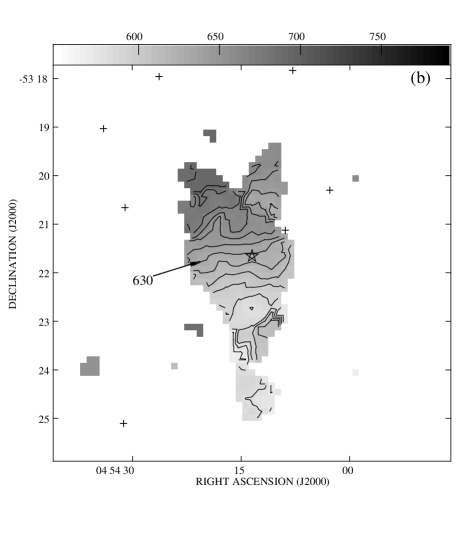
The H i peak(s), and NGC1705-1 are clearly displaced away from the symmetry point of the PV cut (Fig. 4), and these centres are displaced above the mid-line of the H i plane (Fig. 2). The offsets amount to 25 arcsec radially and 27 arcsec out of the H i plane. The orientation of the optical isophotes suggests that NGC 1705 is a warped system with the centre being more face-on than the extremities. Section 4 discusses the dynamics of the disk in more detail.
Also apparent in Fig. 2 is a spur of H i at relative to the optical centre extending to a projected kpc. The velocity contours in Fig. 3 show that it is a kinematically distinct structure. We discuss possible origins of the spur in Section 5. In addition, the H i line profiles are split arcsec S of the optical centre, as can be seen in Fig. 4 (see also Fig. 7 below), kinematically suggesting the presence of an expanding bubble or a high velocity cloud.
The NA and UN integrated velocity profiles are shown in Fig. 5 which shows that the UN data is missing flux relative to the NA data (by %). Properties of the data measured from the global profiles are presented in Table 4. The NA integrated flux agrees well with that measured from Parkes single dish spectra (Paper I).

| Quantity | NA value | UN value | units |
| 16.9 | 13.2 | Jy km s-1 | |
| 1.53 | 1.19 | ||
| 630.2 | 630.2 | km s-1 | |
| 119 | 112 | km s-1 | |
| 163 | 163 | km s-1 |
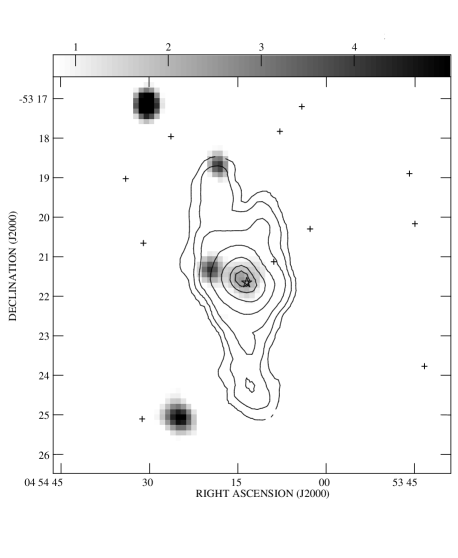
3.2 Continuum properties
Figure 6 shows the continuum image with the NA zeroth moment H i isophotes overlayed. Two sources are seen near the optical position of NGC 1705. Their flux densities and positions were measured with a two component Gaussian fit. The source located at , with respect to NGC1705-1 is unresolved and has a flux density mJy. While no optical sources are coincident within the errors of this position, there is a faint point like source about 13 arcsec away from this position, i.e. within the radius of the RUN beam. The other source coincides well with the the position and size of the galaxy in the optical. It has mJy, but appears relatively faint in Fig. 6 because it is resolved, having half power dimensions , very similar to the dimensions in H and optical continuum. Note that the major axis position angle , is orthogonal to the optical continuum , and similar to the H outflow axis .
The 1.4GHz continuum flux density is somewhat higher than expected by the radio-far infrared (FIR) correlation. Using the IRAS fluxes listed in Paper I and following Devereaux & Eales [1989], we find while the continuum power is . For the observed , the regression line of Devereaux & Eales predicts a factor of five lower than observed (the scatter in the correlation is 0.34 dex, a factor of 2.2).
This result may be due to the low dust content of NGC 1705. M95 find NGC 1705 to have the bluest ultraviolet (UV) colours and lowest FIR/UV flux ratio of any of the galaxies in their sample except for IZw18, indicating that NGC 1705 has a very low dust content (see their Tables 4, 8, and Fig. 6). Since it is radiatively heated dust which provides the FIR flux, the low results from the low dust content, rather than being abnormally high.
4 Dynamics
4.1 Extraction of the rotation curve
The rotation curve was determined from 40 arcsec wide slices of the UN and NA data cubes along the H i plane (e.g. Fig. 4). This width was selected to match the disk size, and yet avoid the spur region. The line profiles in these images were fitted with Gaussians to find . Example profiles and their fits are shown in Fig. 7. In cases where the line profiles were multiple or asymmetric (as expected for the inner regions of a highly inclined disk) the component with farthest from was used to estimate the rotational amplitude.

First the dynamical centre and its corresponding systemic velocity were determined by finding the symmetry point of the NA measurements. This yields km s-1 and the rotation axis displaced ( pc) NNE (along the principal H i axis) from the projected position of the NGC1705-1 on the H i disk. Note that the lower values of determined optically (Paper I) and from the integrated H i profile, 628, 620 km s-1 respectively, are consistent with this displacement between the optical and dynamical centres.
The rotation curve was then extracted by taking to be the radial offset from the dynamical centre, and taking . The column by column measurements from the 2D slices are averaged within bins equal to the (approximate) relevant beam size yielding the adopted . Our adopted rotation curve uses the UN measurements for and the NA measurements for .
A dynamical inclination can not be determined directly from the velocity field since the velocity contours do not splay out along the minor axis into the typical spider pattern of a moderately inclined disk. This in part is due to the contamination of the spur, but is also indicative of a highly inclined disk. Instead was estimated from the shape of the outer H i isophotes (excluding the “spur” region), assuming an intrinsic minor to major axis ratio [1983]. If the true inclination is lower in the centre as implied by the optical isophotes, then the central two values may be higher by a factor . The adopted rotation curve is given in Table 5, and plotted in the upper panel of Fig. 8. The average errors were estimated separately for the UN and NA data as half the difference from opposite sides of the galaxy, and are listed in Table 5.
| R | |
|---|---|
| (arcsec) | km s-1 |
| 12.5 | |
| 37.5 | |
| 62.5 | |
| 92.5 | |
| 127.5 | |
| 162.5 | |
| 197.5 | |
| 232.5 |

4.2 Surface density profiles
The radial surface density profiles we use in Section 4.4 to model the rotation curve have been derived relative to the dynamical centre222The density distribution of the dark matter halo, is not greatly affected if the optical or H i centres are used to extract the profiles. As illustrated in Fig. 9 The face-on H i profile was modelled from the run of integrated H i flux with position in the PV cuts used to extract the rotation curve. For the model we assumed that the PV cuts represent the integrated flux of an edge-on disk. For the intrinsic profile we adopt a linear decline with a Gaussian core (i.e. similar to the model used by M96). This functional form is adopted merely because it fits the data fairly well, it is not meant to provide insight to the physics of the mass distribution. An arbitrary truncation radius of is adopted in order to insure a finite disk mass, and a constant of 0.08 dex is added to the fitted profiles in order to recover the H i flux outside of the extraction strip. The fitted H i profile is given by:
| (1) |
where is in arcsec, and is the face-on H i column density in atoms cm-2.

The displacement of the optical centre from the dynamical centre is 36 arcsec; a distance more than two optical scale lengths as measured in Paper I. Averaged over their orbits about this centre, the stars have a significantly more diffuse distribution than given in Paper I. Therefore, for the mass modelling we adopt an optical light profile that is exponential with an effective radius equal to the projected offset between the dynamical and optical centres. The total brightness is taken to be (Paper I). This does not include the light of NGC1705-1 because while it supplies significant luminosity it has a relatively negligible mass (Paper I; Ho & Filipenko, 1996). This yields a profile with central surface brightness and scale length kpc.
4.3 Pressure support and beam smearing
Figure 8 shows the radial profile of the H i velocity dispersion in its bottom panel; km s-1 at all radii, with a central value of about 28 km s-1. This is significantly broader than is observed in quiescent spiral galaxies. These typically have km s-1 with mildly increasing values towards the centre (e.g. Shostak & van der Kruit 1984; Dickey, Hanson & Helou 1990). If these are true measures of the turbulence in the ISM, then pressure support may be significant since . However, may also be an artifact of differing bulk motions along the long sight line through the disk, or beam smearing of an unresolved and steep velocity gradient. The latter is particularly a concern in the centre of the galaxy, since the flat part of the rotation curve is reached in only beam diameters.
Since beam smearing and centralized pressure support have a similar effect - to decrease the central velocity gradient - correcting for one will have a similar effect as correcting for the other. In Fig. 8 we show the effect of correcting the rotation curve for “minimum” and “maximum” levels of pressure support, following the method outlined by M96. The assumed curves for the two cases are shown as dotted and long-dashed lines respectively. The minimum case, a flat km s-1 at all radii, assumes that the observed profile is dominated by projection effects, and that the face-on is like that seen in quiescent disk galaxies. The maximum case, shown with the long dashed line, assumes that the observed profile reflects the real turbulent motions. The top panel shows that the minimum pressure support correction is negligible. The maximum case, however, makes a significant difference to the rotation curve; the turnover radius moves inwards and the curve is significantly steeper in the centre than . However there is little change of at large .
4.4 Mass models
Mass model fits to the rotation curve are shown in Fig. 10. The corresponding parameters of the models are listed in Table 6. The models shown consist of three components to the mass distribution: (1) the stellar distribution which is given by the projected luminosity profile (Section 4.2) scaled by – the mass to light ratio of the stars; (2) the neutral ISM distribution which is set by the H i profile scaled by a constant 1.33 to account for the Helium contribution; and (3) a dark matter (DM) halo. The DM halo is taken to have a density distribution given by
| (2) |
where the free parameters are the central density and the core radius . For this density distribution the rotational velocity at large , , and halo velocity dispersion are given by [1990]:
| (3) |

| Model: | AA | BB | CC | DD |
|---|---|---|---|---|
| Fit parameters : | ||||
| (solar units) | 0.5 | 0.0 | 1.0 | 1.9 |
| (kpc) | 1.12 | 0.84 | 0.74 | 0.80 |
| 0.076 | 0.130 | 0.163 | 0.111 | |
| (km s-1) | 23.9 | 23.6 | 23.2 | 20.7 |
| (km s-1) | 52.9 | 52.2 | 51.4 | 45.8 |
| rms (km s-1) | 5.2 | 4.9 | 5.0 | 1.8 |
| At kpc : | ||||
| (km s-1) | 53.7 | 53.4 | 62.6 | 64.0 |
| 1.30 | 1.34 | 1.74 | 1.72 | |
| (solar units) | 3.2 | 3.3 | 4.3 | 4.2 |
| 6.4 | 12.8 | 3.1 | 1.4 | |
| At last point, kpc : | ||||
| (km s-1) | 64.9 | 65.1 | 67.0 | 61.9 |
| 6.81 | 6.86 | 7.23 | 6.14 | |
| (solar units) | 16.8 | 16.9 | 17.9 | 15.1 |
| 18.2 | 42.4 | 12.0 | 5.7 |
The mass model fits employed the minimization code employed by M96. All models shown have fixed . In most cases they are maximum disk solutions where the maximum value is determined that will allow the innermost measurement to be be modelled entirely by the stellar and ISM contributions. The adopted is then set at 90% of this value, reduced so that the DM core is not hollow (cf. van Albada et al. 1985). We prefer maximum disk models because there are not enough data to meaningfully fit (see below); the photometric profile only covers the innermost two points of the rotation curve. Furthermore, these models minimize the contribution of the halo. The fact that the halo dominates in all fits shows that it is a necessary component of the mass distribution.
In all models shown, the geometries of the stellar and neutral gas distributions are assumed to be circularly symmetric razor thin disks, while the DM halo is assumed to be spherically symmetric. These standard assumptions for modelling rotation curves, are of course highly idealised. Considering that the disks in NGC 1705 may be rather thick, and/or warped, we also constructed models with spherically symmetric distributions (having the same enclosed relationship) for the gas and stars. This decreases both the maximum amplitude of the rotation curve of the two disk components, and the radius at this maximum. For maximum stellar disk models, this results in a somewhat lower , since the peak then occurs somewhat closer to the innermost measurement, and consequently a lower is required to reach the same amplitude. However the assumptions about the geometry of the luminous components has only a minor affect on the DM halo properties (% for and ; km s-1 for ), since the halo is so dominant in all cases.
Model AA shows the maximum disk model for the observed rotation curve. The derived is close to the level estimated in Paper I from the HSB and LSB stellar populations’ colours. Model BB is a fit to the same data assuming a minimum stellar disk, i.e. , resulting in DM halo with a core % smaller and denser by %. When is a free parameter our minimization code also yields , that is, no stellar component is required to fit these data. This is a common result when mass modelling rotation curves [1997], and indicates that the rotation curves do not often well constrain the relative contribution of the stellar component even in the core of galaxies - there is a degeneracy between and . The minimum disk model yields the maximum DM allowed by these data, or equivalently the total spherically averaged DM plus stellar density within the constant density core of the galaxy. A comparison of in models AA and BB indicate that DM dominates even in the core of NGC 1705.
Models AA and BB were fitted to the raw rotation curve derived in Section 4.1. However, as noted in Section 4.3, in the inner most portion of the rotation curve may be underestimated due to beam smearing and or pressure support. Model CC is a maximum disk fit to the rotation curve corrected for maximum pressure support shown in Fig. 8. A significantly higher than in model AA is needed to meet the maximum disk constraint. Even so, is almost twice that in model AA, and is smaller by 35%. Note that there is little effect on (it actually goes down slightly). This is because it is essentially set by the flat part of the rotation curve.
The maximum pressure support corrections may be insufficient to recover the true profile. Beam smearing and warping of the H i disk may further lower over its initial rise. It is impossible to sort out all these effects with the data in hand. Instead, we construct an idealized rotation curve based on the shape of normal galaxy rotation curves, and scaled to the properties of NGC 1705. It features a linearly rising inner portion and a flat rotation curve thereafter. The turnover is set to occur where the stellar disk rotation curve should peak, while the flat part at km s-1 is set as the mean of the last five points in Table 5. Model DD is the maximum disk fit to this hypothetical rotation curve. This results in the highest of our models. Compared to model AA, is smaller by 30% and is larger by over 40%, while is lower by 14%.
The main conclusion from our mass models is that in all cases a dominant DM halo is required. Moreover, the central density is rather large compared to other disk galaxies. This result is discussed in detail in Section 5.4.
5 Discussion
5.1 Is NGC 1705 an interacting merging system?
Our study shows that NGC 1705 has a lopsided and disturbed H i appearance suggesting that an interaction or merger has triggered the starburst in this system. Although this is a very appealing scenario, it is not clear what it is interacting with. NGC 1705 inhabits a low density environment. There are no galaxies of comparable brightness or size in the 15′ (27 kpc) field centred on NGC 1705 visible on the UK Schmidt Telescope Survey. We used NED333The NASA/IPAC Extragalactic Database (NED) is operated by the Jet Propulsion Laboratory, California Institute of Technology, under contract with the National Aeronautics and Space Administration. to search for possible companions within 5∘ (0.54 Mpc in projection) and found no likely companions. Over this area there are only two galaxies as bright or brighter than NGC 1705: NGC 1596 and NGC 1617. These have significantly higher (1510 and 1063 km s-1 respectively) indicating that they are background galaxies. The nearest catalogued group of galaxies is the NGC 1672 group, with eight known member [1993], at km s-1 and a projected separation of Mpc.
We searched our data for possible companions. To do this we made a special purpose NA data cube with a pixel size in the spatial direction (yielding a synthesized beam width of 44′) and 13.2 km s-1 in velocity, and large enough to easily encompass the ATCA primary beam FWHM ( kpc). The useful velocity range of this cube is km s-1(i.e. km s-1). We examined the data cube in a variety of ways, but found no obvious companions. The estimated detection limit corresponds to for a point source of narrow velocity width ( km s-1) located at the field centre. However, the area we surveyed is small compared to that used by Taylor et al. [1995] study. Of the H ii galaxy companions, % have projected separations kpc. Hence there may be a companion beyond the area we surveyed.
Perhaps the H i spur is actually a companion galaxy. If so it must have a low stellar content since the image of NGC 1705 in the ESO-LV catalogue [1989] shows no optical counterpart to the spur, down to its detection limit of . An examination of the NA data cube reveals that the spur is attached to the main body of the system both spatially, and in , suggesting that if it is a companion, it is strongly interacting or merging with NGC 1705. However, NGC 1705’s outer optical isophotes are round and regular, suggesting a relatively peaceful environment. This is in contrast to the best studied merger-BCD: IIZw40 (Brinks & Klein, 1988; van Zee, Skillman, & Salzer 1998) which has a highly disturbed “” structure even at low surface brightness levels (Marlowe et al. 1997; Telles, Melnick, & Terlevich 1997). We conclude that there is no evidence that the spur is a companion galaxy and hence we have not found any convincing external trigger to NGC 1705’s starburst.
5.2 Evidence for a galactic wind blow out
In the standard theory of galactic winds [1990] the wind expansion is powered by a very hot, K, over-pressurized bubble of thermalized supernovae remnants and stellar winds, which are abundantly produced in a starburst. As it expands the bubble sweeps up the ambient ISM into a shell like structure. Once it expands to one or two disk scale heights it will accelerate out along the minor axis, resulting in shell fragmentation. The enclosed hot gas will then “blow out”, escaping into the halo. We propose that the H i spur results from such a galactic wind blow out. The evidence is as follows.
Firstly, the orientation of the spur is consistent with the optical outflow. The position angle of the spur relative to the optical centre, while the H outflow axis (Paper I). Furthermore, increases gradually with distance from the optical centre, the same sense as the optical velocity gradient on the NNW side of the outflow.
Secondly, the one-sided nature of the spur is predicted by models of galactic winds. If the energy source is displaced off of the disk plane, the blow out will occur only on the side to which the source is displaced (Mac Low, McCray, Norman 1989). Indeed, the spur is displaced on the same side of the H i disk plane as the optical centroid.
Thirdly, the ISM is very porous towards the optical centre of NGC 1705. Heckman & Leitherer [1997] estimate towards NGC1705-1 from the Ly absorption profile obtained with the Hubble Space Telescope, over ten times lower than what we find averaged over the UN beam. The observed weakness, and porosity in the ISM suggests that the hot bubble has already punched through the ambient ISM.
Finally, the scale size of the spur, 4.5 kpc, agrees with expectations. Once the blow out occurs, the hot gas will expand at thermal velocities and adiabatically cool. The thermal velocity for K is 280 km s-1 for an H atom. Thus over a 10 Myr time-scale (the optical expansion time-scale), gas from the blow-out can travel nearly 3 kpc, 3/4 the length of the spur.
One problem with this scenario is that it implies that the outflow vector must be inclined within only a few degrees of the plane of the sky, otherwise the spur would have a much larger difference with respect to , (i.e. even larger than derived in Paper I for the H outflow). However, NGC1705-1 is but the brightest cluster formed within the young central stellar population population. So perhaps earlier star formation events expelled the spur at lower velocities. At a minimum, the velocity of the spur is km s-1, the difference with respect to , yielding a maximum expansion time-scale of about 100 Myr.
What will become of the galactic wind? Already some of it has travelled kpc - well into the halo. The escape speed at radius within an isothermal sphere truncated at is given by
| (4) |
where is the circular velocity. Thus if the spur is travelling at 280 km s-1 at kpc, the DM halo would have to extend out to Mpc to contain the outflow. This is implausibly large, hence the spur will escape. If is as low as 7 kpc (the limits of the H i data) the spur need only be travelling at 120 km s-1 for it to escape. The neutral gas (H + He) mass of the spur is , about 8% of the total gas mass. If it results from an outflow, then the range of plausible time scales ( Myr) imply mass loss rates of , into the DM dominated halo if not out of the system entirely. This is roughly equal to or up to an order of magnitude larger than the current total star formation rate of as derived from the H flux (Paper I) and the conversion factor of Kennicutt [1983].
5.3 Disk stability and star formation
The link between star formation and the gravitational stability of the ISM in a disk has been noted by several authors over the past few decades. (e.g. Quirk, 1972; Kennicutt 1989). If the disk is sufficiently cool and dense its thermal pressure and centripetal acceleration can not support itself against self gravity and the disk will fragment, presumably leading to efficient star formation. The gravitational stability of a gaseous disk is given by the Toomre [1964] parameter:
| (5) |
where is the gas velocity dispersion, is the gas disk surface density and
| (6) |
is the epicyclic frequency for angular frequency . High values of mean the disk is more stable while if then the disk should fragment. Kennicutt [1989] empirically found that in normal disk galaxies, high mass star formation occurs in regions having . The same threshold also is able to predict the location of star formation in low surface brightness galaxies [1993] and BCD/H ii galaxies [1994].
Figure 11 shows NGC 1705’s azimuthally averaged profile for the minimum and maximum curves of Fig. 8. Here is interpolated smoothly (spline fit) through the points given in Table 5. The profile is taken as the neutral gas surface density profile fits given in eq. 1. Two fiducial radii are indicated in this plot: which encompasses most of the stellar light, and the H effective radius [1997] which encompasses most or all of the high mass star formation. We see that the profiles has a sharp down-turn corresponding to the optical extent of the galaxy and that high mass star formation is limited to the region where the profile bottoms out. Conversely, the outer H i disk (beyond ) is relatively stable with a factor of 5-10 higher than in the centre of the galaxy.

When the minimum profile is adopted the central values of in NGC 1705 are close to Kennicutt’s threshold value. Considering the limited resolution of the data and the neglect of molecular gas and elements heavier than helium, we may expect that the disk is even less stable in the centre. The maximum version of the profile is significantly above Kennicutt’s threshold at all radii. However, it should be pointed out that Kennicutt [1989] as well as van der Hulst et al. [1993] and Taylor et al. [1994] assumed km s-1 at all radii. Thus the threshold has yet to be calibrated with true measured profiles. We conclude that NGC 1705 is like most other galaxies in that star formation occurs where the disk is least stable.
5.4 Dark matter halos and dwarf galaxy morphology
One important difference between BCDs and dI galaxies is in the central densities of their DM halos, as shown in Fig. 12. The majority of the data comes from the uniform mass model fitting of de Blok & McGaugh [1997]. Since we are concerned with dwarf galaxy properties we limit their sample to systems with . These galaxies mostly have Sm or later morphological types (i.e. dI galaxies), although there are a few Sd galaxies particularly at . The two BCDs are NGC 1705, from this study, and NGC 2915 from M96. Both panels plot of the DM halo against the optical band central surface brightness . For NGC 1705 we adopt from model AA, since this gives the most conservative results.

The top panel shows the results of maximum disk models. Since maximum disk models correspond to minimum halo models, the plotted in Fig. 12a should be considered lower limits. In order to break the degeneracy between and de Blok & McGaugh employ “Bottema disk” model fits; their results are plotted in the bottom panel of Fig. 12. For these is set by the colour of the galaxy, rather than the rotation curve. Following their prescription and the photometry in Paper I we obtain for NGC 1705. This value is higher than the maximum disk , and following de Blok & McGaugh we adopt the maximum disk results (model AA) for the Bottema disk solution. Since NGC 2915 was not modelled with a Bottema disk by M96, we estimate the Bottema disk results here. From the prescription of de Blok & McGaugh and the the photometry of Longo & de Vaucouleurs [1983] we obtain a Bottema disk for NGC 2915. This is slightly less than the maximum disk in M96’s model D. By interpolation between their models A and D and correcting to we estimate for the Bottema disk solution.
Figure 12 shows that the two BCDs have some of the highest of any of the dwarf galaxies in the sample. Furthermore there is a weak but noticeable correlation between and , with higher surface brightness disks corresponding to higher halos. These results hold for both maximum disk and Bottema disk solutions. This result (for Bottema disks) was noted first by de Blok & McGaugh [1997], and extends to high luminosity disks. Here we show that the correlation also includes blue compact dwarf galaxies. The rms scatter in about simple linear fits to the data is dex (see Fig 12 caption). A large part of this may be due to measurement uncertainties; as noted the pressure support or beam smearing corrections can change by 0.3 dex, while distance errors can easily translate into a 0.2 dex uncertainty in for galaxies with Mpc.
The fact that the two BCDs are on the right side of the diagram while most of the dIs are on the left side is not a coincidence. It has been noted by several authors (Papaderos et al. 1996; Telles & Terlevich, 1997; Marlowe, Meurer, & Heckman 1998) that the enveloping exponential profile of BCDs have brighter than dIs by typically 2.5 mag arcsec-2 [1998]. Note that the plotted here excludes any central excess of light above the usual exponential profile seen at large radii. Such an excess of light is commonly found in BCD galaxies and usually is identified as the starburst [1998]. They are also common in dI galaxies, but at a lower intensity [1996], and hence are not classified as starbursts.
What is the explanation of the differences between BCDs and dIs apparent in Fig. 12? We suggest that DM halos regulate the morphology of dwarf galaxies via the stability of their inner disks. Both types of dwarfs are usually DM dominated at nearly all radii, and typically have solid body rotation curves over their optical extents. Let us assume that star formation occurs at the same value in all types of dwarf galaxies, and moreover that is regulated to maintain this level, at least over the optical extent of the galaxy (cf. Ferguson, 1997; Kennicutt, 1989). For a given , in the solid body portion of the rotation curve (from eq. 5 and 6). Kennicutt [1998] finds that the the global star formation rate per unit area in disk galaxies where is the dynamical time scale. Combining this with our constant assumption leads to
| (7) |
The optical luminosity of both dIs and BCDs are usually dominated by young blue stars, so the star formation rate per area is proportional to surface brightness. Hence the dex difference in between dIs and BCDs should correspond to a factor of ten difference in linear surface brightness, or 2.5 mag arcsec-2. The best fit line with this slope is shown in Fig. 12. We see that this scenario can explain the basic trend seen in the data. We emphasize that this model explains the differences in the exponential envelopes of gas rich dwarfs and does not address the starburst nature of BCDs. As shown by Marlowe et al. [1998] the starburst typically is at best a modest enhancement to the luminosity of a BCD and contributes only a few percent to the stellar mass of the host.
While the scatter in Fig. 12 allows for some evolution in surface brightness, our scenario implies that an extreme dI galaxy can not evolve into an extreme BCD, or visa-versa. This would involve a factor of 10 change in , or expansion/contraction of the halo by a factor of . This is very difficult to do if DM is non-dissipitive, and since even the cores are DM dominated, a baryonic (luminous matter) collapse or blowout would be insufficient to drag the DM with it.
6 Conclusions
We have examined the H i distribution and dynamics of the windy blue compact dwarf (BCD) galaxy NGC 1705. While a rotating disk dominates the H i distribution, the H i distribution appears somewhat disturbed. The optical centre and H i peak are both offset from the H i dynamical centre radially and off of the H i plane. The total projected offset amounts to about 1.1 kpc. In addition there is an extraplanar H i spur extending at least 4.5 kpc into the halo which accounts for % of the total H i mass. We argue that it is likely to have a galactic wind origin, perhaps being the adiabatically cooled hot bubble that formerly powered NGC 1705’s spectacular H outflow. Higher resolution observations could shed more light on this issue.
NGC 1705’s rotation curve is similar in form to those of other gas rich dwarf galaxies, having a linearly rising (solid body) inner portion and then turning over to become approximately flat ( km s-1). Mass model fitting shows that the dark matter (DM) halo is dominant at nearly all radii - even into the solid body core of the galaxy. The models yield a DM halo central density , which is about a factor of ten times higher than typically found in dwarf irregular (dI) galaxies, but similar to that found in NGC 2915 the only other mass-modelled BCD.
This study has provided useful insights into the dynamical evolution of dwarf galaxies. We can now address the four questions presented in the introduction.
Firstly, if NGC 1705’s H i spur is wind ejecta, then of neutral ISM is being expelled at least into the halo if not out of the system entirely. This is occurring over a time-scale between roughly 10 Myr and 100 Myr; yielding mass loss rates between 0.2 and 2 . This is a significant mass loss event, up to an order of magnitude larger than the current star formation rate. However, we emphasize that the vast majority of the neutral ISM remains in a disk structure.
Secondly, it is not clear from this study what triggered the starburst in NGC 1705. No clear external trigger was identified in our data, nor in catalogue searches. A secular origin for the starburst may also be tenable: star formation in this galaxy occurs where the disk is least stable to self gravitation - just as is seen in normal disk galaxies.
Thirdly, the large difference in DM halo central densities between BCDs and dIs strongly indicates that there is little evolution between the two types. This is consistent with the differences found between the optical structure of dIs and the host galaxies of BCDs (i.e. excluding the starburst; Marlowe et al. 1998).
Finally, we argue that dominant DM halos can regulate star formation in dwarf galaxies. This is done by setting the critical surface density for self gravitation (and hence star formation) of the embedded baryonic disk. In this scenario surface brightness is correlated with so that BCDs should have stellar disk surface brightnesses 2.5 mag arcsec-2 brighter than dIs, as is typically observed.
This paper benefited from discussions with Claude Carignan, Ken Freeman, John Reynolds, Stacy McGaugh, and Chris Mihos. We thank the staff at Paul Wild Observatory, Narrabri, in particular Robin Wark and Mike Kesteven, for their support of our observing runs. Claude Carignan kindly provided some of the software used in this project. GRM thanks the director of ATNF, Ron Ekers, for the hospitality shown during three visits to the Marsfield site. GRM gratefully acknowledges receipt of travel funds provided by the American Astronomical Soceity and the Center for Astrophysical Sciences of The Johns Hopkins University, which made this collaboration tenable from. Examination of our data cubes benefitted from the KARMA packaged developed at the ATNF by R. Gooch. Literature searches were performed using NED, the NASA/IPAC Extragalactic Database, a facility operated by the Jet Propulsion Laboratory, Caltech, under contract with the National Aeronautics and Space Administration.
References
- [1991] Begeman, K.G., Broeils, A.H., & Sanders, R.H. 1991, MNRAS, 249, 523
- [1983] Bottinelli, L., Gougenheim, L., Paturel, G., & de Vaucouleurs, G. 1983, A&A, 118, 4
- [1995] Briggs, D.S. 1995, Ph.D. Thesis, The New Mexico Institute of Mining and Technology
- [1988] Brinks, E., & Klein, U. 1988, MNRAS, 231, 63P
- [1989] Carignan, C., & Beaulieu, S. 1989, ApJ, 347, 760
- [1980] Clark, B.G., 1980, A&A, 89, 377
- [1988] Davies, J.I., & Phillips, S. 1988, MNRAS, 233, 553
- [1997] de Blok, W.J.G., & McGaugh, S.S. 1997, MNRAS, 290, 533
- [1986] Dekel, A., & Silk, J. 1986, ApJ, 303, 39
- [1989] Devereaux, N.A., & Eales, S.A. 1989, ApJ, 340, 708
- [1990] Dickey, J.M., Hanson, M.M., & Helou, G. 1990, ApJ, 352, 522
- [1997] Ferguson, A.M.N. 1997, Ph.D. Thesis, The Johns Hopkins University
- [1993] Garcia, A.M. 1993, A&AS, 100, 47
- [1997] Heckman, T.M., & Leitherer, C. 1997, AJ, 114, 69
- [1990] Heckman, T.M., Armus, L., & Miley, G.K. 1990, ApJS, 74, 833
- [1996] Ho, L.C., & Filipenko, A.V. 1996, ApJ, 472, 600
- [1974] Högbom, J. 1974, ApJS, 15, 417
- [1993] Hunter, D.A., Hawley, W.N., & Gallagher, III, J.S. 1993, AJ, 106, 1797
- [1990] Israel, F.P. & van Driel, W. 1990, A&A, 230, 323
- [1995] Johnston, K.J., et al. 1995, AJ, 110, 880
- [1990] Lake, G., Schommer, R.A., & van Gorkom, J.H. 1990, ApJ, 320, 493
- [1989] Lauberts, A. & Valentijn, E.A. 1989, The Surface Photometry Catalogue of the ESO-Uppsala Galaxies, (ESO, Garching)
- [1995] Lehnert, M., & Heckman, T.M. 1995, ApJS, 97, 89
- [1983] Longo, G., & de Vaucouleurs, A. 1983, A General Catalogue of Photo-electric Magnitudes & Colors in the UBV system of 3578 Galaxies Brighter than the 16-th V-Magnitude (1936-1983) (University of Texas Monographs in Astronomy, N0. 3, Austin)
- [1983] Kennicutt, R.C. 1983, ApJ, 272, 54
- [1989] Kennicutt, R.C. 1989, ApJ, 344, 685
- [1998] Kennicutt, R.C. 1998, ApJ, in press (astro-ph/9712213)
- [1989] Mac Low, M.-M., McCray, R., & Norman, M.L. 1989, ApJ 337, 141
- [1995] Marlowe, A.T., Heckman, T.M., Wyse, R.F.G., & Schommer, R. 1995, ApJ, 438, 563
- [1997] Marlowe, A.T., Meurer, G.R., Heckman, T.M., & Schommer, R. 1997, ApJS, 112, 285
- [1998] Marlowe, A.T., Meurer, G.R., & Heckman, T.M. 1998, ApJ, submitted
- [1985] Melnick, J., Moles, M., & Terlevich, R. 1985, A&A, 149, L24
- [1994] Meurer, G.R. 1994, in Meylan, G., & Prugniel, P. ed., ESO/OHP Workshop on Dwarf Galaxies (ESO Conference & Workshop Proceedings no. 49), p. 351
- [1992] Meurer, G.R., Freeman, K.C., Dopita, M.A., & Cacciari, C. 1992, AJ, 103, 60 (Paper I)
- [1995] Meurer, G.R., Heckman, T.M., Leitherer, C., Kinney, A., Robert, C., & Garnett D.R. 1995, AJ, 110, 2665 (M95)
- [1996] Meurer, G.R., Carignan, C., Beaulieu, S., & Freeman, K.C. 1996, AJ, 111, 1551 (M96)
- [1996] Papaderos, P., Loose, H.-H., Fricke, K.J. & Thuan, T.X. 1996, A&A, 314,59
- [1996] Patterson, R., & Thuan, T. 1996 ApJS, 107, 103
- [1984] Pearson, T.J., & Readhead, A.C.S. 1984, ARA&A, 22, 97
- [1972] Quirk, W.J. 1972, ApJ, 176, L9
- [1994] Reynolds, J.E. 1994, ATNF internal report AT/39.3/040
- [1997] Sahu, M.S., & Blades, J.C. 1997, ApJ, 484, L125
- [1994] Salzer, J.J. & Rosenberg, J.L. 1994, in Meylan, G., & Prugniel, P. ed., ESO/OHP Workshop on Dwarf Galaxies (ESO Conference & Workshop Proceedings no. 49), p. 129
- [1984] Schwab, F.R., 1984, AJ, 89, 1076
- [1984] Shostak, G.S. & van der Kruit, P.C. 1984, A&A, 132, 20
- [1997] Taylor, C.L. 1997, ApJ, 480, 524
- [1994] Taylor, C.L., Brinks, E., Pogge, R.W., & Skillman, E.D. 1994, AJ, 107, 971
- [1995] Taylor, C.L., Brinks, E., Grashuis, E., & Skillman, E.D. 1995, ApJS, 99, 427; erratum: 1996, ApJS, 102, 189
- [1997] Telles, E., & Terlevich, R. 1997, MNRAS, 286, 183
- [1997] Telles, E., Melnick, J., & Terlevich, R. 1997, MNRAS, 288, 78
- [1964] Toomre, A. 1964, ApJ, 139, 1217
- [1985] van Albada, T.S., Bahcall, J.N., Begeman, K., & Sanscisi, R. 1985, ApJ, 295, 305
- [1993] van der Hulst, J.M., Skillman, E.D., Bothun, G.D., McGaugh, S.S., & de Blok, W.J.G. 1993, AJ, 106, 548
- [1998] van Zee, L., Skillman, E.D., & Salzer, J.J. 1998, in prep.
- [1995] Veilleux, S., Kim, D.-C., Sanders, D.B., Mazzarella, J.M., & Soifer, B.T. 1995, ApJS, 98, 171
- [1990] Wright, A., & Otrupcek, R. 1990, Parkes Catalogue, (ATNF: Sydney)