INFRARED OBSERVATIONS OF NEBULAR EMISSION LINES FROM GALAXIES at
Abstract
We present the first results from a program of near-infrared spectroscopy aimed at studying the familiar rest-frame optical emission lines from the H II regions of Lyman break galaxies at . By targeting redshifts which bring the lines of interest into gaps between the strong OH- sky emission, we have been successful in detecting Balmer and [O III] emission lines in all five galaxies observed so far with CGS4 on UKIRT. The typical line fluxes are a few times erg s-1 cm-2, approximately one order of magnitude lower than the limits reached with wide-field narrow-band imaging surveys.
For a Salpeter IMF and a km s-1 Mpc-1, cosmology, the H luminosities uncorrected for dust extinction imply star formation rates of yr-1; these values are greater than those which may have been deduced from the ultraviolet continuum luminosities at 1500 Å by factors of between and . Uncertainties in the shape of the reddening curve and in the intrinsic UV continuum slope do not allow us yet to assess accurately the level of dust extinction; however, on the basis of the present limited sample it appears that an extinction of magnitudes at 1500 Å may be typical of Lyman break galaxies. This value is consistent with recent estimates of dust obscuration in star forming galaxies at and does not require a substantial revision of the broad picture of star formation over the Hubble time proposed by Madau et al. (1996).
In four out of five cases the velocity dispersion of the emission line gas is km s-1, while in the fifth the line widths are nearly three times larger. Virial masses are suggested, but both velocities and masses could be higher because our observations are only sensitive to the brightest cores of these systems where the line widths may not sample the full gravitational potential. The relative redshifts of interstellar absorption, nebular emission, and Lyman emission lines differ by several hundred km s-1 and suggest that large-scale outflows may be a common characteristic of Lyman break galaxies. The forthcoming availability of high resolution infrared spectrographs on large telescopes will soon allow all of these questions to be addressed in much greater detail.
1 INTRODUCTION
Star forming galaxies at redshift are now being discovered in large numbers from deep imaging surveys designed to reveal the break in their spectral energy distribution caused by the limit of the Lyman series of neutral hydrogen at 912 Å (Steidel, Pettini, & Hamilton 1995, Steidel et al. 1996; Lowenthal et al. 1997). At optical wavelengths sample the rest frame ultraviolet continuum which, being produced primarily by O and early B type stars, is a measure of the instantaneous star formation rate. Thus, by constructing the ultraviolet luminosity function of galaxies in different redshift intervals, it has become possible to sketch the global history of star formation (and associated metal production) in the universe over % of the Hubble time (Madau, Pozzetti, & Dickinson 1998).
In principle, the ultraviolet continuum is a more direct avenue to the SFR than other commonly used indicators, such as the Balmer lines—which measure the reprocessed ionizing flux from the most massive stars—and the far-infrared luminosity due to grain emission. Concerns remain, however, regarding the extent to which the observed ultraviolet luminosities are attenuated by the dust which is likely to be associated with the star-forming regions, given that even relatively small column densities of dust can modify substantially the emergent spectral energy distribution in the far-UV.
The magnitude of the dust correction appropriate to Lyman break galaxies is currently the subject of considerable debate. On the one hand, there are claims that the ultraviolet continuum slope and UV-optical spectral energy distribution (SED) imply that the typical galaxy suffers a factor of extinction at Å (Meurer et al. 1997; Sawicki & Yee 1998), although other analyses (e.g. Trager et al. 1997) arrive at more modest estimates (factors of ) from similar data. The first results from searches at sub-mm wavelengths have been interpreted as evidence for a significant population of dust-obscured star forming galaxies at (Blain et al. 1998), but the present uncertainties in the surface density of sub-mm sources and in their redshifts make such conclusions still tentative. Higher metal production rates than those implied by the (uncorrected) ultraviolet luminosity density at high redshift have also been advocated to explain the lack of evolution in the Fe abundance of rich galaxy clusters up to (Mushotzky & Loewenstein 1997; Renzini 1997).
On the other hand, dust obscuration does not appear to be a major problem for galaxies at . Observations of the infrared continuum with the Infrared Space Observatory (Flores et al. 1998) and of the H emission line (Tresse & Maddox 1998; Glazebrook et al. 1998) indicate that the typical correction to the near-ultraviolet continuum luminosity at 2800 Å is at most a factor of two (see also Treyer et al. 1998). Similarly, the initial results from a survey of H emission associated with damped Lyman galaxies at by Bechtold et al. (1998) do not point to a significantly higher star formation rate density than that predicted by Madau et al. (1998).
This confusing situation is unlikely to be settled simply by improved measurements of the ultraviolet spectra of high redshift galaxies. As discussed below, uncertainties in the shapes of both the unattenuated spectral energy distribution and the reddening curve limit the accuracy of even the most careful estimates of ultraviolet extinction. A more profitable approach may be to search for Balmer emission lines, particularly H and H, associated with known galaxies at . Since the effects of dust are less severe at rest-frame optical wavelengths, a comparison between the star formation rates implied by the Balmer lines and by the UV continuum should lead to estimates of dust obscuration which are less model dependent. An added incentive is the possibility of obtaining from the widths of the nebular lines direct estimates of the masses of the galaxies which, as argued by Steidel et al. (1996), cannot be reliably deduced from consideration of the ultraviolet interstellar absorption lines alone. Knowledge of the masses associated with Lyman break galaxies would make it possible to use their clustering properties to discriminate between different cosmologies (Adelberger et al. 1998; Steidel et al. 1998b).
With these goals in mind we have begun a pilot program aimed at detecting
nebular emission lines from galaxies at
; in this paper we
report on the initial results of this work.
The brighter objects in our
spectroscopically confirmed sample
of Lyman break galaxies are within reach of high
resolution near-infrared spectrographs on 4-m telescopes
and indeed we have detected Balmer and/or [O III] emission lines in every
one of the five galaxies observed so far.
With the forthcoming availability of similar spectrographs on 8-10 m
telescopes such detections will become routine and may eventually resolve
the vexed question of dust obscuration at high redshift.
2 OBSERVATIONS AND DATA REDUCTION
The near-IR sky is dominated by strong and highly variable airglow emission from the hydroxyl radical (e.g. Ramsay, Mountain & Geballe 1992) which normally precludes spectroscopic observations of faint sources. At a resolving power , however, the OH- lines are resolved and a significant portion of the spectrum, particularly in the -band, becomes accessible for work. With the large samples of Lyman break galaxies now available it is possible to choose objects at favourable redshifts such that the nebular lines of interest fall in gaps between the sky lines. The CGS4 spectrograph on the UK Infrared Telescope on Mauna Kea, Hawaii with a InSb array provides both the spectral resolution and the wavelength coverage necessary for a search for H and [O III] at .
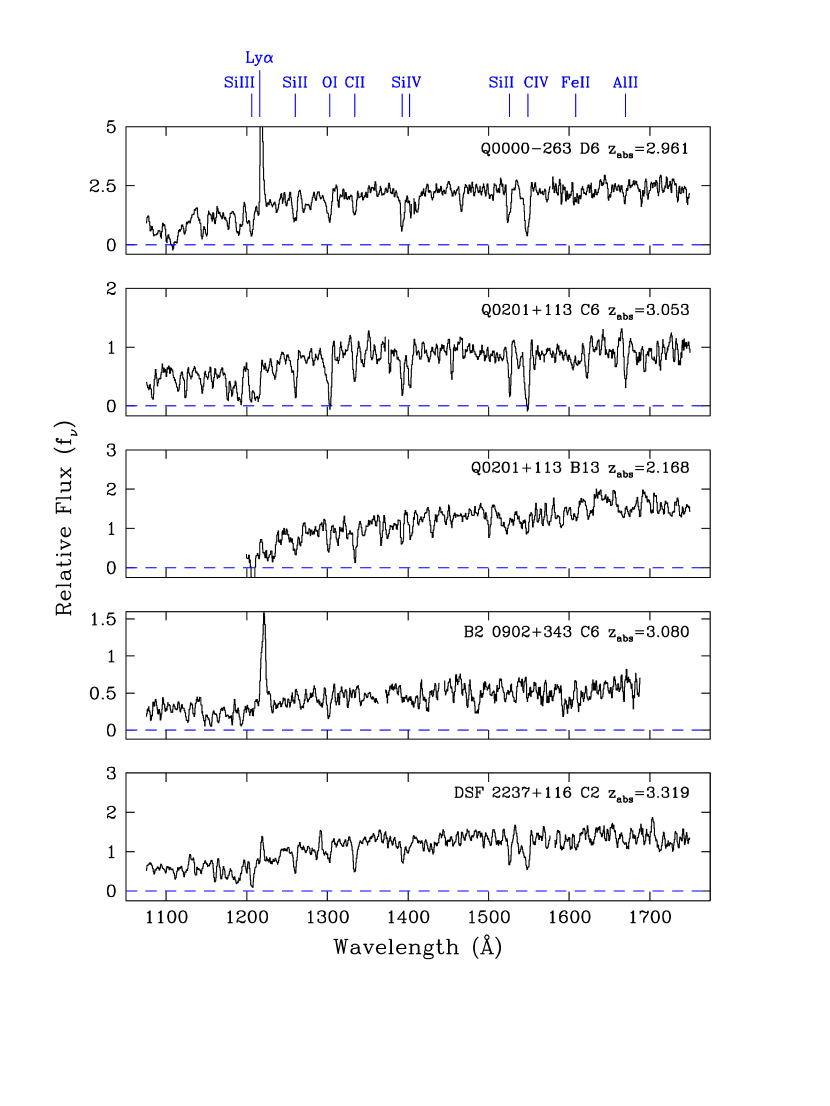
Table 1 gives details of the galaxies observed. From our Keck LRIS spectra, which are reproduced in Figure 1, we measure two values of redshift for each galaxy, from Lyman emission (when present) and from the interstellar absorption lines; they are listed in columns 4 and 5 respectively (all redshifts are vacuum heliocentric). As discussed below (§5), Lyman emission is generally redshifted relative to the absorption lines by up to several hundred km s-1, presumably reflecting large-scale outflows in the interstellar media of these galaxies (Kunth et al. 1998). Details of the Keck observations and of the optical and infrared imaging from which the magnitudes and colors in Table 1 were derived will be presented elsewhere. Here we concentrate on UKIRT observations in the -band aimed at detecting H and [O III] emission lines at and in one case, Q0201113 B13, H at .111Q0201113 B13 does not qualify as a Lyman break galaxy according to our usual photometric selection criteria. It is one of several galaxies in the tail of the redshift distribution of our sample, discovered in the process of exploring the boundaries for Lyman break galaxies in the () vs. () color plane (Steidel et al. 1995).
The data were obtained over three observing runs in September 1996, and October and November 1997. In 1996 we used the 150 mm focal length camera and 150 grooves mm-1 grating (in second order) to give a dispersion of 200 Å mm-1 (6 Å pixel-1); with a 1.2 arcsec wide entrance slit and half-pixel stepping of the spectrum on the detector to improve the sampling, we achieved a resolving power corresponding to Å in the -band. In the 1997 observing runs, the improved image quality delivered by the new UKIRT tip-tilt system allowed us to use the longer focal length (300 mm) camera; the corresponding resolution—with the same grating and slit width as in 1996—was Å.
At the telescope we followed standard observing techniques; a good description of the finer points to be taken into account when observing faint objects with UKIRT and CGS4 is given by Eales & Rawlings (1993). The galaxies were acquired by blind offsets from nearby stars whose relative positions we had previously measured from our own CCD images with a typical accuracy of arcsec. We only used offsets stars within arcmin of the galaxies to make sure that both galaxy and star would fall on the dichroic filter used to direct the optical light to the guiding system. The spectra were recorded on two sets of rows on the detector separated by arcsec; the object was beam-switched between these two positions on the slit in a ABBA sequence with 600 s integration at each position.
The choice of 600 s as the length of an individual exposure (significantly longer than is normally the case when working in the infrared) was driven by the need to minimize the read-out noise of the detector relative to the sky noise in the dark regions of sky between the OH- lines where the Balmer and [O III] emission lines are expected to fall. The penalty which one pays for such long exposures is that some of the OH- lines saturate, or in any case vary sufficiently between successive exposures, to make it impossible to subtract them out properly. In the circumstances, we preferred this course of action (relative to shorter exposures), because our observing strategy was specifically aimed at avoiding the sky emission lines.
After two sequences of four 600 s exposures (i.e. approximately every 4800 s) we returned to the offset star and realigned the optical and infrared beams (to take into account the effects of differential atmospheric refraction) before repeating the blind offset procedure. With total exposure times of between 18 000 and 40 000 s (see Table 1), the final spectra are the sum of many such groups of four exposures. Between successive nights we stepped the grating so as to shift the spectra by a few pixels along the rows of the detector; this reduces the residual fixed pattern noise after flat-fielding. In general we summed only data obtained on photometric nights with arcsec seeing. One exception are the October 1997 observations of Q0201113 B13 which were obtained in patchy cloud and 1–1.5 arcsec seeing but which were nevertheless found to improve the final signal-to-noise ratio of the spectrum.
Wavelength calibration was by reference to the
emission line spectra of Ar and Kr hollow-cathode lamps internal to the
spectrograph; we further used the sky OH- emission lines to monitor any
wavelength shifts during the long series of exposures.
Observations of standard stars, normally of spectral type A0, provided an
absolute flux scale for the galaxy spectra.
The major steps of the data reduction procedure are also well described by
Eales & Rawlings (1993).
Briefly, the UKIRT CGS4 data reduction system provides flat-fielded
two-dimensional images of each group of four exposures
where the sky background has been subtracted by subtracting the
sum of the two frames with the object at position B from the sum of the
two frames with the object at A.
We used IRAF to wavelength calibrate and rebin these 2-D images to a
linear scale; we then removed the sky residuals (due mainly to
temporal variations in the OH- lines) in each wavelength bin
by fitting the background along
the slit with a first order cubic spline.
The last steps involved extracting the galaxy spectra
at positions A and B, multiplying B by (since the initial UKIRT
processing described above produces a negative signal at position B),
and adding the resultant two spectra.
We then co-added the extractions from each group of four exposures to
produce the final spectra.
In general we found that using weighted extraction and co-adding algorithms
made little difference to the final signal-to-noise ratio.
2.1 Results
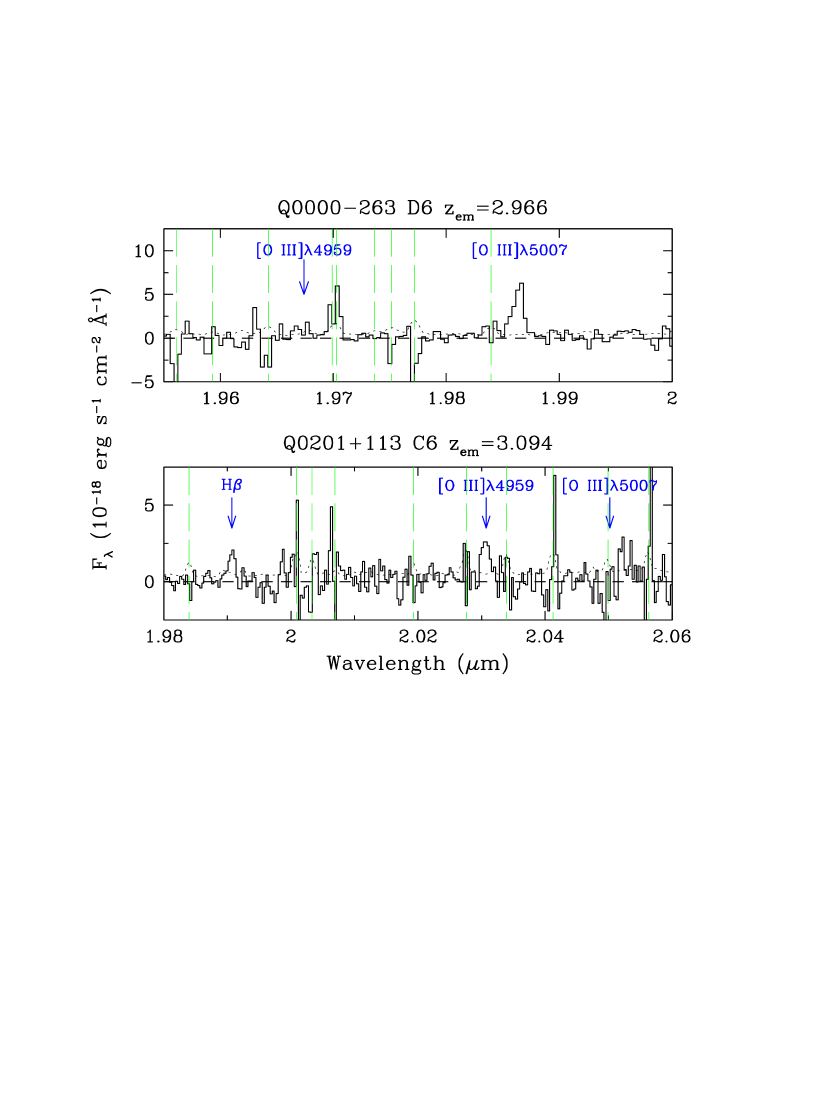
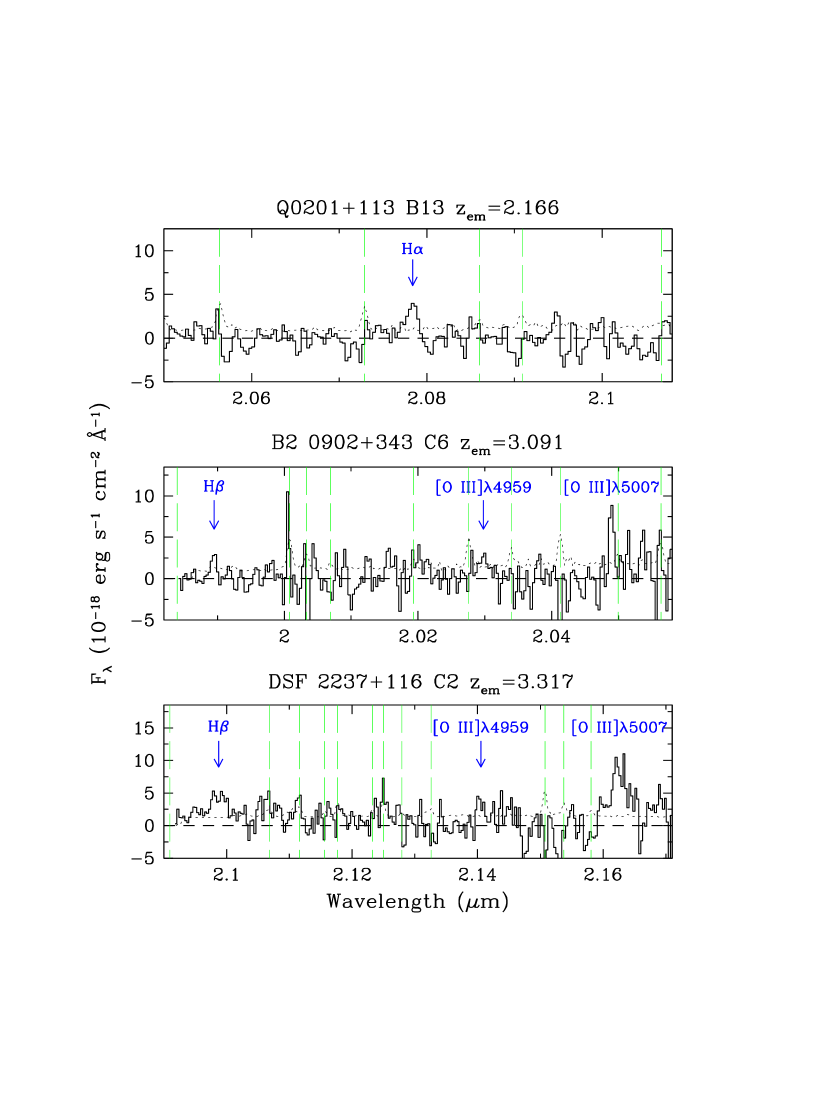
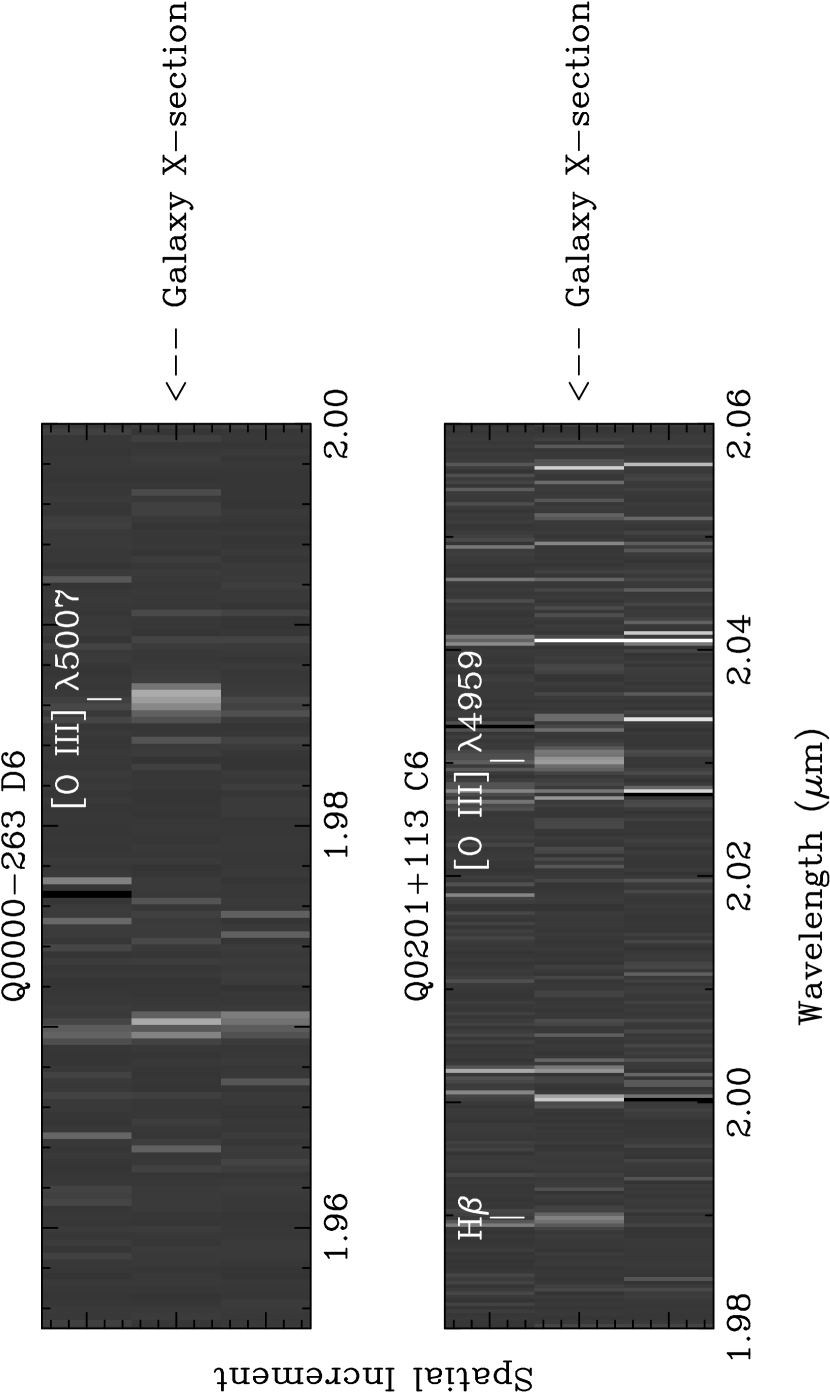
Figures 2 and 3 show portions of the UKIRT spectra obtained in 1996 and 1997 respectively; in Figure 4 we have reproduced the inner three cross sections of the reduced two dimensional images from the 1996 observations. In Table 2 we list the measured redshifts and fluxes of the nebular emission lines covered, together with the line luminosities deduced for km s-1 Mpc-1 and (we adopt these values throughout the paper). From the continuum fluxes implied by the magnitudes (see Table 1) we calculate the values of rest frame equivalent width listed in Table 2. It can be seen from the figures that, by targeting redshifts such that the nebular lines are well removed from the strongest night sky features, we have generally succeeded in detecting [O III] and Balmer emission lines from the H II regions of Lyman break galaxies at . Even so, it is clear that the observations are at the limit of what can be achieved with 4-m class telescopes, resulting in detections at levels of only a few (see Table 2) despite the very long exposure times. In general [O III] is in the noise, but in each case the upper limit on its flux is consistent with the measured flux of which is three times stronger. In one case, Q0201113 C6, we do detect [O III] but not because at the latter coincides with a strong OH- line at m which is saturated in our spectra. In Q0000263 D6, H falls outside the -band window.
Typical line fluxes are a few times
erg s-1 cm-2, approximately one order of
magnitude lower than the limits achieved so far in wide field
surveys in the near infrared using narrow band imaging (e.g.
Thompson, Mannucci, & Beckwith 1996). This is likely to be the
reason why such surveys have not yet found a widespread
population of star-forming galaxies at high redshift.
Targeted searches for H emission at
in QSO fields, using narrow band filters tuned to
the redshifts of known absorbers,
have been more successful (Teplitz, Malkan,
& McLean 1998; Mannucci et al. 1998; Bechtold et al. 1998).
3 STAR FORMATION RATES AND DUST EXTINCTION
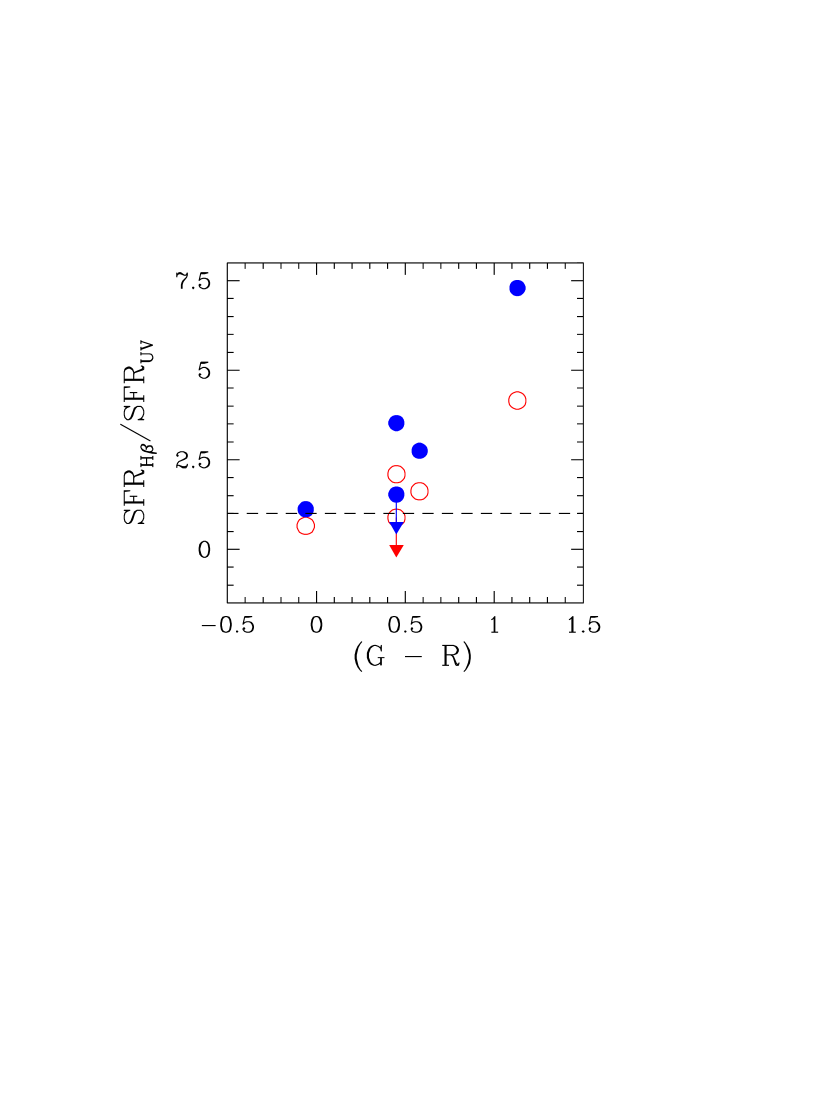
In Table 3 and Figure 5 we compare the values of the star formation rate (SFR) deduced in the five galaxies from the measured luminosities in the H line and in the far-UV continuum ( Å) respectively. At this stage we do not correct the observed fluxes for dust obscuration. In calculating SFRHβ we have assumed a ratio H/H= 2.75 (Osterbrock 1989) and Kennicutt’s (1983) calibration SFR = yr-1 (where is in erg s-1) which is appropriate for a Salpeter IMF from to .222Madau et al. 1998 deduced a slightly different conversion factor, SFR = yr-1, using more recent population synthesis models. Adopting this calibration would decrease the values of SFRHβ in column 3 of Table 3 by 29% . For Q0000263 D6, where only [O III] is observed, we derive an upper limit to SFRHβ assuming that /H. This is a conservative limit based on data from local star-forming regions (Terlevich et al. 1991; Stasinska & Leitherer 1996), as well as the three Lyman break galaxies in the present sample where both [O III] and H are detected (see Table 2).
Turning to the UV luminosity, it is important to realize that, although the continuum at 1500 Å is dominated by short-lived O and B stars, it does nevertheless show a modest increase with time in continuous star formation models. (In the case of an instantaneous burst of star formation the UV luminosity obviously fades with time after the starburst).333Throughout this paper we only consider ‘continuous’ star formation models—in which gas is converted into stars at a constant rate, as opposed to ‘instantaneous burst’ models—in which all stars are assumed to be formed at time with negligible star formation thereafter. Clearly these are two limiting cases to the real star formation history of Lyman break galaxies. However, in our view single burst models are less likely to apply to the galaxies observed here because the Balmer and [O III] emission lines would fade rapidly after such a burst and would be undetectable at the sensitivity of the present observations after less than years (Stasinska & Leitherer 1996). The Bruzual & Charlot (1996) models predict that, for a Salpeter IMF within the above limits and solar metallicity, the UV luminosity at 1500 Å from a region undergoing continuous star formation tends to an asymptote at years, at which point a yr-1 produces erg s-1 Hz-1. For comparison, years after the onset of star formation the UV luminosity corresponding to yr-1 is only % of the above value (see also Leitherer, Robert, & Heckman 1995). In the Bruzual & Charlot models these conversion factors do not depend sensitively on metallicity.444An empirical determination of the metallicity dependence of the integrated UV continuum of stellar populations awaits the availability of the appropriate stellar libraries.
At our filter (with effective wavelength Å) samples the rest-frame continuum near Å. Since our magnitudes are on the AB scale (), the median of the Lyman break galaxies considered here corresponds to erg s-1 cm-2 Hz-1; at this in turn translates to a continuum luminosity erg s-1 Hz-1 . In arriving at the star formation rates listed in columns (4) and (5) of Table 3, we have applied small -corrections (generally less than 10%), based on the spectral slopes measured from our Keck LRIS spectra, to deduce from the values of implied by the galaxy magnitudes.
There are two conclusions that can be drawn from the results in Table 3. First, in most cases the Balmer lines indicate star formation rates which broadly agree, to within factors of , with the values obtained by applying the Bruzual & Charlot (1996) models to the observed UV continuum luminosities. This is the level of agreement to be expected between different star formation indicators, even in the local universe (e.g. Meurer et al. 1995), given the systematic uncertainties in the calibrations and the possibility that ionized gas and early-type stars have different spatial distributions (e.g. Leitherer et al. 1996).
Second, Figure 5 suggests that
there may be a trend between the ()
color and SFRHβ/SFRUV in
the sense that the redder galaxies have apparently the larger values
of this ratio. Thus Q0201113 B13, which is among the bluest galaxies in our
entire sample, has a Balmer line flux close to that predicted from
its UV continuum luminosity,
while in DSF 2237116 C2, which with () = 1.13 is close to the
red limit of our selection criteria for Lyman break galaxies,
we apparently see times more H photons than expected.
The other three galaxies are intermediate cases.
Before reading too much into this ‘trend’, we must remember that
we are dealing with only a small number of measurements from
infrared spectra of low signal-to-noise ratio.
Nevertheless, the effect is in the direction expected from dust
extinction, which is more effective at ultraviolet wavelengths than in
the optical. It is worthwhile considering, then,
the magnitude of the UV extinction at 1500 Å, , implied by
the SFRHβ/SFRUV ratios, and how this is related to the
observed () colors.
3.1 Ultraviolet Extinction of Lyman Break Galaxies
Specifically, we are going to determine the values of which satisfy the requirement , where are the star formation rates corrected for extinction. This would be a straightforward calculation were it not for the fact that we are totally ignorant of the wavelength dependence of dust extinction in Lyman break galaxies! Here we consider what are generally thought to be two limiting cases, the extinction curve determined for stars in the Small Magellanic Cloud (Bouchet et al. 1985; Gordon & Clayton 1998) and the ‘attenuation’ curve derived from the integrated spectra of local star forming galaxies (Calzetti, Kinney, & Storchi-Bergmann 1994; Calzetti 1997a). The former rises steeply towards shorter wavelengths, while the latter is ‘greyer’ (see for example Figure 2a of Calzetti 1997a). These differences are thought to arise, at least in part, from different geometrical configurations of the dust and background sources of light. The SMC extinction curve is derived from observations of individual stars, where dust is mostly in a foreground screen which removes both scattering and absorption components of the extinction curve, whereas the integrated stellar spectrum which emerges from an extended region presumably includes photons scattered into the line of sight by dust mixed with the stars. Whether the latter situation also applies to Lyman break galaxies depends to some extent on the geometrical configuration of the large scale outflows which seem to be a common feature of their interstellar media (see §5 below).
For the Bouchet et al. (1995) SMC reddening law with Pei’s (1992) normalisation
| (1) |
where is in magnitudes, whereas the Calzetti (1997a) attenuation curve gives
| (2) |
With these conversion factors we deduce the values of listed in Table 4. It can be readily seen that the uncertainties in the conversion from to SFR and in the wavelength dependence of the extinction combine to give a wide range of possibilities for . UV extinctions by magnitudes seem typical, but we also find some unlikely solutions. The large dust corrections indicated for DSF 2237116 C2 if the Calzetti reddening curve applies would imply star formation rates in excess of 1000 yr-1 . We have retained negative (and therefore unphysical) values of in Table 4 because they give an indication of the inherent limitations of the analysis, which forces . Other possibilities are that our assumption that /H in Q0000263 D6 is incorrect, and that in Q0201113 B13 the Balmer lines suffer higher extinction than the stellar continuum (or some of the ionizing photons escape the nebula). Note that the combination of the year old continuous star formation model, which gives the lower SFR for a given UV luminosity, and the Calzetti attenuation, which has the lower differential extinction between 1500 Å and H, is the one which produces the largest values of .
3.1.1 Extinction Estimates from the Slope of the Ultraviolet Continuum
With a larger sample of emission line measurements, it will be possible in future to obtain an independent estimate of the star formation rate density at high which is less sensitive to dust corrections than the current rest frame UV data. For moment, however, it is of interest to consider whether the few Balmer line detections available can be used to ‘calibrate’, as it were, a dust extinction index based on the ultraviolet spectral energy distribution (SED), given the large number of UV spectra of Lyman break galaxies now being obtained (Steidel et al. 1998b).
An index often used is , the slope of the UV continuum approximated by a power law of the form . Model spectral energy distributions (e.g. Leitherer & Heckman 1995) show that changes relatively little with age and metallicity; for a Salpeter IMF from to the Bruzual & Charlot (1996) continuous star formation models have increasing from to over the period to years. Empirically, the measured values of correlate both with the far-infrared excess (Meurer et al. 1995) and with the reddening deduced from the Balmer decrement (Calzetti 1997a), although there is considerable scatter in these relations. The empirical starburst template spectrum derived by Calzetti (1997b) has which would suggest that the youngest model SEDs may be too blue.
At our () color provides a more reliable estimate of the continuum slope between 1190 and 1710 Å (the effective wavelengths of the two filters are 4740 and 6850 Å respectively) than the value which could be measured directly from the Keck spectra. The reason for this is that the spectra are obtained through multi-object apertures which have fixed orientation on the sky; differential atmospheric refraction can lead to increasing light losses with decreasing wavelength which may be difficult to calibrate out. The net effect is to artificially redden the spectra (by an unknown amount) and it is therefore dangerous to use published Keck LRIS spectra to measure . For comparison with other analyses, we have listed in column (3) of Table 5 the values of implied by the observed () colour for each of the five galaxies in the present sample. They were calculated by convolving power laws in with the and filter transmission curves and folding in the average Lyman forest opacity as a function of redshift according to the prescription by Madau (1995).555Along any particular sight-line the Lyman forest opacity may differ somewhat from Madau’s average. However, the ensuing error in slope of the UV continuum is small compared with that which could result from the uncertain photometric calibration of the LRIS spectra.
In order to estimate the dust reddening of the UV continuum, we have determined a color excess E() = ()obs ()calc where the two terms on the right-hand side of the equality are the observed and expected values of (). Again, we have calculated ()calc by convolving the appropriately redshifted Bruzual & Charlot (1996) model SEDs with the filter transmission curves and allowing for the Lyman forest opacity. The resulting values of E() for the and year model SEDs are listed in columns (4) and (7) of Table 5 respectively. Columns (5) and (6), and (8) and (9) of Table 5 then give the values of implied by the () color excess, depending on whether the SMC or Calzetti extinction law is adopted. Once again we see that is not well constrained, the different permutations of intrinsic UV slope and reddening curve allowing solutions which span a magnitude range. In this case it is the combination of the Calzetti curve and year model (with its very blue intrinsic slope) which requires the largest values of ultraviolet extinction.
We can proceed further, however, by considering which set of model assumptions results in the values of for each galaxy which are most consistent between Tables 4 and 5. Comparing the entries in the two tables we see that for Q0000263 D6 the combination of years SED (UV9) and SMC extinction law satisfies both the UV slope and the SFRHβ/SFRUV tests with . UV7 + SMC gives a good solution in Q0201113 C6 for . The agreement is less than optimum in B2 0902343 C6 and DSF 2237116 C2, but even here we see that the UV7 SED gives answers which differ by only magnitudes between Tables 4 and 5 independently of the extinction curve used. Q0201113 B13 is not useful in this context because its spectrum is essentially unreddened.
It would be inappropriate to take these comparisons too literally and, for example, conclude that a particular extinction law is favoured or deduce an age for the star forming galaxies. The reasons are that our infrared spectra are of low signal-to-noise ratio and the galaxies probed are not sufficiently reddened to discriminate positively between the models. Furthermore, we do not even know at this stage that the models are internally consistent. For instance, the Bruzual & Charlot (1996) SED for the year old continuous star formation case may have a UV slope which is too blue compared to the unreddened continuum of the typical Lyman break galaxy and yet provide the correct calibration of the luminosity at 1500 Å as a function of SFR—the slope and normalisation of the models are independent parameters to some extent.
What seems to emerge from the comparison of Tables 4 and 5, however,
is that the values of which fit best both the UV
slopes and the ratios of the Balmer lines to the UV luminosity are
in every case
intermediate between the extreme possibilities
allowed by the different models. Very high and very low
values of UV extinction seem to be excluded even by the present limited
sample.
4 LINE WIDTHS AND MASSES OF LYMAN BREAK GALAXIES
In column (2) of Table 6 we have listed the values of the velocity dispersion (= FWHM/2.355) deduced by fitting the Balmer and [O III] emission lines with Gaussian profiles and correcting for the instrumental resolution (thermal motions make a very small contribution to the line widths found here). In general there is good agreement between values of measured from different emission lines in the same galaxy; the errors quoted in Table 6 were obtained by propagating the error of each Gaussian fit. We find that four out of the five galaxies have similar velocity dispersions, km s-1, while in the fifth, DSF 2237116 C2, the lines are apparently about three times wider.
HST NICMOS images of two of the galaxies in our sample (see Table 6) show well resolved objects with half-light radii arcsec (corresponding to kpc at in the cosmology adopted here). For two other galaxies, we measure similar sizes from near-IR images obtained in 0.5 arcsec seeing with NIRC on the Keck II telescope (when both are available, ground-based and HST measurements are in good agreement). Combining these radii with the measured velocity dispersions we obtain virial masses (see column (5) of Table 6). Thus, in Lyman break galaxies at we already find masses comparable to, or exceeding, that of the Milky Way bulge (Dwek et al. 1995). In reality, we may well be underestimating the total masses of these systems because at the low S/N of our observations we could easily miss broader components of the emission lines666It is also conceivable that we may over-estimating the virial masses if the emission line widths have significant contributions from gas accelerated to high velocities from supernova explosions and stellar winds.. As discussed by Steidel et al. (1998a — see also Giavalisco et al. 1998 and Adelberger et al. 1998) the clustering properties of Lyman break galaxies, interpreted within the cold dark matter scenario of galaxy formation, point to dark halo masses .
If star formation takes place in rotationally supported disks,
the typical km s-1 implies
rotational velocities km s-1 (Rix et al. 1997).
However, it has been known for a long time
that in local starburst galaxies
the nuclear emission lines do not reflect
the full rotation speed of the
galaxy (Weedman 1983).
Lehnert & Heckman (1996) found that starbursts
are roughly confined to solid body part of the galaxy rotation curve
and that the widths of the emission lines typically underestimate
the full by a factor of .
If a similar situation applied to galaxies at
(a highly speculative hypothesis, admittedly)
rotational velocities km s-1 may be indicated.
Note that in this picture, where the emission in the
nebular lines is dominated by H II regions in the star forming
cores of larger galaxies,
it is reasonable to expect the strong, saturated
interstellar absorption lines to be broader than
H and [O III], as is indeed the case (Steidel et al. 1996),
because the absorption takes place over longer
pathlengths, presumably through half of the galaxy.
In this case both galactic rotation and the large scale ‘stirring’
of the interstellar gas by
supernovae and stellar winds (see §5 below)
may be contributing to the strengths of the
absorption lines. Heckman (1998) reached a similar
conclusion for local starburst galaxies.
5 REDSHIFTS OF EMISSION LINES AND LARGE SCALE MOTIONS
Table 7 lists the relative velocities of the interstellar absorption, nebular emission, and Lyman emission lines; we have assumed that the Balmer and [O III] emission lines are at the systemic redshift of each galaxy. The immediate conclusion is that large velocity fields are a common feature of Lyman break galaxies, confirming the initial hints provided by the large equivalent widths of the interstellar absorption lines (Steidel et al. 1996) and in agreement with the analyses by Lowenthal et al. (1997) and Franx et al. (1997). In all three cases where we detect Lyman emission, the line peak is redshifted by km s-1 relative to the metal absorption lines. In two out of three cases (Q0000263 D6 and B2 0902343 C6) H and [O III] are at intermediate velocities; furthermore, in Q0000263 D6 Lyman emission exhibits an obvious P-Cygni profile, with a sharp drop on the blue side and a long tail of emission extending to km s-1 on the relative velocity scale of Table 7 (see Figure 8 of Pettini et al. 1997).
These characteristics are most easily interpreted as evidence for large scale outflows with velocities of km s-1 in the interstellar media of the galaxies observed. In this picture Lyman emission is suppressed by resonant scattering and the only Lyman photons which can escape unabsorbed in our direction are those back-scattered from the far side of the expanding nebula, whereas in absorption against the stellar continuum we see the approaching part of the outflow. The data also show that the real situation is probably more complex than this simple sketch. In one case (DSF 2237116 C2) H and [O III] emission are apparently at roughly the same velocity as the absorption lines, even though Lyman emission is redshifted by km s-1. Most difficult to understand in the km s-1 difference between emission and absorption lines in Q0201113 C6, large enough to raise the question of whether the two sets of lines are at all related!
Nevertheless, all of the above features—blueshifted metal lines,
redshifted Lyman emission, and a variety of Lyman profiles ranging
from emission
to P-Cygni and to damped absorption—have been observed in HST
spectra of nearby H II and starburst galaxies
(Kunth et al 1998; González Delgado et al. 1998),
although lower outflows velocities are normally involved.
The variety of Lyman emission-absorption profiles may
reflect different stages in the interaction of the mechanical energy
generated by the starburst with the interstellar medium of the host galaxy
and/or different viewing angles
(Giavalisco, Koratkar, & Calzetti 1996).
Irrespective of the details of this picture, two facts are clear.
First, we see directly the process by which heavy elements can be
distributed far from the sites of production (Heckman 1998).
If outflows of km s-1 are maintained over lifetimes of
years,
the metals will travel over distances
kpc, more than enough to seed
the entire dark matter halo of each Lyman break galaxy.
Second, just as the luminosity of Lyman emission is in general poorly
related to the star formation rate, its wavelength is not a useful measure
of the galaxy systemic redshift.
6 DISCUSSION
Our first detections of nebular emission lines at have predictably gone only part way towards determining the typical extinction suffered by the ultraviolet continuum of Lyman break galaxies. The present sample of 5 galaxies includes one which is essentially unreddened, three where the continuum at 1500 Å is dimmed by between and magnitude, and one where the extinction may be as much as magnitudes. The main conclusion reached in §3, however, is that the values of which best fit all the available data are intermediate solutions within the wide range allowed by different combinations of SEDs and reddening curves.
Recently, Dickinson (1998) has analysed the () colors of our entire sample of more than 400 spectroscopically confirmed Lyman break galaxies in the same way as discussed in §3.1.1 above. His analysis showed that, based on the UV slope alone, the value of to be applied to the population as a whole can be as little as 0.75 magnitudes or as large as 3.1 magnitudes for the different combinations of SEDs and extinction curves considered in §3.1.1 . The upper end of this range agrees with the factor of 16 proposed by Sawicki & Yee (1998); in both cases such high values are derived assuming the bluest intrinsic continuum (UV7 in the notation above) and the greyest extinction curve (Calzetti).
If our preliminary conclusion for the five galaxies considered here applies to the whole population, it would favour values of near the middle of the range determined by Dickinson; thus, may be the typical ultraviolet extinction (in magnitudes) suffered by Lyman break galaxies at 1500 Å. If this still tentative statement holds up in the light of future infrared observations, several interesting consequences follow.
First, this amount of dust would produce an extinction magnitudes (SMC and Calzetti curves respectively) of the near-ultraviolet continuum of galaxies at in the Canada-France Redshift Survey (Lilly et al. 1996). This is in good agreement with available determinations of , based on the comparison between the luminosities in H and in the continuum at 2800 Å (Tresse & Maddox 1998; Glazebrook 1998; see also Flores et al. 1998). Similarly, Buat & Burgarella (1998) recently concluded that magnitudes is typical of nearby starburst galaxies. Thus there is no need to assume that, as we look back to earlier epochs, an increasing fraction of the star formation activity takes place in highly obscured galaxies (such a scenario would be called for if the far-UV continuum of Lyman break galaxies were suppressed by more than a factor of 10; Madau et al. 1998, Guiderdoni et al. 1997). The dust corrections proposed here, while raising the values of the ultraviolet luminosity density by larger factors at than at , still maintain the same broad picture of the cosmic star formation history sketched by Madau et al. (1996), with the peak in activity at an intermediate epoch between these two redshifts.
(Of course the present data do not address the separate question of whether our photometric selection based on the Lyman break misses a significant component of the galaxy population at , in which the the UV continuum may be too faint to be detected. However, as discussed by Adelberger et al. (1998), the clustering properties of the Lyman break galaxies suggest that such an unseen population is likely to contribute only a small fraction of the total number of luminous galaxies at these redshifts.)
Second, it is of interest to ask where the metals associated with the
higher, dust-corrected rates of star formation are to be found.
Pettini et al. (1997) showed that at
damped Lyman systems can account for
the metal production expected from the uncorrected
UV luminosity.
We note, however, that the estimates of metallicity by Pettini et al.
are based on measurements of the abundance of Zn,
which traces that of the Fe-peak elements.
The average metallicity of DLAs, , may need to be corrected
upwards by a factor of , if O and other elements
are overabundant by 0.4 dex relative to Fe, as is the case in
metal-poor stars of the Milky Way (e.g. McWilliam 1997).
Therefore even when dust obscuration is taken
into account, there may still be a broad consistency, given the
uncertainties, between these two
independent measures of the metallicity of the
universe—the metals seen in absorption towards distant QSOs and those
produced by the star forming galaxies imaged directly.
On the other hand,
if future observations were to reveal
that we have underestimated the dust
correction to the UV luminosity of galaxies,
the implication would be that DLA systems
‘miss’ metal-rich regions of the universe,
either because current QSO absorption line samples are biased in favour
of metal- and dust-poor sightlines, and/or because the metals may be retained
close to their production sites.
It will be possible to test these ideas in the near future, as
wide field surveys yield
new and larger samples of damped Lyman systems
towards fainter—and potentially more
reddened—QSOs
than studied up to now (e.g. Shaver et al. 1998).
7 SUMMARY
The main results of this work are as follows.
(1) We report the first detections of Balmer and [O III] emission lines from five Lyman break galaxies at , achieved by targeting redshifts such that these transitions fall in the gaps between the strong OH- lines which dominate the near-infrared sky. The five galaxies span nearly the full range of our color selection criteria for Lyman break galaxies.
(2) For a Salpeter IMF between 100 and 0.1 and neglecting dust extinction, the measured H luminosities of erg s-1 ( km s-1 Mpc-1, ) imply star formation rates of between and yr-1. These values are generally larger than those estimated from the ultraviolet continuum at 1500 Å by factors of between and .
(3) The present sample is too small to determine reliably the value of , the dust extinction suffered by the continuum at 1500 Å, given the uncertainties in the model spectral energy distributions and in the wavelength dependence of the extinction curve. However, in general we find that the solutions which best fit both the slope and the luminosity of the UV continuum (relative to H) correspond to intermediate values of extinction within the large range allowed by the models. Thus, we favour magnitudes as the values most likely to be representative of the whole sample of Lyman break galaxies.
(4) The amount of dust implied would depress the near-UV continuum by only magnitudes, in good agreement with recent determinations of this quantity for CFRS galaxies at . The upward corrections proposed do not require a significant revision of the broad picture of the star formation history of the universe put together by Madau et al. (1996). Similarly, there is still a plausible agreement between the metal production associated with the star forming galaxies we see and the heavy elements detected in absorption against distant QSOs.
(5) The nebular emission lines recorded are resolved in every case. It appears that the typical velocity dispersion is km s-1, although we also find one galaxy where the line widths are nearly three times larger. With typical half-light radii of kpc, virial masses are suggested. It is possible that both velocities and masses have been underestimated because with the limited sensitivity of the present observations we may well be seeing only the inner cores of the galaxies, where star formation is most in evidence.
(6) The relative redshifts of the interstellar absorption, nebular emission, and Lyman emission lines indicate that large scale outflows with velocities of at least km s-1 are a common feature of the interstellar media of Lyman break galaxies. These outflows, presumably driven by the mechanical energy generated in the star formation episodes, can distribute the products of stellar nucleosynthesis over large volumes.
(7) Perhaps the most valuable aspect of this work is in showing that
infrared spectroscopy of galaxies at is feasible
and in highlighting
the wealth of information which such spectra potentially offer.
With the forthcoming availability of medium resolution spectrographs
on large telescopes, we expect that infrared observations will
play a major role in advancing our understanding
of the nature of Lyman break galaxies.
References
- (1)
- (2) Adelberger, K.L., Steidel, C.C., Giavalisco, M., Dickinson, M., Pettini, M., & Kellogg, M. 1998, ApJ, in press (astro-ph/9804236)
- (3)
- (4) Bechtold, J., Elston, R., Yee, H.K.C., Ellingson, E., & Cutri, R.M. 1998, in The Young Universe: Galaxy Formation and Evolution at Intermediate and High Redshift, (ASP Conference Series), in press (astro-ph/9802230)
- (5)
- (6) Blain, A.W., Smail, I., Ivison, R.J., & Kneib, J.-P. 1998, MNRAS, submitted (astro-ph/9806062)
- (7)
- (8) Bouchet, P., Lequeux, J., Maurice, E., Prevot, L., & Prevot-Burnichon, M.L. 1985, A&A, 149, 330
- (9)
- (10) Bruzual, G., & Charlot, S. 1996, private communication
- (11)
- (12) Buat, V., & Burgarella, D. 1998, A & A, in press (astro-ph/9803156)
- (13)
- (14) Calzetti, D. 1997a, in The Ultraviolet Universe at at Low and High Redshift: Probing the Progress of Galaxy Evolution, ed. W.H. Waller, M.N. Fanelli, J.E. Hollis, & A.C. Danks AIP Conference Proceedings 408, (New York: Woodbury), 403
- (15)
- (16) Calzetti, D. 1997b, AJ, 113, 162
- (17)
- (18) Calzetti, D., Kinney, A.L., & Storchi-Bergmann, T. 1994, ApJ, 429, 582
- (19)
- (20) Dickinson, M. 1998, in The Hubble Deep Field, ed. M. Livio, S.M. Fall, & P. Madau. STScI Symposium Series, in press (astro-ph/9802064)
- (21)
- (22) Dwek. E., et al. 1995, ApJ, 445, 716
- (23)
- (24) Eales, S.A. & Rawlings, S. 1993, ApJ, 411, 67
- (25)
- (26) Flores, H. et al. 1998, in preparation
- (27)
- (28) Franx, M., Illingworth, G., Kelson, D., van Dokkum, P., & Tran, K.-V. 1997, ApJ, 486, L75
- (29)
- (30) Giavalisco, M., Koratkar, A., & Calzetti, D. 1996, ApJ, 466, 831
- (31)
- (32) Giavalisco, M., Steidel, C.C., Adelberger, K.L., Dickinson, M.E., Pettini, M., & Kellogg, M. 1998, ApJ, in press (astro-ph/9802318)
- (33)
- (34) Glazebrook, K. et al. 1998, in preparation
- (35)
- (36) González Delgado, R.M., Leitherer, C., Heckman, T., Lowenthal, J.D., Ferguson, H.C., & Robert, C. 1998, ApJ, in press
- (37)
- (38) Gordon, K.D., & Clayton, G.C. 1998, ApJ, in press (astro-ph/9802003)
- (39)
- (40) Guiderdoni, B., Bouchet, F., Puget, J.L., Lagache, G., & Hivon, E. 1997, Nature, 390, 257
- (41)
- (42) Heckman, T.M. 1998, in The Most Distant Radio Galaxies, ed. P. Best, H. Rottgering, & M. Lehnert (Dordrecht: D. Reidel), in press (astro-ph/9801155)
- (43)
- (44) Kennicutt, R. 1983, ApJ, 272, 54
- (45)
- (46) Kunth, D., Mas-Hesse, J.M., Terlevich, E., Terlevich, R., Lequeux, J., & Fall, S.M. 1998, A&A, in press (astro-ph/9802253)
- (47)
- (48) Lehnert, M.D., & Heckman, T.M. 1996, ApJ, 472, 546
- (49)
- (50) Leitherer, C., & Heckman, T.M. 1995, ApJS, 96, 9
- (51)
- (52) Leitherer, C., Robert, C. & Heckman, T.M. 1995, ApJS, 99, 173
- (53)
- (54) Leitherer, C., Vacca, W.D., Conti, P.S., Filippenko, A.V., Robert, C., & Sargent, W.L.W. 1996, ApJ, 465, 717
- (55)
- (56) Lilly, S.J., Le Févre, O., Hammer, F., & Crampton, D. 1996, ApJ, 460, L1
- (57)
- (58) Lowenthal, J. et al. 1997, ApJ, 481, 673
- (59)
- (60) Madau, P. 1995, ApJ, 441, 18
- (61)
- (62) Madau, P., Ferguson, H.C., Dickinson, M.E., Giavalisco, M., Steidel, C.C., & Fruchter, A. 1996, MNRAS, 283, 1388
- (63)
- (64) Madau, P., Pozzetti, L., & Dickinson, M. 1998, ApJ, 498, 106
- (65)
- (66) Mannucci, F., Thompson, D., Beckwith, S.V.W., & Williger, G.M. 1998, ApJ, in press (astro-ph/9805103)
- (67)
- (68) McWilliam, A. 1997, ARAA, 35, 503
- (69)
- (70) Meurer, G.R., Heckman, T.M., Lehnert, M.D., Leitherer, C., & Lowenthal, J. 1997, AJ, 114, 54
- (71)
- (72) Meurer, G.R., Heckman, T.M., Leitherer, C., Kinney, A., Robert, C., & Garnett, D.R. 1995, AJ, 110, 2665
- (73)
- (74) Mushotzky, R.F., & Loewenstein, M. 1997, ApJ, 481, L63
- (75)
- (76) Osterbrock, D.E. 1989, Astrophysics of Gaseous Nebulae and Active Galactic Nuclei, (University Science Books)
- (77)
- (78) Pei, Y.C. 1992, ApJ, 395, 130
- (79)
- (80) Pettini, M., Smith, L.J., King, D.L., & Hunstead, R.W. 1997, ApJ, 486, 665
- (81)
- (82) Pettini, M., Steidel, C.C., Adelberger, K.L., Kellogg, M., Dickinson, M., & Giavalisco, M. 1997, in Cosmic Origins: Evolution of Galaxies, Stars, Planets, and Life, ed. J.M. Shull, C.E. Woodward, and H.A. Thronson, (ASP Conference Series), in press (astro-ph/9708117)
- (83)
- (84) Ramsay, S.K., Mountain, C.M., & Geballe, T.R. 1992, MNRAS, 259, 751
- (85)
- (86) Renzini, A. 1997, ApJ, 488, 35
- (87)
- (88) Rix, H.W., Guhathakurta, P., Colless, M., & Ing, K. 1997, MNRAS, 285, 779
- (89)
- (90) Sawicki, M., & Yee, H.K.C. 1998, AJ, 115, 1329
- (91)
- (92) Shaver, P.A., Hook, I.M., Jackson, C.A., Wall, J.V., & Kellermann, K.I. 1998, in Highly Redshifted Radio Lines, ed. C. Carilli, S. Radford, K. Menten, & G. Langston (PASP: San Francisco), in press (astro-ph/9801213)
- (93)
- (94) Stasinska, G., & Leitherer, C. 1996, ApJS, 107, 661
- (95)
- (96) Steidel, C.C., Adelberger, K.L., Dickinson, M., Giavalisco, M., Pettini, M., & Kellogg, M. 1998a, ApJ, 492, 428
- (97)
- (98) Steidel, C.C., Adelberger, K.L., Giavalisco, M., Dickinson, M., Pettini, M., & Kellogg, M. 1998b, Phil. Trans. Roy. Soc. London A., in press (astro-ph/9805267).
- (99)
- (100) Steidel, C.C., Giavalisco, M., Pettini, M., Dickinson, M., & Adelberger, K.L. 1996, ApJ, 462, L17
- (101)
- (102) Steidel, C.C., Pettini, M., & Hamilton, D. 1995, AJ, 110, 2519
- (103)
- (104) Teplitz, H., Malkan, M., & McLean, I.S. 1998, ApJ, in press (astro-ph/9805157)
- (105)
- (106) Terlevich, R., Melnick, J., Masegosa, J., Moles, M., & Copetti, M.V.F. 1991, A&A Supp., 91, 285
- (107)
- (108) Thompson, D., Mannucci, F., & Beckwith, S.V.W. 1996, AJ, 112, 1794
- (109)
- (110) Trager, S.C., Faber, S.M., Dressler, A., & Oemler, A. 1997, ApJ, 485, 92
- (111)
- (112) Tresse, L., & Maddox, S.J. 1998, ApJ, 495, 691
- (113)
- (114) Treyer, M., Ellis, R.S., Milliard, B., Donas, J., & Bridges, T.J. 1998, MNRAS, in press (astro-ph/9806056)
- (115)
- (116) Weedman, D. 1983, ApJ, 266, 479
- (117)
![[Uncaptioned image]](/html/astro-ph/9806219/assets/x1.png)
![[Uncaptioned image]](/html/astro-ph/9806219/assets/x2.png)
![[Uncaptioned image]](/html/astro-ph/9806219/assets/x3.png)
![[Uncaptioned image]](/html/astro-ph/9806219/assets/x4.png)
![[Uncaptioned image]](/html/astro-ph/9806219/assets/x5.png)
| Name | (km s-1) | Half-light radius (arcsec) | Half-light radius (kpc)a | () |
|---|---|---|---|---|
| Q0000263 D6 | 1.8 | 0.8 | ||
| Q0201113 C6 | 2.0 | 1.2 | ||
| Q0201113 B13 | 1.5 | 1.3 | ||
| B2 0902343 C6 | … | … | … | |
| DSF 2237116 C2 | 1.5 | 5.5 |
| Name | (km s-1) | (km s-1) | (km s-1) |
|---|---|---|---|
| Q0000263 D6 | 0 | ||
| Q0201113 C6 | 0 | … | |
| Q0201113 B13 | 0 | … | |
| B2 0902343 C6 | 0 | ||
| DSF 2237116 C2 | 0 |