Blue spectra and induced formation of primordial black holes
Abstract
We investigate the statistical properties of primordial black hole (PBH) formation in the very early Universe. We show that the high level of inhomogeneity of the early Universe leads to the formation of the first generation PBHs. This causes later the appearance of a dust-like phase of the cosmological expansion. We discuss here a new mechanism for the second generation of PBH formation during the dust-like phase. This mechanism is based on the coagulation process. We demonstrate that the blue power spectrum of initial adiabatic perturbations after inflation leads to overproduction of primordial black holes with gg if the power index is .
1 Introduction
Blue primordial power spectra of initial scalar perturbations have spectral index and arise naturally in the modern inflationary scenario [1]. The observational upper limit on is derived by normalizing the amplitude and spectral index to the quadrupole scale. The COBE data [2] are compatible with a power spectrum of adiabatic perturbations with at 68% confidential level (CL). At 95% CL the observational limit on corresponds to [6]. It means that a direct extrapolation of the COBE data to extremely small scales even with the maximal possible value (one-sigma upper limit) can give great enough for the formation of a large (remarkable) number of mini black holes [3,4]. Limits on their production [5] can be used to re-evaluate the restrictions on the density perturbations spectrum including the spectral index . This problem was discussed by Carr, Gilbert and Lidsey [3], and recently by Green and Liddle [4]. They found a significantly strong restriction on the power spectrum index , rather smaller than (one-sigma upper limit) from COBE-data.
In our paper we demonstrate that due to the so called mechanism of induced formation a blue spectrum of the initial perturbations with leads to the formation of a great number of PBHs with gg
Firstly, following [3] we assume that the PBHs of extremely low mass g are formed directly in the early Universe from initial density fluctuations with power spectrum and COBE-normalized amplitude at the moment , where and are the Planck parameters. We note that for blue spectra with the variance of fluctuations is great enough for the formation of a large number of mini black holes, which can produce a dust-like phase of the expansion of the Universe at times .
Secondly, we are interested in the situation where PBHs with g are formed from PBHs with g due to hierarchical clustering of fluctuations in the dust-like background of the primordial low mass black holes . We demonstrate that during a PBH dust era the fraction of the matter in the Universe accumulated into PBHs with g is great enough to produce the remarkable abundance of the massive PBH in the indicated interval of masses. These black holes will evaporate up to the present time and will be able to change the observational restrictions [5].
Finally, we shall demonstrate that for a blue power spectrum of initial adiabatic perturbations there is a limit on the power index: .
The plan of this paper is as follows. In Section 2 we briefly discuss the conditions for PBH formation in the early Universe with the equation of state and . In Section 3 we investigate the possibility to have a dust-like phase of the expansion of the Universe due to PBH creation with extremely low masses . In Section 4 we discuss the conditions for formation of PBHs by direct collapse of the initial perturbations. In Section 5 we investigate a more efficient mechanism of PBH formation during the dust-like phase of the expansion of the Universe which is based on the coagulation approach. In Section 6 we summarize the main results of the investigation.
2 Formation of the PBHs with the extremely low mass.
In this section we investigate primordial low-mass black holes formation from density perturbations directly at the epoch of the expansion of the Universe with the hard equation of state . We assume that just after the period of reheating, which is a natural part of the modern theory of inflation, the equation of state corresponds to and the spectrum of the initial perturbations is blue: ; according to COBE data (one-sigma upper limit) [1]. Following [6] we assume that initial density perturbations produced during the inflation period are Gaussian and the probability distribution of the smoothed density field is given by
| (1) |
Here is the mass variance evaluated at the horizon crossing;
| (2) |
where is the power spectrum with amplitude and spectral index ; is the filtering scale which is linked with the mass of fluctuation at the horizon scale for of the equation of state and for the radiation-dominated Universe. In the Universe the mass fraction of black holes , which are formed directly by the collapse of initial perturbations at the horizon scale can be obtain from formula (1) using Carr-Hawking criterium (see [7]):
| (3) |
Note, that there are a number of observational limits on a PBH fraction in the very early Universe, covering various mass ranges of its mass spectrum (3). For the future investigation we use -limits from nucleosynthesis and PBH evaporation at present time [5]. As one can see from (3), mass fraction of PBH , is very sensitive to the amplitude and spectral index of the initial density perturbations. Here is the mass density of black holes and is the density of the ultrarelativistic background at the moment of PBH creation.
For example, if and for Harrison=Zeldovich spectrum normalized to COBE-data, then a probability of PBH formation is extremely low: , and primordial black holes practically cannot exist in the whole mass interval. However, the situation changes drastically for blue power spectra . It is worth to note , that for Universe the variance of fluctuations at scale has a form [4]:
| (4) |
where is the standard horizon mass at the moment of matter-radiation equality. For up to COBE mass scales, the variance is
| (5) |
For the future investigation we use Eq.(4) and Eq.(5) and the fit of the four-year COBE data for the amplitude of spectra at the scale from [8]:
where and are the Hubble constant and scale factor at the present time. The distribution of function for different , is plotted on the power index -mass diagram (Fig.1). Further we use the modified power index and normalization from Eq.(4)-Eq.(5) on the COBE mass scale , which corresponds to :
| (6) |
Let us introduce the new function :
| (7) |
where - is the parameter.
Note, that for any kind of blue power spectrum the power index . Let us consider the equation . For different values of the parameter this equation gives us the function , which corresponds to the from Eq.(6) at . Using this method, we would like to focus attention on the thin dashed, dotted and solid lines of Fig.1, which are concentrated at the range of (see Fig.1). These lines correspond to the series of function from Eq.(7) with the different values of . The lowest dashed line corresponds to , the next line (dotted) corresponds to .
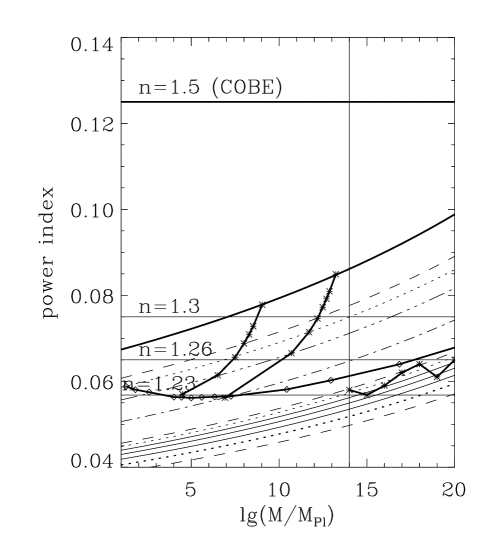
Three next solid lines represent and correspondingly. Two next lines (short dashed and long dashed) correspond to and . As in can be seen from Eq. (3) and Eq.(7) for this kind of function the value of parameter can be normalized on the fraction of PBH (see Eq.(3)). Using this normalization, we plotted in Fig.1 the thick solid line at the interval which corresponds to the well known limits of PBH’s probabilities [5].
There is no observational restriction at g, and we can use only one limit , where is the ratio of the black hole and critical densities at present time, for g .
Note, that the increasing of the variance of fluctuations at is the natural behavior of the blue power spectrum. There is not such a behavior for Harrison-Zeldovich and tilted () power spectra. The growth of at small scales of perturbations is a cause of the producing low-mass PBHs (g but ) which evaporate before the period of the cosmological nucleosynthesis. However, these low-mass PBHs can produce the dust-like phase of the expansion of the Universe and change the condition of formation the next generation of PBHs with gg. Thus, the high density of the low-mass PBHs (we use an index “” for this first generation of PBHs) can induce the overproduction of the PBHs with gg (the second generation) at the dust-like phase of the expansion.
In the next section we will discuss this possibility in some detail.
3 Dust-like phase of formation of the PBHs.
Let us describe the condition which produces the PBH dust-like phase of the expansion of the Universe. We denote by the time of formation of black holes of the first generation in the radiation dominated Universe.
Let be a fraction of matter to the Universe collapsed into the first generation PBHs with mass . It is well known [4, 6] that the period of formation, , and the mass of PBH are linked by the equation:
| (8) |
where is the effective number of massless degrees of freedom at . After primordial black holes are formed, the mass density of its first generation begins to decrease as , where is a scale factor. The mass density of ultrarelativistic matter decreases more rapidly: . In this case at
| (9) |
the cosmological expansion is determined by PBHs with . If the time of evaporation of these black holes
| (10) |
is much greater than the time , then the duration of PBH dust-like phase is , where is the parameter depending on the number of particles species which can be emitted (see [4])).
It is worth to note that at the moment the space distribution of PBHs with is modulated by the long wave perturbations in the ultrarelativistic background. This spectrum of adiabatic fluctuations is preserved in the PBH’s distribution up to the dust-like phase.
At density fluctuations in the non-relativistic “gas” of PBH growth with time and the variance of perturbations in the PBH’s distribution at is:
| (11) |
where is the mass of perturbations, and
| (12) |
is the transfer function of perturbations, and is the mass of PBHs in the volume :
| (13) |
As it is seen from (11) - (13), the spectrum is practically flat () when and there is a turn over point at . This spectrum arises only under conditions and , when the hydrodynamic approach is correct. Actually (see Fig.1) for the blue power spectrum with the level of primordial fluctuations at small mass scales is comparatively high. For example, if g, then g; g and . In this case the spectrum of perturbations in the black holes background is similar to well known spectral distribution of fluctuations in the standard Cold Dark Matter (CDM) Universe model.
This analogy has a deep reason. In the standard CDM theory of the formation of the large scale structure of the Universe the typical scale of the mass density perturbations has a turn over point at the scale of the equality, which is close to the typical scale of clusters of galaxies (). At the scale the dynamics of clusterisation of perturbations is very complicated because of nonlinear transformation of spectra which was investigated by Doroshkevich et al. [9].
According to [9], the hierarchical clusterisation of non-linear configuration takes place at all scales of perturbations. During this process the typical configurations of low mass (mini pancakes) are clustering step by step into massive pancakes up to the typical scale . In the standard CDM Universe clusters of galaxies are formed during a very short time corresponding to a redshift , . It means that nonlinear transformation of the spectrum of perturbations has a cutoff caused by the limitation of the age of the Universe.
For the PBH’s dust-like phase at the situation changes drastically. The duration of this phase covers not only the period of the formation of structures with , but also the period of the formation of structures with . In this case objects with at the moment of evaporation are virialized and form the high massive objects with (see (11) - (12)):
| (14) |
In addition, there are two very important differences between the rate of clusterisation during PBH dust-like phase and the standard CDM model of the structure formation. Firstly, if is not especially small, then the scale of maximum of perturbations contains mini PBH with , and for the description of the rate of clusterisation one needs to use the kinetic approach. This situation takes place, for example, if initial power index is and =1g (see Fig.1). As it is seen from Fig.1, g; and .
Secondly, in the context of the CDM scenario the background particles are collisionless and “interact” each other and with the baryonic matter only through gravitation. However, PBHs with can collide especially inside the quasi stationary stable gravitational configurations (PBH’s clusters - “gas”), which are formed during the dust-like phase.
These two last reasons are linked with a very important question - can the first generation primordial black holes produce the next generation of the PBH during the dust-like phase or they have to disappear because of Hawking’s evaporation without any observational consequences?
The answer this question depends very essentially on the probability of PBH formation at the dust-like phase, which we describe in the next section.
4 The probability of the formation of the second generation of PBHs. The spherical symmetry approximation.
The problem of PBH formation during the dust-like phase was pointed out in the pioneering articles by Polnarev and Khlopov [10,11]. According to [10] the fraction of matter going into PBH is determined by the probability that the overdense region is sufficiently spherical symmetric and homogeneous. This region collapses into a black hole directly. The fraction of PBH which is formed due to this mechanism is given by [10]:
| (15) |
where is a variance of the density perturbations at the moment when the dust-like phase starts.
Below we briefly discuss the initial conditions leading to Eq.(15). As we mentioned above, if the hydrodynamic approach is applicable, we can describe the statistic properties of the Gaussian field of the density perturbations according to Bardeen et al. [12]. First of all, we can express the Gaussian point process entirely in terms of the density perturbations field and its derivatives. In the vicinity of the point of a maximum of field we can use the Taylor series expansion:
| (16) |
where is the second derivative tensor of the field at (so called deformation tensor). We transform the coordinate system along the principle axes of the deformation tensor and determine three its eigenvalues , and . Doroshkevich [13] has shown that the joint probability density for , and has a form:
| (17) |
where , is the variance of at the moment ; and . Following [12] we define a three-axial ellipsoidal surface with semiaxes
| (18) |
and characterize the asymmetry of field at the vicinity of the point of maxima () by the parameters:
| (19) |
As the result, the distribution of field around a point of a maximum in the spheric system of coordinates is [12]
| (20) |
where
| (21) |
is the power spectrum of the density perturbations.
The main idea which was used by Polnarev and Khlopov [10,11] for the determination of the probability of PBH formation during the dust-like phase of the expansion is based on the hypothesis that three eigenvalue of the deformation tensor are extremely closed to each other: . Thus the parameters and are going to zero, and the distribution of the density field around the point of the maximum is spherical symmetric with a very good accuracy. One can obtain the probability of such realization of the random Gaussian process by integration of Eq.(17) over and . After integration we have [10,11]. An additional factor in Eq.(15) is connected with the condition of the homogeneous collapse of the configuration according to the Tolman’s solution [10,11]. Taking into account these conditions we would like to introduce two additional criteria which are important for the determination of the probability of PBH formation during the dust-like phase.
First, the collapse of a configuration into a black hole is definitely a non-local process and a criterium of the field distribution around a point of a maximum should be non-local also. Usually, this non-locality is possible to imitate using the filtering procedure:
| (22) |
where are different scales of filtering. Let us focus our attention on the spectrum of perturbations in the PBHs (or another “dust” particles, as was investigated in [10,11]), using Eq.(12). There exists a low-massive plateau at , where is practically constant for .
In this interval we use the small scale of filtering . At the same time, at the scale in terms of Eq.(12) we will use the large scale filtering . Following [10,11], we assume that after filtering () the condition of the spheric symmetry is valid in the vicinity of some point of a maximum of field . The criterium of the homogeneity of distribution is definitely correct for the -filtering only.
At the small scale the situation is more complicated. Following [12], it is easy to show that the concentration of the peaks which is obtained by the filtering is much higher than the the concentration of peaks (not especially high) in -field. The correlation function of the “smooth scale filtered” peaks has a typical correlation radius . If , then the character of the space distribution of the small scale peaks is Poissonian. It means that inside a large filtered peak which is spherical symmetric and homogeneous in average, there are small peaks which have a Maxwellian velocity distribution [12]. This configuration (a large scale smoothed peak and a lot of small scale peaks inside it) has properties to form not a black hole but a virialized cluster. However, the formation of a cluster is the natural part of the hierarchical clustering scenario without any specific and low-probability conditions of symmetry and homogeneity of the initial configuration.
In the CDM model these clusters are formed as a result of the interaction of pancakes (see [9]). It is the first reason why the probability from Eq.(15) overestimates the number of PBHs which can be formed during the dust-like phase of the expansion of the Universe.

The second reason is the following. The field of peaks which is smoothed by filter has a peak-peak correlation on a typical scale . It means that a local criterium of spheric symmetry, which does not take into account the influence of neighboring peaks, has a limited range of application in the especially small vicinity of a point of a maximum. We demonstrate this situation in Fig.2. As it is seen from this figure, the influence of the neighboring peaks can practically destroy the spherical symmetry of an initial peak. This problem of an “outside interaction” is the second reason to decreasing of -probability.
5 Induced (coagulation) mechanism of the PBH formation
In our model the dust-like phase is linked with the first generation of the PBHs, and we can introduce the following new mechanism of the PBH’s formation, based on the typical realization of overdense configurations - like pancakes. We don’t need a special spheric symmetry and homogeneity of the configuration because the formation of clusters is the result of interactions between pancakes similar to the cluster formation in the standard CDM model.
Using Press-Schechter formalism we can estimate the moment of formation of the PBH clusters for the spectrum (11)
| (23) |
where . The majority of these clusters are practically virialized at . Let us estimate the characteristic time scale when the PBHs inside a cluster can collide. The cross-section of the interaction of PBHs is , where is the Schwarzschild radius, and the variance of the velocity is , where is the radius of a cluster. In this case the time scale of the “hard core” collision is:
| (24) |
Note, that the is much greater than the time of the velocity relaxation inside a cluster:
| (25) |
It means that at the interaction between black holes of mass inside a cluster can be described using the coagulation approximation [14-16]. Let be the number of the density of black holes in the mass range at the moment . For mass distribution function we can write the coagulation equation [14,15]:
| (26) |
where , and denotes the averaging over the peculiar velocity . After averaging over the peculiar velocity we have . From Eq.(25) we can obtain the following expression:
| (27) |
where is the total mass inside a cluster and is the total number of the structured elements in the cluster. We would like to emphasize that the rate of reaction does not depend on the time . This approximation is practically the same that was discussed by Trubnikov [14], and Silk and White [15]. In this case we can use the scaling invariance of the function :
| (28) |
and describe the distribution function as:
| (29) |
where is the typical scale of mass during the process of coagulation of the PBHs inside the cluster, and is some function which depends on . This new function has the following property: for . From Eq.(25)-(27) for one can find the equations for and :
| (30) |
where and are the constants of normalization.
As it is seen from (29) decreases with time as:
| (31) |
where is the initial number of points at . In our case . For the determination of constant we can use the initial condition of the coagulation process:
| (32) |
where is the Dirac -function. Substituting it in Eq.(32) in Eq.(26) we have
| (33) |
Let us come back to Eq.(29). As one can find from this equation, mass of black holes of the second generation which are formed inside a cluster increases with time as
| (34) |
and formally going to infinity at . Actually at the whole mass of a cluster is concentrated in one massive black hole. But in this limit the coagulation approximation with virialized velocity field is inapplicable. However, the rate of the coagulation can be used for qualitative estimation of the mass of a central black hole inside a cluster. At it is equal:
| (35) |
and
| (36) |
We would like to emphasize that the rate of coagulation (31)-(32) is only the low limit of the clusterisation of the first generation of the PBHs into massive primordial black holes of the second generation. It is caused by the taking into account only “hard-core” collisions of black holes inside a cluster. In a general case the formation of pairs is important and the rate of coagulation increases111We describe this situation in a separate paper.. Thus if , then the PBHs form a massive black hole with inside a cluster. In Fig.1 we plotted the thick solid line with diamonds which corresponds to the equality . If initial amplitudes of perturbations at the range g are then the first generation of the PBHs produces the dust-like phase and induce the formation of the second generation of black holes. Two thick lines with asterisks correspond to the condition g (left line) and g (right line). In the first case has to be less than . At the second case we have . In both cases the critical level of the power index is . What will happen if this condition is broken? Obviously the first generation of PBHs forms the second generation of PBHs with gg and gg. We can estimate this factor using the Press-Schechter formula. For the clusters with the concentration is the following
| (37) |
where is determined by Eq.(14), and is the mean density of the PBHs during the dust-like phase. This density of the clusters with masses is . If each cluster of mass contains a massive black hole with the mass , , then the probability of the second generation black hole formation is
| (38) |
where is the observational limit222We would like to note that is remarkable less than unity, for example due to emission of the gravitational waves [17].
6 Conclusions
We have presented here the new mechanism of the formation of the primordial black holes in the very early Universe after inflation. We have shown that a high level of adiabatic perturbations in the early Universe leads to producing the first generation of the PBHs. Further these PBHs form the specific phase of the cosmological expansion - so called dust-like phase. The hierarchical clustering of perturbations in a “gas” of the PBHs is the source of formation of the next generation of the black holes inside the clusters. We have presented the new mechanism of the second generation of the PBHs formation which is based on the coagulation mechanism. We have shown that the initial inhomogeneity of the Universe “switch on” the mechanism of the induced PBH formation and leads to their over-producing if the power index of perturbations is . We note that the formation of PBH from the ”point-like” collisionless particles and from PBH of first generation has only one difference. Using Eq.(24) one can see, that and goes to infinity, if , where m is the mass of particles. In this case the coagulation mechanism of the PBH formation is inapplicable and the probability of the PBH formation is extremely low.
Acknowledgments
The authors are grateful to A.Doroshkevich and I.Novikov for useful discussions. P.N. is grateful to the staff of TAC, for providing excellent working conditions. This investigation was supported by the Danish Natural Science Research Council through grant No. 9401635 and also in part by Danmarks Grundforskningsfond through its support for the establishment of the Theoretical Astrophysics Center.
References
-
1.
S.Mollerach, S.Matarrese, F.Lucchin, Phys. Rev. D. 50, 4835, (1994); J.Garcia-Bellido, A.Linde and D. Wands, Phys. Rev. D. 54, 6040, (1996); J.Garcia-Bellido, A.Linde, Phys. Lett. B 398, 18, (1997); J.Garcia-Bellido, A.Linde, Phys. Rev. D. 55, 7480, (1997).
-
2.
C.L.Bennett et al. Astrophys. J. Lett. 464 L1 (1996).
-
3.
B.J.Carr, J.H.Gilbert, J.E.Lidsey, Phys. Rev. D. 50, 4853, (1994).
-
4.
A.M.Green and A.Liddle, Astro-ph. 9704251.
-
5.
B.J.Carr, Astrophys. J. 205, 1 (1975); Ya.B.Zeldovich, A.A.Starobinsky, M.Yu.Khlopov and V.M. Chechetkin, Pis’ma Astron. Zh. 3, 308, (1977) [Sov. Astron. Lett 22, 110 (1977)]. S.Mujana and K.Sato, Prog. Theor. Phys. 59, 1012 (1978); B.V.Vainer and P.D.Naselsky, Astron. Zh, 55, 231 (1978) [Sov. Astron. 22, 138 (1978)]; B.V.Vainer, O.V.Dryzhakova and P.D.Naselsky, Pis’ma Astron. Zh. 4, 344 (1978)[Sov. Astron. Lett. 4, 185 (1978)]; I.D.Novikov, A.G.Polnarev, A.A.Starobinsky and Ya.B. Zeldovich, Astron. Astrophys. 80, 104 (1979); D.Lindley, Mon. Not. R. Astron. Soc. 193, 593 (1980); T.Pothman and R. Matzner, Astrophys. Space. Sci. 75, 229 (1981); J.H.MacGibbon, Nature 320, 308 (1987); J.H.MacGibbon, and B.Carr, Astrophys. J. 371, 447 (1991).
-
6.
J.R.Bond. Phys.Rev.Lett., 74, 4369, 1995.
-
7.
B.J.Carr and S.Hawking, Mon. Not. R. Astron. Soc. 168, 399 (1974).
-
8.
E.F.Bunn, A.R.Liddle and M.White, Phys. Rev. D 54, 5917, (1996).
-
9.
A.G.Doroshkevich and E.V.Kotok, Mon. Not. R. Astron. Soc. 246, 10, (1990); A.G.Doroshkevich, R.Fong, S. Gottlö ber and J. Mü kket, Mon. Not. R. Astron. Soc. 284, 663 (1996); A.G.Doroshkevich, et al., Mon. Not. R. Astron. Soc. 284, 1281 (1996); M.Demianski and A.G.Doroshkevich Astrophys. J. submitted (1997).
-
10.
A.G.Polnarev and M.Yu.Khlopov, Phys. Lett. B 97, 383, 1980.
-
11.
A.G.Polnarev and M.Yu.Khlopov, Sov. Astron, 26, 391, 1983.
-
12.
J.M Bardeen, J.R.Bond, N.Kaiser and A.S.Szalay, Astrophys. J., 304, 15, (1986)
-
13.
A.G.Doroshkevich, Astrophysica 6, 320, (1970).
-
14.
B.A.Trubnikov, Soviet Phys. Doklady 16, 124, (1971).
-
15.
J.Silk and S.D.White, Astrophys. J., 223, L59, (1978).
-
16.
J.Silk and C.Norman, Astrophys. J., 247, 59, (1981).
-
17.
Ya.B.Zeldovich and I.D.Novikov, Doklady Akad. Nauk 155, 1033 (1964). see also J.Baker et al. gr-qc/9608064.