GAS-DRIVEN EVOLUTION OF STELLAR ORBITS
IN BARRED GALAXIES
Abstract
We carry out a detailed orbit analysis of gravitational potentials selected at different times from an evolving self-consistent model galaxy consisting of a two-component disk (starsgas) and a live halo. The results are compared with a pure stellar model, subject to nearly identical initial conditions, which are chosen as to make the models develop a large scale stellar bar. The bars are also subject to hose-pipe (buckling) instability which modifies the vertical structure of the disk. The diverging morphological evolution of both models is explained in terms of gas radial inflow, the resulting change in the gravitational potential at smaller radii, and the subsequent modification of the main families of orbits, both in and out of the disk plane.
We find that dynamical instabilities become milder in the presence of the gas component, and that the stability of planar and 3D stellar orbits is strongly affected by the related changes in the potential — both are destabilized with the gas accumulation at the center. This is reflected in the overall lower amplitude of the bar mode and in the substantial weakening of the bar, which appears to be a gradual process. The vertical buckling of the bar is much less pronounced and the characteristic peanut shape of the galactic bulge almost disappears when there is a substantial gas inflow towards the center. Milder instability results in a smaller bulge whose basic parameters are in agreement with observations. We also find that the overall evolution in the model with a gas component is accelerated due to the larger central mass concentration and resulting decrease in the characteristic dynamical time.
keywords:
galaxies: active — galaxies: evolution — galaxies: kinematics and dynamics — galaxies: starburst — galaxies: structure1 INTRODUCTION
Our understanding of dynamics in disk galaxies is hampered by the prevalence of non-axisymmetric features there, most notably stellar bars. Formation and evolution of barred disks appears to be a formidable problem whose solution continues to elude us (e.g., Lynden-Bell 1996). Galactic structure and stability are traditionally studied in terms of dominant stellar orbits (Sellwood & Wilkinson 1993, and refs. therein). Recently, it became clear that major families of stellar orbits are profoundly influenced by dynamical and secular effects in the galactic disks, the latter on timescales shorter than the Hubble time. This evolution is driven in part by dynamical instabilities in the stellar component, such as the bar instability in the disk plane (e.g., Ostriker & Peebles 1973) and the bending instability out of the equatorial plane (Toomre 1966; Combes et al. 1990; Pfenniger & Friedli 1991; Raha et al. 1991; etc.). The importance of the three-dimensional nature of the stellar bars for the formation of exponential disks and galactic bulges is now recognized (e.g., Pfenniger 1984; Pfenniger & Friedli 1991; and others).
An additional driver of orbital evolution is the disk gaseous component whose mass, although small compared to the overall galactic mass, can nevertheless exert dynamical effects on stars and substantially modify galactic morphology. First, the cold interstellar medium (ISM) is clumpy, with the mass spectrum weighted towards the higher masses, and with the high-mass cutoff around [1985]. Such inhomogeneities efficiently and randomly scatter stars residing on periodic and semi-periodic orbits, resulting in overall disk heating, and may even impede the bar instability, reducing the overall phase space available to these orbits [1993].
Second, the ability of the gas to dissipate its rotational energy is expected to lead to a radial redistribution of the ISM in the disk. Within the corotation, the gas flow is directed inwards as the gas loses its angular momentum support dynamically, through gravitational torques and large scale shocks in the bar, or secularly, in the spiral arms. Gas inflow to the center can result in a substantial change in the galactic gravitational potential at small radii and is likely to be accompanied by star formation and formation/fueling of an active galactic nucleus [1989]. The 2D and 3D orbit analysis in static or partially static potentials has shown that growing central mass concentrations, like compact bulges, nuclear star clusters, or supermassive black holes, all tend to destroy the main family of periodic orbits aligned with and supporting the stellar bar (Hasan & Norman 1990; Hasan, Pfenniger & Norman 1993; Norman, Sellwood & Hasan 1996). This leads to a subsequent weakening of the bar, and ultimately to its ‘quick’ dissolution. The same trend but with clear differences was found when a massive nuclear molecular ring is present in a starburst galaxy, preferentially destroying stable orbits between the inner Lindblad resonance(s) (ILRs) and the corotation [1996].
In this work we take the next logical step by performing a 2D and 3D orbit analysis at selected times of an evolving and fully self-consistent galactic potential generated by a disk embedded in a live halo. We provide a comparison between pure stellar and two-component starsgas models using nearly identical initial conditions, so that the different evolutionary paths can be attributed to the presence of the dissipative gaseous component. The model axisymmetric galactic disk is chosen as to experience both bar and bending instabilities. We aim at understanding to what degree the gaseous component affects these instabilities and modifies the main families of orbits both in and out of the equatorial plane. By doing so, we follow in the footsteps of Sparke & Sellwood [1987] and Pfenniger & Friedli [1991], whom analyzed the stellar orbits of self-consistent time-dependent 2D and 3D potentials, of pure stellar disks. The main modification introduced in the present work is the addition of a dissipative gravitating component in the disk and a responsive ‘live’ halo.
Section 2 describes the numerical algorithm used to evolve the multicomponent galaxy model. The model initial conditions are given in section 3, and section 4 deals with the evolution. The orbit analyses for the pure stellar and starsgas models are given in Section 5. The main results are discussed in Sections 6 and 7.
2 METHOD
The method consists of an N-body algorithm to evolve the collisionless component, representing the stars and dark matter, combined with a smoothed particle hydrodynamics (SPH) algorithm to evolve the dissipative component, representing the gas (e.g., review by Monaghan 1992).
In SPH, as in grid-based codes, the continuous physical fields (e.g. density and velocity) are approximated by a set of points and smoothed quantities are obtained by averaging over finite volumes. However, in SPH these interpolating points move with the mean fluid velocity and the averages are computed using a kernel weighting function.
The algorithm, employs such features as, a spatially varying smoothing length, a hierarchy of time bins to approximate individual particle timesteps, a viscosity “switch” to reduce the effects of viscous shear, and the special purpose GRAPE-3Af hardware to compute the gravitational forces and the neighbor interaction lists (Sugimoto et al. 1990; Steinmetz 1996). Further details and tests of this algorithm can be found in Heller [1995] and Heller & Shlosman [1994].
For the orbit analysis we use the algorithm described in Heller & Shlosman [1996]. The potential is prepared by evaluating it on a rectangular three-dimensional grid, from the particle model using the GRAPE hardware. The grid spacing is adjusted with position in order to give an appropriately smooth field without losing relevant features, such as the bar, gas ring and inner disk. The potential is then symmetrised with eight-fold symmetry.
The potential and its derivative are evaluated using the B3VAL routine from the CMLIB package. This routine determines and evaluates a a piecewise polynomial function represented as a tensor product of one-dimensional B-splines. We have checked the suitability of this technique for our application in several ways, including comparing the mass density, as evaluated from Poisson’s equation, to the density determined directly from the particle model. The computations were carried out on local workstations and a CrayT3D in Berlin.
3 MODEL
The initial density distribution for both the pure stellar model (A) and the stellar+gas model (B) are derived from the Fall & Efstathiou [1980] disk-halo analytic model which consists of an exponential disk and spherical halo. We adopt units for mass, distance, and time of, respectively, , kpc, and yr. The initial conditions are such that within one unit of distance (10 kpc) both the total mass and the ratio of disk-to-halo mass are unity. This makes the initial period of rotation at 10 kpc to be . The radial and vertical exponential scale heights in the disk are 2.85 kpc and 0.2 kpc, respectively, and the rotational velocity turnover radius is kpc. The halo is initially populated with 30K collisionless particles within a radius of 30 kpc, while the disk has 100K particles within 25 kpc. A gravitational softening length of 0.16 kpc is used for all particles.
To check the degree to which the more massive halo particles may heat the stellar disk, a model with the softening length reduced by a factor of two was also constructed. The evolution of the two models were essentially identical and we therefore conclude that two-body heating of the disk by the halo is not significant.
For model B, some 10K collisionless disk particles are replaced with collisional SPH particles with a vertical scale height of 0.15 kpc, representing 8% of the global mass within 10 kpc. Also a central object is added which absorbs all particles within a radius of 40 pc and its mass grows at their expense. An isothermal equation of state with a temperature of K is used for the gas.
This distribution is not in an exact virial equilibrium and the halo must be allowed to relax from its initially spherical shape. Details of this process along with the assigning of velocities and a description of the resulting density and velocity profiles can be found in Shlosman & Noguchi [1993] and Heller & Shlosman [1994].
4 MORPHOLOGICAL EVOLUTION
The model was constructed so as to be globally unstable to non-axisymmetric perturbations and form a large-scale bar in a few . The bar itself is subject to bending instability which changes the vertical structure of the stellar disk on a dynamical timescale. In this section we look at how the presence of gas changes the character of these instabilities, along with the overall secular evolution of the model galaxy. This evolution is shown in Figures 1 and 2, and examples of dominant orbits appear in Fig. 3.
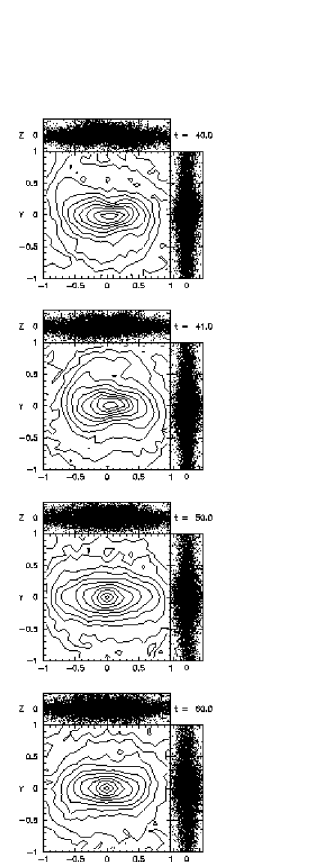

4.1 Model Without Gas
For the purely collisionless model A, the bar forms and then reaches maximum strength at about or . At this time the bar extends out to about 8 kpc with axis ratios of approximately (x:y:z) 1.0:0.3:0.13, as estimated by eye from the density isophotes. From the ends of the bar a trailing spiral emerges, which reaches a maximum radius of some 14 kpc at an azimuth perpendicular to the bar major axis. These arms dissolve slowly and have completely disappeared by or after some 8 bar rotations. The pattern speed of the bar also decreases during this interval, from a maximum of at a time shortly before bar maximum strength (), to at . This decline is most rapid during the time the bending instability is operating and then slows to a steady rate of about , implying a slowdown timescale greater than a Hubble time. No radial ILRs exist in this model at any time as the orbit analysis of section 5.1 shows, although linear analysis claims (erroneously, due to the bar strength) a double ILR in the disk plane. Both linear and orbit analyses confirm the existence of a single vertical ILR.
Immediately following maximum strength, the bar begins to weaken and at around a vertical buckling becomes visibly discernible as the bar has lost its symmetry with respect to the equatorial plane. The amplitude of this vertical asymmetry in the bar grows considerably, until at the bar takes on a boxy appearance. The peanut shape of disk viewed along the bar’s minor axis is clearly visible during this instability, while the bar appears round when seen along its major axis. After about the bar remains stable and any evolution it is undergoing is taking place on a much longer timescale. While the bar length has not changed appreciably during the evolution, the axis ratios have become 1.0:0.6:0.18, indicating both the weakening of the bar in the plane and the vertical thickening.
Analysis of the vertical distribution of the stellar disk during the evolution shows that the bending instability leaves behind a ring of enhanced vertical scale height. Before the instability the stellar disk scale height is at a minimum at the disk center and increases outward as the disk flares. Following the instability the scale height over the entire disk has increased, but particularly so along a circular shaped ridge at a radius of approximately 3–4 kpc.
We have examined the disk and bulge radial scale lengths of the model by fitting to the stellar surface density the function
| (1) |
The shape parameter, , for the bulge component corresponds to a pure exponential profile for and a deVaucouleurs profile for . Initially, at , the distribution is a pure exponential with kpc, while at both components are required for an adequate fit, as confirmed by an F-test. The parameter values at are kpc, kpc, , and . In the vs. plane these values are on the outer edge of the observed distribution, albeit not strictly incompatible given the large amount of observational scatter [1995]. Fixing we find a bulge-to-disk ratio which is about two-sigma above the mean (Courteau et al. 1996; Courteau 1997).
We have also investigated the angular momentum loss of the inner disk to the outer disk and the halo. We find that the disk within corotation loses, by , about 40% of its initial angular momentum, with 70% of this going to the disk outside of corotation and the remaining 30% to the halo, with the outer halo gaining about twice as much angular momentum as the inner halo. The loss of angular momentum from the inner disk occurs fairly secularly, except for a burst of angular momentum transfer to the outer disk during the epoch of bar formation (14–20).
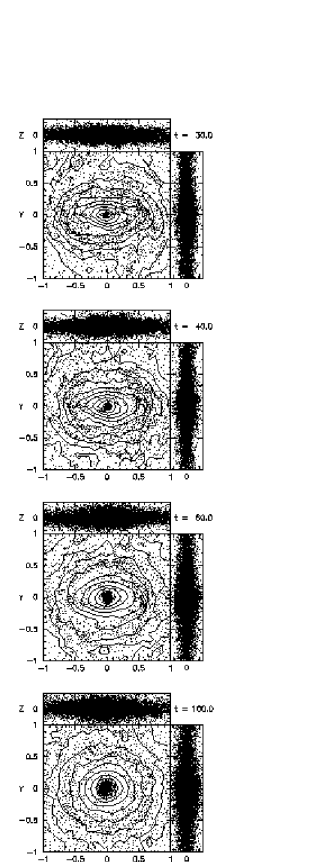
4.2 Model With Gas
In model B, which includes gas, the bar reaches maximum strength at about the same time () as the purely collisionless model A. At this time the stellar distributions are nearly identical in the two models, while the gas in model B has formed a strong shock along the bar, offset in the leading direction and curving inward near the center. This gas morphology is indicative of the presence of an ILR [1992], as is confirmed by our orbit analysis.
Even at this early time there has been a substantial inflow of gas, with some 40% of the gas that was initially within 10 kpc, now residing within a radius of 1 kpc. This gas represents some 23% of the dynamical mass within the inner kiloparsec. In fact about 80% of this gas mass has gone to the inner few hundred parsecs and resides in the central accreting object, which contains at this time about 1.6% of the total galactic mass within 10 kpc. Following this large burst of mass accretion by the central object, it continues to grow linearly over time, reaching by the end of the run, at , or 2.2% of the global mass inside 10 kpc. This corresponds to a gas density increase by a factor of within the central kiloparsec.
As before, the stellar arms slowly dissolve until they are not visibly discernible after about . However, large spiral features in the gas persist throughout the run. The pattern speed of the bar decreases during this interval from a maximum of (at ) to a minimum of at around , after which it remains constant or possibly is even very slowly increasing, in agreement with previous work (Heller & Shlosman 1993, unpublished).
By the gas circular velocities have developed a sharp discontinuity in the slope at about 1 kpc from the center. The gas rotation increases up to this radius and thereafter remains approximately flat throughout the bar region. The central 300 pc are dominated by a growing oval gas disk, whose major axis leads the stellar bar by . The gas, in fact, is accumulating close to the inner ILR (as the orbit analysis of section 5 confirms). Outside this disk is a noticeable deficiency of gas in the bar, up to the radius of a forming oval ring of gas which surrounds the stellar bar at about the position of the Ultra-Harmonic Resonance (UHR). Model A has the rectangular outer isophotes (Fig. 1) characteristic of a strong UHR, while in model B they are somewhat weaker (Fig. 2). The inner gas disk and the UHR gaseous ring remain throughout the run, connected by thin trailing gas spiral shocks, offset from the stellar bar in the leading direction. The inner gas disk continues to grow in size, being fed through the shocks and reaching a radius of approximately 1.2 kpc by . We note that a similar gas morphology was obtained in the numerical modeling of NGC 4321 by Knapen et al. [1995].
Similar to Model A, the bar begins to weaken after reaching maximum strength, but in this case it continues to do so, linearly with time until the end of the run. A vertical bending of the stellar disk also occurs, but earlier, near the time of maximum bar strength. The bending is not as dramatic as before, and in fact is difficult to detect from a visual inspection of the stellar distribution. The jump in vertical scale heights at the time of the instability is also neither quite so abrupt or substantial. The gas acts to weaken the instability. The ridge-like feature that was seen in the purely collisionless model following the instability is also present here but at a slightly smaller radius (2–3 kpc).
The bulge/disk parameters, as given by a fit of the model to equation (1), are at : kpc, kpc, , , and at : kpc, kpc, , . Using these scale lengths and integrating out to we find at a bulge-to-disk mass of . These values fit well with the observed vs. relationship. Hence in relation to model A, the presence of the gas has moved the values in the direction towards better compliance with the observed distribution. Also, the values of are a factor of two or more greater than that of model A, consistent with an evolution in the direction of earlier spiral-type [1997]. Fixing we find , which is lower than that found for model A, but still somewhat on the high end of the observed distribution [1996].
The angular momentum loss of the inner disk, by is some 10% less than that of model A, though the percentages absorbed by the halo and outer disk are roughly equivalent. In spite of the large inflow of gas, the overall behavior of the angular momentum redistribution during the evolution is quite similar to that of the purely collisionless model.
5 ORBITAL EVOLUTION
In this section we examine the evolution of the orbits in the models. General information on orbits in barred galaxies can be found in Binney & Temaine [1987] and Sellwood & Wilkinson [1993]. We do so by locating the periodic orbits, i.e. orbits which make a closed figure in a frame of reference that rotates with the bar, in the frozen potential at a given time. For simplicity, we restrict ourselves to only the lowest order periodic orbits in the symmetrised potential within the corotation radius. We compare both the planar and 3D orbits, from each model at two different times. The first time was chosen to be when the bar is near maximum strength, but before the onset of the bending instability, the second after the instability, at a time when the evolution has reached a quasi-static state.
We start by searching for simple 1-periodic orbits in the plane (), that is planar orbits which are bi-symmetric with respect to the bar and close after one orbit around the center in the rotating frame of reference. The stability of these orbits is computed and orbits which bifurcate in and from vertically unstable regions are then located. The results are displayed in terms of a characteristic diagram, where the orbits are plotted with respect to their Jacobi Integral, , and either the , , or intercept value with the plane. The Jacobi Integral (or Energy) is a conserved quantity along any given orbit in the rotating frame, and can be thought of as an effective energy. In the characteristic diagrams the orbits form curves or families. It is the study of these families, their properties and how these change during the evolution of the models, that concerns us in this section.
A number of different notations to designate the orbital families have been used in the literature. Unfortunately all have some drawback, either in terms of being limited in the types of orbits covered or in being unfamiliar to most readers. We adopt here a mixed approach. For the planar orbits we will take the widely used notation of Contopoulos & Papayannopoulos [1980], while for the more common 3D orbits the Geneva system will be used. For the few 3D orbits described here which do not have a Geneva designation the notation of Sellwood & Wilkinson [1993] is used. The correspondences between the systems will also be noted.
5.1 Model Without Gas
5.1.1 Periodic Orbits at
The characteristic diagram for the planar orbits of Model A at is shown in Figure 4a.


The dashed curve denoted by the symbol ZVC is the zero velocity curve, which delineates the accessible region in the plane based on energy considerations. Stable sections of the characteristics are represented with a solid line, while unstable sections are broken. The two main families have been labeled according to the notation of Contopoulos & Papayannopoulos [1980]. The corotation radius is at or approximately 9.2 kpc, as defined by the location of the Lagrange point in the orbit model potential.
The family labeled are the orbits that predominately give the bar its structure. They are elongated along the bar and orbit in the same sense as the bar (direct). In the rotating reference frame of the bar they move in and out, twice for once around the center (2/1). At this time, as one follows the characteristic from the center out to higher energies, the orbits become more and more pointy, until at around they develop small loops along the bar axis. As the orbits grow in size, so do the loops, until a little before the turn-up in the characteristic, they shrink and disappear. At this point, the orbits extend to about 8 kpc along the bar and have an axis ratio of 1:4. Past the bend at , the orbits continue to grow in size and become ever increasingly more rounded. Some examples of these orbits are shown in Figure 3.
Bifurcating from the sequence near the bend is a bubble consisting of orbits which transition from 2/1 to 3/1 to 4/1 as one moves along it to higher energies. A similar bubble was found by Pfenniger [1984], except here most of the orbits have loops and the extreme 4/1 orbits have a more pronounced diamond shaped. There is also a detached loop of 2/1 direct orbits under the sequence from to , which covers a range of semi-major axes from 4.2 to 5.5 kpc. The orbits on the upper part of this loop are quite pointy, while those along the bottom have more rounded ends. The two sections at either end of the upper segment are horizontally unstable.
Also in Figure 4a is present the family labeled . These are 2/1 orbits as well, but move in a retrograde direction and are slightly elongated perpendicular to the bar. The characteristic is stable along most of the length shown in the figure, except for a few regions at lower energies where it is horizontally unstable. This family can play only a minor role at this early time, since a significant population of retrograde orbits would stabilize the disk against the formation of a bar (e.g., Kalnajs 1977; Zhang & Hohl 1978; Christodoulou, Shlosman & Tohline 1995).
Bifurcating from a vertically unstable section of the characteristic are two 3D orbit families. One family bifurcates in from the low energy edge of the strip at , the other in from the high energy side at . These orbits make two radial oscillations in the plane and four vertical oscillations in as the orbit closes one rotation about the center. The two families form a pair, with the bifurcations in and being, respectively, symmetric and anti-symmetric about the plane. Using the notation of Sellwood & Wilkinson [1993], these orbits are given as , with an ‘s’ or ‘a’ subscript added to indicate the sense of symmetry. These orbits have the same shape, in projection onto the plane, as the orbit of the same energy, including the loops. The symmetric family is stable near the bifurcation point, where they have semi-major axes of 4 kpc, but become unstable over much of the rest of the characteristic. The anti-symmetric family is also unstable over most of its characteristic, except for a section between to . The maximum extent of the stable orbits of these two families is less than 300 pc.
There also exists a pair of families apparently bifurcating from the origin. However, one should keep in mind that the gravity has been softened at the center. Both the symmetric and anti-symmetric family stay very close to the zero velocity curve until the orbits extend some 0.5 kpc above the disk plane, then move away, following an abrupt turn-down in their characteristics. The symmetric family is mostly unstable, except for a section following the turn-down. The anti-symmetric family is stable before the turn-down and mostly unstable following it.
It should be noted that no orbits or symmetric family corresponding to planar and vertical ILR respectively, are present at this time.
5.1.2 Periodic Orbits at
Figure 4d shows the same model at . At this later time, the potential has deepened due to the mass redistribution in the system following bar and buckling instabilities. The corotation radius has moved slightly out to or about 11.5 kpc. Because the bar has weakened, the planar characteristics are simpler than before, with the absence of the bubbles and detached loops. The orbits are stable from the center out to , where a vertical instability strip begins. At this point the orbits extend to about 3 kpc along the bar, with an axis ratio of 1:6. At the orbits once more become stable and remain so up to near where the characteristic turns upward toward the zero velocity curve. The orbits along this section do become slightly more pointy before starting to fatten into a more oval shape, but never develop loops. The steep section of the characteristic, past the turnup, has several sections of varying stability. Because these bifurcation points are near the increasingly chaotic region of the corotation, we have made no attempt to further explore them. No orbits have been detected, hence no radial ILR(s) exist.
The characteristic is also shown and is stable along the entire length displayed, except for a period-doubling horizontal bifurcation near .
From the vertically unstable strip on , bifurcate two families of orbits: a symmetric family (BAN) in at and an anti-symmetric family (ABAN) in at . The symmetric family is unstable near its bifurcation point, but becomes stable following a bend in the characteristic, and remains so along most of the curve shown in the diagram up to kpc. In contrast the anti-symmetric family is unstable over most of the characteristic shown, becoming stable only for . The symmetric family bifurcating from at the instability strip are characteristic of a vertical ILR (Pfenniger 1984; Friedli & Pfenniger 1991).
5.2 Model With Gas
5.2.1 Periodic Orbits at
While the bending instability is operating, the disk is highly asymmetrical in the vertical direction. The interpretation of the 3D orbit families, computed from the symmetrized potential at such a time would be highly ambiguous. Since the onset of the bending instability occurs earlier for the model with gas, slightly before the time of maximum bar strength, we are required to perform the orbit analysis at an earlier time than for model A. Nonetheless, in the following section we will examine some of the more robust planar features of this model at full bar strength () as well.
For the full analysis we chose the time , at which the bar is at about 80% of its maximum strength and before the onset of the large gas inflow rate. The characteristic diagram for model B at is shown in Figure 5a. At this time the corotation radius is at or about 7.2 kpc.
The orbits between and , or semi-major axes between 1-2 kpc are pinched perpendicular to the bar into a pickle-like shape. An example of such an orbit is shown in the panel labeled B16 of Figure 3. At this time, the orbits do not become pointy or develop loops. Similar to model A at , there is a bubble of 2-3-4/1 orbits bifurcating from the sequence near the bend. Here however, the orbits cover a larger range of energy and there exists an additional smaller bubble enclosed within the larger. No detached loop of 2/1 orbits and no orbits were found.
Along the sequence there are several regions of instability. Three are horizontally unstable sections from to , to , and covering the bend from to . There are also two short vertically unstable sections near the center. Bifurcating from the plane near are a pair of orbit families. Similar to model A, these families at first stay very close to the zero velocity curve. The symmetric family is stable near the bifurcation point, but then alternates a few times between stable and unstable sections, while the anti-symmetric family is almost everywhere unstable. Also from near the center, at , bifurcate a pair of families. The symmetric family is unstable over most of its characteristic, including near the bifurcation point, and has a complex unstable section following the sharp turn-up at . The anti-symmetric family is stable from it bifurcation point to , after which it remains unstable.
5.2.2 Periodic Orbits at
For comparison with the planar orbits of model A, we have also performed an orbit analysis of model B at , the time at which the bar has reached maximum strength. The characteristic diagram is shown in Figure 6.

At this time the corotation radius is at or about 8.2 kpc, somewhat smaller than the purely collisionless model A. Similar to model A, loops are present in the orbits at this time, as is a bubble of 3/1 orbits. However, in contrast to model A, a family of orbits already exists. The gas inflow and the deepening of the central potential are responsible for their appearance.
The family, like , are also direct 2/1 orbits, but elongated perpendicular to the bar. Their presence is indicative of an ILR(s) in the nonlinear regime. The characteristic covers a range in energy from to , along which the orbits extend perpendicular to the bar from 0.18 kpc to 0.92 kpc, with axis ratios of 1:2 and 1:3, respectively.
5.2.3 Periodic Orbits at
By time the potential well of model B has greatly deepened, a reflection of the steady accumulation of gas in the nuclear disk. The corotation radius has moved outward, though not as much as in model A, to or 9.2 kpc. Unlike model A, the family, once having obtained loops, has retained them throughout the remaining evolution. Compared to the earlier time the loops are now longer, though less fat. The sections of instability have grown considerably during the evolution and at this time the orbits are mostly unstable, except in the inner regions.
The 4/1 bifurcation from the family (UHR) occurs at , at a point where the orbits have an extent along the bar of around kpc and an eccentricity of . This corresponds to the approximate location of the outer edge of the gas ring described in section 4.2. Most of the 4/1 orbits are either unstable or have loops and the gas appears to have accumulated on orbits with ’s just below the 4/1 gap. If we take to be indicative of the maximum possible bar length, then the value of . This value is within the limits of the empirical range given by Athanassoula [1992].
The extent of the family has greatly increased from and now covers a range of energy from essentially the minimum to , with an axis ratio of around 1:3. The family is stable along its entire length.
The family also has two sections of vertical instability before the sharp bend upwards at around . The first has it’s two ends at and connected by a loop of stable symmetrical orbits (BAN), which bifurcate from the plane in . These orbits are stable everywhere, span a range along the bar major axis of 0.06–1.1 kpc, have a maximum vertical extent of about 100 pc, and have loops in projection onto the plane.
From the second strip also bifurcate a pair of families. The symmetric family, which bifurcates in at , is unstable between its bifurcation point and , then alternates three times between stable and complex unstable sections until , after which it remains predominantly unstable, unlike in model A. The anti-symmetric family, which bifurcates in at , is unstable between its bifurcation point and , after which it becomes stable.
The family has two sections of vertical instability. The one at lower energy has its two ends at and , connected by a stable vertical family of symmetric orbits that bifurcate from the plane in , and which are inclined to the y-axis (). These orbits have radii between 1.1-1.5 kpc. From the higher energy strip also bifurcate a pair of families. The symmetric family, which bifurcates in at , is everywhere unstable except for two small sections. Similar to the loop, these orbits are inclined to the y-axis. This family has been followed to near the center, well within the softened inner region, and is consistent with the family having bifurcated from the origin.
5.2.4 Surface of Sections at
Most orbits in a galactic-like potential are not periodic. However, the periodic orbits play an important role, in that they trap regions of phase space about them. These trapped regions are referred to as regular regions and the orbits which reside in them are called regular orbits. The motions of these orbits are confined to a two dimensional surface referred to as an invariant tori and which surround the parent periodic orbit. Orbits which are not trapped are called irregular. Unlike the regular orbits, they are not restricted to a sub-surface and may wander throughout the non-regular regions of phase space, at least within energy considerations.
To determine the extent of phase space trapping about the stable periodic orbits, we shall examine the surface of sections (SOS). These diagrams have been constructed by integrating orbits of a given in the unsymmetrised potential, and marking a point in the plane each time it crosses the line with (e.g., Binney & Temaine 1987). An example of such diagrams for a barred potential can be seen in the top left panels of Figures 7 (Model A) and 8 (Model B), for and , respectively.
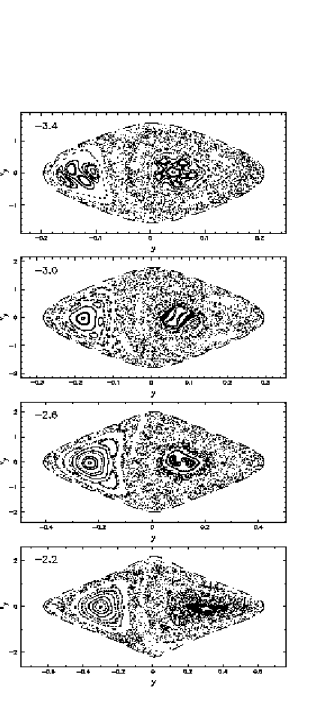
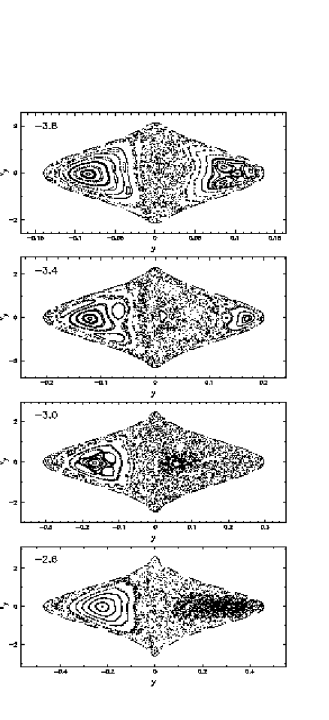
The regular orbits in these diagrams form the closed curves which surround the fixed points of the parent periodic orbits at the centers. These curves are referred to as invariant curves and are a cross section of the invariant tori. The left side of each diagram, with , represents retrograde orbits, while the right side, with , represents the direct or prograde orbits. For the above diagram frames chosen as examples, there are two regular regions in Fig. 7, which from left-to-right, are associated with the and orbital families. In Fig. 8, there are three regular regions, which from left-to-right, are associated with the , , and orbital families.
Figure 7 shows that the regular regions of the phase space in the model A are dominated by the family which dissolves at around . In contrast, Figure 8 shows that most of the regular regions of phase space in model B are dominated by the and families. At lower energies, where the family occupies a non-negligible fraction of the available phase space, the fixed point for the family is at , indicating that these orbits are inclined at an angle oblique to the bar major-axis in a trailing direction. The general trend of the offset angle is of increasing value as the center of the potential is approached. As one moves out in energy, the fraction of phase space which is regular decreases, with the family disappearing by . At higher energies, as the corotation radius is approached, the stochastic regions continue to expand ( and ), with the family completely dissolving by about . The regular retrograde orbits continue to fill up most of the available phase space for , so stochastic orbits are not as important here. No significant support for the bar, in terms of regular orbits, appears to exist at this time.
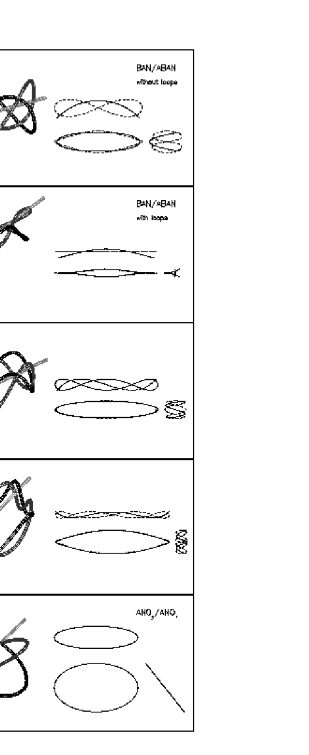
A picture library of two and three dimensional periodic orbits that were found in these models is given in Figures 3 and 9.
6 DISCUSSION
The diverging evolution of both models, which started with nearly identical initial conditions, can be attributed solely to the gravitational effects of gas redistribution in the galactic plane. We analyze two snapshots of the model potentials, the first one at an early time corresponding to the maximal strength of the non-axisymmetric bar potential, , and the second one at a time when dynamical evolution of the models has slowed down substantially, . Although the models differ already at , because a nonnegligible fraction of the gas already found its way to the center, these differences become much more pronounced at the advanced stages of evolution.
6.1 Morphological Differences
After ten rotations, the morphological differences in the bar region of both models are clearly visible. Even earlier, such dynamical parameters as the bar strength (defined by its axis ratios), rotation curves and density profiles show growing differences delineating dissimilar underlying dynamics. This is evident in the development of the two major instabilities in these models, the bar instability and the subsequent bending instability. The general trend is that the presence of the self-gravitating gas component in the disk makes both instabilities substantially milder, in line with our previous results.
In general, the evolution is accelerated in the B model compared to A, even before the bar reaches its maximal strength (which happens simultaneously in both models). The bar pattern speed in B is substantially higher than in A after approximately one rotation and this difference increases with time. We note also that the pattern speeds of the stellar bars show different behavior after the initial quick decline — due to the continuous gas inflow to the center, the bar in model B slowly increases its speed, in contrast to that of the bar in model A which continues its secular slowdown because of the interaction with the halo and the outer disk. An additional signature of the accelerated evolution of model B is the early onset of the bending instability and the sudden increase in the vertical scaleheight in the inner few kpc of the disk.
The central potential of model B substantially deepens due to the gas inflow, resulting in the formation of the family of orbits which delineate the radial ILR. Fig. 5 shows that the inner resonance region is very broad and extends almost from the center (i.e., from IILR), to 3 kpc in radius (OILR), which encompasses the minor axis of the bar. The inner orbits in the vicinity of the IILR are heavily populated with gas. The stellar bar weakens as the anti-aligned orbits become more important. At the peak of its strength the mode amplitude is larger by % in model A, and the difference grows by a factor of two by . Towards the end of the simulation, at , the B model bar almost ceases to exist, having weakened by a factor of ten.
We note, that the gravitational potential is sufficiently softened at the position of the IILR and so the dynamical effects of this resonance are eliminated. This result contrasts the modeling of inner disk in M100 by Knapen et al. [1995]. In the latter work, the spacing between the ILRs is much smaller and the position of the IILR is further away from the center, leading to the formation of a nuclear ring just outside the IILR. Both numerical simulations, the one presented here and by Knapen et al., underline two main alternatives in the evolution of gas distribution in the circumnuclear regions of disk galaxies. Further work is required to understand the effects of the IILR on the galactic morphology.
Another important morphological difference between models A and B can be found in the properties of the central bulge which forms as a result of vertical buckling in the stellar bar. In particular, the gas model gives a bulge-to-disk ratio and bulge shape value, as defined by eq.(1), that is more consistent with the observed distribution. Moreover, as the gas falls toward the center, the change in value of the bulge shape parameter, is consistent with an evolution toward an earlier morphological type.
6.2 Dynamical Differences
The morphological differences between the models is a result of more fundamental differences in the orbital dynamics, in particular, from a change in the relative importance of various orbital families in the overall phase space available to the system. First, as the SOSs show (Fig. 8), model B at has a larger fraction of the phase space populated by chaotic orbits. This comes at the expense of the orbits, which are always the most important orbits supporting the bar. The family itself becomes largely unstable (Fig. 5d), and although remains present everywhere inside the CR, it occupies only a small fraction of the phase space and is unable to trap substantial numbers of regular orbits. Hence, at these late times the family is dynamically unimportant. Such a behavior was also observed by Hasan, Pfenniger & Norman [1993] using an analytical potential with various degrees of central concentration.
Surface of sections of the unsymmetrized potential of model B have shown the presence of the innermost oblique orbits during the later times of its evolution and which dominate the phase space at the lowest energies (Fig. 8). These orbits trail the major axis of the stellar bar and are mostly perpendicular to the major axis of the gaseous nuclear disk which leads the stellar bar by about . They do not contribute to the support of the bar. The origin of this anomalous oblique family of orbits is explained by the fact that at these low energies (and small distances from the center), the non-axisymmetric gravitational potential of the large-scale bar is barely felt, and the Laplace plane of the potential is instead controlled by the nuclear disk.
We also observe that most of the orbits in model B posses loops or appear “pointed” within the 5 kpc region of the stellar bar, while orbits in model A are round everywhere. This implies grave consequences for the gas dynamics. Because intersecting orbits can not support a steady state gas flow, the gas loses energy and angular momentum, and moves inwards (as indeed is observed in this model).
By changing the mass distribution in the galactic plane, the gas also affects the vertical structure of the disk by creating vertically unstable gaps in the planar (2D) orbits as well as by destabilizing the 3D families bifurcating from the plane, as discussed in section 5. The symmetric (BAN) and antisymmetric (ABAN) families of orbits have the largest extensions away from the disk plane and appear to dominate the phase space (Figs. 4 and 5). As Pfenniger & Friedli [1991] found, these families of 3D orbits bifurcate at the vertical resonance gap in the plane. The vertical ILR is typically found in the neighborhood of the radial ILR (Hasan et al. 1993). In our case this is true for model B, which has the outer ILR at a distance of about 3 kpc from the center at . Model A has a vertical ILR in approximately the same place, but lacks the planar ILRs. No vertical ILRs are present during the early stages of the evolution.
6.2.1 3D Orbits
The orbit analysis reveals that there exists a substantial difference between the models in the stability of BAN orbits and in their extension above the plane and into the halo. Both BAN and ABAN appear with the bending instability and both are present in the models at (Figs. 4/5e,f). The bifurcation points of these families moved inward during the evolution of model B, especially that of the BAN orbits. The BAN in model A, however, are stable up to approximately 2 kpc above the disk, while in the presence of the gas (model B) they are destabilized above pc. The ABAN are unstable to large distances above the disk plane. The fact that in model B the stability region of these families shrinks and is limited to a narrow layer above the disk plane, is important if these families are related directly to the bending instability and the formation of the peanut shape bar profile (Pfenniger & Friedli 1991; Sellwood & Wilkinson 1993). This means that the vertical bending in the bar will be (at least partially) damped in the presence of the gas and explains why the bending is substantially milder and reaches a smaller amplitude in the B model as compared to A (Figs. 1 and 2). The breaking of the z-symmetry of the bar, clearly observed in Fig. 1 at , temporarily eliminates the planar and populates the BAN orbits, giving the bar its characteristic peanut shape in model A. This effect is partially suppressed in the B model, both because the z-symmetry is maintained to a higher degree, as seen in Fig. 2, and because the BAN orbits are largely unstable (except in the immediate vicinity of the disk plane), and so the particles which leave the planar orbits and enter into the halo are populating chaotic orbits. The peanut shape is barely observed in this case.
7 CONCLUSIONS
We have compared the diverging evolution of a two-component (gasstars) galactic disk embedded in a live halo with that of an nearly identical pure stellar disk. The models have been chosen to be bar unstable and developed a large-scale stellar bar in a few dynamical times, which in turn experienced vertical buckling. The resulting non-axisymmetric potential has led to the loss of angular momentum by the gas and its redistribution towards the center, along with a modification of the gravitational potential there. In the early stages of the evolution no linear or nonlinear resonances are present in the inner disk.
We confirm that the radial gas inflow leads to the formation of the OILR resonance inside the bar. The IILR appears very close to the center and its dynamical effect is limited by the gravitational softening. The single vertical resonance, however, forms in both models with the growth of the bar mode. The existence of these resonances was inferred from the orbits analysis and is related directly to the appearance of particular 2D and 3D families of orbits. The bar is weakened by a lack of orbits supporting it. In the plane, the region inside the OILR is mostly dominated by the orbits which are elongated perpendicular to the bar, while the orbits which are only found in the central regions are at oblique angles to the bar. This model does not lead to the formation of gaseous nuclear ring and provides an interesting alternative to the evolution of gas distribution in the circumnuclear regions of disk galaxies when the IILR is too close to the center.
We find that the bar mode amplitude is substantially lower in the presence of the gas at all times, and the amplitude decays steadily by a factor of 2 on a time scale of yrs, or rotations. We also find that the buckling instability which helps to populate the 3D orbits due to the temporary breaking of the z-symmetry in the disk, has a smaller amplitude in the presence of the gas. In particular, the characteristic peanut-shape of the inner bar is greatly weakened and ‘washed-out’ due to destabilization of the 3D orbits in the more centrally concentrated model containing gas. The orbit analysis shows that the increased stability of the galactic disk should be attributed to the larger population of chaotic orbits following the growth of the central mass concentration to about 2% of the galactic mass within 10 kpc. Milder buckling instability of the stellar bar has led to a much smaller galactic bulge in better agreement with observations.
Our modeling supports the conjecture that the growth of central concentration in galaxies dissolves the main family of regular orbits in the stellar bar and assists in the formation of a galactic bulge. Overall, it hints about evolution towards more axisymmetric disks and earlier morphological types. Taken at face value one could expect a lower frequency of stellar bars in SOs, compared to Sc’s. Such a correlation is, however, not supported by optical and near-infrared data. A resolution of this paradox is a matter for future work.
The characteristic time scale for bar dissolution appears to be short in comparison with the Hubble time. Within this framework, it is difficult to understand the large frequency, , of barred galaxies in the Universe. It is far from being clear that galaxy interactions which (not always!) induce short-lived transient bars, resolve this problem.
We conclude that the gas can dramatically alter the underlying stellar dynamics of disk galaxies subjected to dynamical instabilities. The main consequences of radial gas redistribution in the disk is the increase of central mass concentration, and modification and destabilization of the main 2D and 3D periodic orbits. This results in a weaker stellar bar and milder vertical buckling instability. The characteristic peanut shape of the central regions in the bar is practically removed. Overall this hints about a diverging evolution between initially gas-rich and gas-poor barred galaxies.
8 ACKNOWLEDGMENTS
We are grateful to Rainer Spurzem and Christian Theis for providing both time and support on the GRAPE hardware, and the referee, L. Athanassoula, for her valuable comments. The GRAPE 3Af special purpose computer in Kiel was financed under DFG grant Sp 345/5-1, 5-2. C.H. acknowledges support from DFG grant Fr 325/39-1, 39-2. I.S. acknowledges support from NASA grants WKU-522762-98-6 and NAG5-3841.
References
- [1995] Andredakis, Y.C., Peletier, R.F., Balcells, M., 1995, MNRAS, 275, 874
- [1992] Athanassoula E., 1992, MNRAS, 259, 345
- [1987] Binney J., Tremaine S., 1987, Galactic Dynamics. Princeton Univ. Press
- [1995] Christodoulou D.M., Shlosman I., Tohline J.E., 1995, ApJ, 443, 551
- [1990] Combes F., Debbasch D., Pfenniger D., 1990, A&A, 233, 82
- [1980] Contopoulos G., Papayannopoulos Th., 1980, A&A, 92, 33
- [1996] Courteau S., de Jong R.S., Broeils A.H., 1996, ApJ, 457, L73
- [1997] Courteau S., 1997, in Block D., Greenberg M., eds, Morphology and Dust Content in Spiral Galaxies. Kluwer, Dordrecht
- [1980] Fall S.M., Efstathiou G., 1980, MNRAS, 193, 189
- [1990] Hasan H., Norman C.A., 1990, ApJ, 361, 69
- [1993] Hasan H., Pfenniger D., Norman C.A., 1993, ApJ, 409, 91
- [1996] Heller C.H., Shlosman I., 1996, ApJ, 471, 143
- [1995] Heller C.H., 1995, ApJ, 455, 252
- [1994] Heller C.H., Shlosman I., 1994, ApJ, 424, 84
- [1977] Kalnajs A.J., 1977, ApJ, 212, 637
- [1995] Knapen J.H., Beckman J.E., Heller C.H., Shlosman I., de Jong R.S., 1995, ApJ, 454, 623
- [1996] Lynden-Bell D., 1996, in Sandqvist A., Lindblad P.O., eds, Proc. Nobel Symp. 98, Barred Galaxies and Circumnuclear Activity. Springer–Verlag, New York, p. 7
- [1992] Monaghan J.J., 1992, ARA&A, 30, 543
- [1996] Norman C.A., Sellwood J.A., Hasan H., 1996, ApJ, 462, 114
- [1973] Ostriker J.P., Peebles P.J.E., 1973, ApJ, 186, 467
- [1984] Pfenniger D., 1984, A&A, 134, 373
- [1991] Pfenniger D., Friedli D., 1991, A&A, 252, 75
- [1991] Raha N., Sellwood J.A., James R.A., Kahn F.D., 1991, Nat, 352, 411
- [1985] Sanders D.B., Scoville, N.Z., Solomon P.M., 1985, ApJ, 289, 373
- [1993] Sellwood J.A., Wilkinson A., 1993, Rep. Prog. Phys., 56, 173
- [1993] Shlosman I., Noguchi M., 1993, ApJ, 414, 474
- [1989] Shlosman I., Frank J., Begelman M.C., 1989, Nat, 338, 45
- [1987] Sparke L., Sellwood J.A., 1987, MNRAS, 225, 653
- [1996] Steinmetz M., 1996, MNRAS, 278, 1005
- [1990] Sugimoto D., Chikada Y., Makino J., Ito T., Ebisuzaki T., Umemura M., 1990, Nat, 345, 33
- [1966] Toomre A., 1966, Geophys. Fluid Dynamics, notes on the Summer Study Program at the Woods Hole Oceanographic Inst., ref. #66-46, 111
- [1978] Zhang T.A., Hohl F., 1978, ApJ, 226, 521