Very High Redshift Radio Galaxies
Abstract
High redshift radio galaxies (HzRGs) provide unique targets for the study of the formation and evolution of massive galaxies and galaxy clusters at very high redshifts. We discuss how efficient HzRG samples are selected, the evidence for strong morphological evolution at near-infrared wavelengths, and for jet-induced star formation in the HzRG 4C41.17.
1 Introduction
Radio sources are surprisingly effective beacons for identifying galaxies at extremely high redshifts. Optical/near–IR campaigns during the past few years by several groups have resulted in the discovery of more than 120 radio galaxies at , including 17 with , and 3 with . At low redshifts powerful radio galaxies are uniquely identified with massive ellipticals. If this is true also at high redshift, as seems reasonable given the surprisingly good Hubble relation for radio galaxies at , then we should be able to systematically study the evolution of massive elliptical galaxies over large lookback times using samples selected by their radio emission. While recently developed techniques of finding very distant star–forming galaxies (e.g. Steidel et al. 1996) are yielding substantial galaxy populations at , radio galaxy samples remain the best means of finding the most massive galaxies at , and even higher.
Hierarchical galaxy formation scenarios suggest that these massive galaxies are assembled from smaller structures at relatively late cosmic epochs (e.g. Baron and White 1987). Observations of HzRGs may thus provide a unique opportunity to study the beginning of this process. Furthermore, when they have been found, HzRGs may also be used for ’color-dropout’ searches of galaxy clusters around them, and begin cluster evolution studies at very high redshift.
2 How To Find High Redshift Radio Galaxies
2.1 Ultra Steep Spectrum Sources
It has been known for many years that radio sources with very steep spectra are mostly associated with faint, distant galaxies (e.g. Tielens et al. 1979; Blumenthal & Miley 1979). An example of a steep radio spectrum, for the powerful nearby radio galaxy Cygnus A, is shown in figure 1. One can also see that the radio spectrum steepens at higher frequency. If all powerful radio galaxies have such curving spectra, due to synchrotron and/or inverse Compton losses, then with increasing redshift we would observe the steeper parts of their spectra. Analysis of the 3CR radio sample indeed showed such an expected correlation (van Breugel and McCarthy 1990; Fig 2 shows an updated version). A similar result has recently been reported for a sample of ultra-luminous radio galaxies at high redshifts (Carilli et al. 1998).


Thus this ultra-steep spectrum (USS) ‘red radio colors’ selection technique may be used as a very effective tool for identifying very high redshift radio galaxies. The first comprehensive USS search for HzRGs was begun by Chambers and collaborators and resulted in the discovery of the radio galaxy 4C41.17 (Chambers, Miley and van Breugel 1990). For many years this was the most distant galaxy known. This relatively bright object, with its extended Ly- halo, radio-aligned UV continuum, and evidence for star formation (see below) in many ways stimulated the continued search for more USS HzRGs.
With the advent of several new, deep radio surveys it is now possible to define much better USS samples which reach 10 – 100 times fainter flux density levels than previous samples, and which allow much more accurate spectral index determinations. We have used several such surveys to define USS samples for study in the northern and southern hemispheres. Our primary northern hemisphere sample uses the WENSS 325 MHz survey (Rengelink et al. 1997) together with the NVSS 1.4 GHz survey (Condon et al. 1998), to define the spectral indices, and the FIRST 1.4 GHz survey (Becker et al. 1995), to obtain radio maps. In the southern hemisphere we use the low frequency Texas 365 MHz (Douglas et al. 1996; Dec ∘) and MRC 408 MHz (Large et al. 1981; Dec ∘) surveys, in combination with the NVSS and PMN 5 GHz (Griffith & Wright 1993; Dec ∘) surveys.
The sources in our southern hemisphere sample all have spectral indices . We have obtained radio images of all our southern targets with the Australia Telescope and VLA so that we can make accurate identifications. A deep near-infrared identification program of this sample was begun with the CTIO 4m telescope. Spectroscopic observations of some objects from this sample with the ESO 3.6 m have shown that USS sample is indeed extremely efficient at finding HzRGs, and have already resulted in the discovery of the most distant radio galaxy in the Southern Hemisphere known to date (TN J13381942 at ; De Breuck et al. , these proceedings). A summary of the current status of HzRG identification programs is given in Table 1.
| Sample | Definition | Known Redshift | Unknown | ||
|---|---|---|---|---|---|
| 3CR | S 10 Jy | 99.5 % | 0.5 % | 0 % | 1% |
| MRC/1Jy | S 0.95 Jy | 93.4 % | 5.9 % | 0.7 % | 41 % |
| 4C USS | 53 % | 35 % | 12 % | 50 % | |
| New USS | 35 % | 35 % | 30 % | 45% (faint) | |

2.2 The Diagram
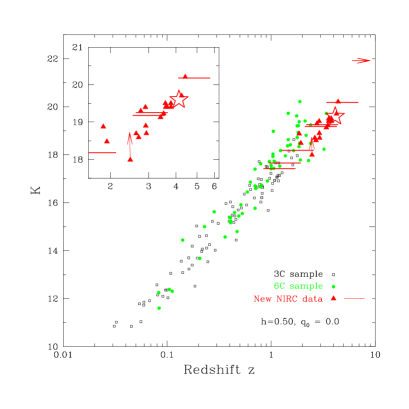
Around the time that 4C41.17 was discovered another systematic search for HzRGs also proved to be successful. This method uses the magnitude – redshift relationship at infrared wavelengths, the ‘Hubble’ diagram, for powerful radio galaxies galaxies to find promising targets. This resulted in the discovery of the radio galaxy B2 0902+34 (Lilly 1988). Indeed, the diagram has since proved to be a very reliable, if little understood, tool. Despite strong morphological evolution seen at near-infrared wavelengths, discussed below, the most powerful radio sources continue to follow the relationship even to z 4.4 (Fig 4). It is our experience that, by combining the USS and techniques and using near-infrared identifications of USS sources which are unidentified on UKST/POSS2 plates, one is virtually guaranteed to be successful in HzRG hunts. Without near-IR identifications and photometry approximately 2/3 of the galaxies are at . With near-IR identifications and photometry one can select the redshift range one wishes to study and to date all galaxies observed at Keck were found to be at the redshift predicted from the diagram, at least for .
3 Morphological evolution of HzRGs
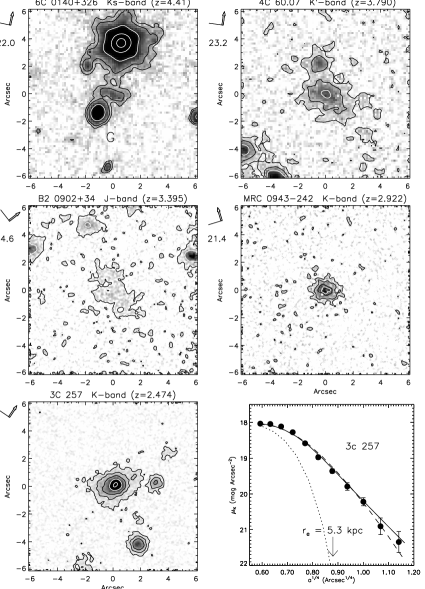
Near-infrared images obtained with the W. M. Keck I Telescope of HzRGs with show strong morphological evolution at rest–frame optical ( Å) wavelengths (van Breugel et al. 1998; Fig 5). At the highest redshifts, , the rest–frame visual morphologies exhibit structure on at least two different scales: relatively bright, compact components with typical sizes of 10 kpc surrounded by large–scale ( 50 100 kpc) diffuse emission. The brightest components are often aligned with the radio sources, and their individual luminosities are to For comparison, present–epoch L⋆ galaxies and, perhaps more appropriately, ultra-luminous infrared starburst galaxies, have, on average, . The total, integrated rest–frame B–band luminosities are magnitudes more luminous than present epoch galaxies.
At lower redshifts, , the rest–frame optical morphologies become smaller, more centrally concentrated, and less aligned with the radio structure. Galaxy surface brightness profiles for the HzRGs are much steeper than those of at . We attempted to fit the surface brightness profiles with a de Vaucouleurs r1/4 law and with an exponential law, the forms commonly used to fit elliptical and spiral galaxy profiles, respectively. We demonstrate the fitting for our best resolved object at , 3C 257 at (Fig 5). Within the limited dynamical range of the data, both functional forms fit the observed profiles—neither is preferred. Interestingly, despite this strong morphological evolution the ‘Hubble’ diagram for the most luminous radio galaxies remains valid even at the highest redshifts, where a large fraction of the K-band continuum is due to a radio–aligned component.
4 Jet-induced star formation in 4C41.17: HST imaging
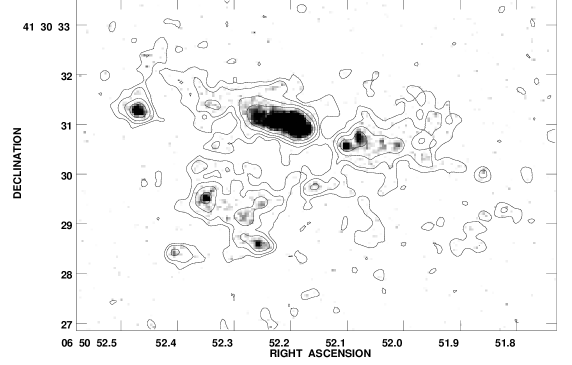
Deep HST images of 4C41.17 at ‘R’-band (rest-frame UV) and in Ly- show that the 4C41.17 system consists of two components: 4C41.17-North with a bright string of UV knots and Ly- emission along the radio axis, and 4C41.17-South with several much fainter UV knots, distributed in random fashion throughout a low surface brightness halo. The brightest radio knot in 4C41.17-North is associated with the brightest UV knot and arc-like Ly- emission. One of the field objects in the HST images was also seen at near–IR (Graham et al. 1994; object # 16) and radio wavelengths (Carilli et al. 1994). This was used to align the HST and radio frames with an estimated relative accuracy of 0.1. The central, radio–aligned UV and Ly- emission is shown in Figure 6 with the 0.21resolution radio X-band image from Carilli et al. overlaid. Figure 7 shows the HST continuum image of the entire 4C41.17 system smoothed to 0.3resolution to enhance low surface brightness features.
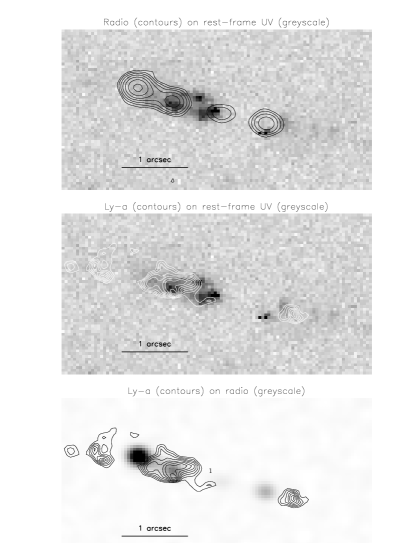
Downstream from the bright radio/UV/ Ly- knot the radio source curves towards a faint, very steep spectrum NE lobe (see Carilli et al. 1994), while upstream from this knot, towards the central radio core, the UV continuum appears edge–brightened. These morphological features suggest a strong interaction between the radio jet and dense ambient gas and, in fact, are as expected in jet–induced star formation models where sideways shocks induce star formation in the dense medium of forming galaxies (e.g. De Young 1989; Bicknell et al. 1998).
The star formation rates () of the various components as deduced from the rest–frame UV HST photometry range from 5 – 40 /yr for the knots in 4C41.17-North, to 5 – 10 /yr in 4C41.17-South. Here we have assumed L Å-1 for a = 1 /yr (Conti et al. 1996) and no dust reddening. The derived values are surely lower limits, given the detection of dust at sub—mm wavelengths in 4C41.17 by Dunlop et al. (1994).
The entire 4C41.17 system is embedded in a common halo of diffuse, low surface brightness emission which extends over a very large area of 54 kpc 76 kpc (5 7). This includes a faint region, 4C41.17-South, with half a dozen compact knots distributed in random fashion. Spectroscopic observations have shown that 4C41.17-South is indeed at the same redshift as 4C41.17-North (Dey et al. 1999). The range of UV luminosities and rates for the individual knots in 4C41.17-South is lower than in 4C41.17-North, and very similar to the ‘normal’ (radio-quiet) Lyman-break galaxies discovered by Steidel et al. (1996). The random distribution and on average lower in the 4C41.17-South knots suggests that star formation here is unaided by bowshocks from the radio jet. The total star formation rate, integrated over the entire 4C41.17 system and including the low surface brightness emission, is 660 /yr. Of this perhaps as much as 2/3 of the star formation may be occurring in the inter-knot regions. If the total star formation would continue at this rate for yrs an entire massive elliptical galaxy of might be assembled between and , consistent with the morphological evolution for HzRGs seen in the near–IR Keck observations.
5 Jet-Induced Star Formation In 4C41.17: Keck Spectroscopy
Deep spectropolarimetric observations with the Keck II telescope by Dey et al. (1997) have provided strong evidence in support of the jet–induced star formation model for 4C41.17-North suggested above on the basis of the HST and radio morphologies. These observations showed that the bright, radio–aligned rest–frame UV continuum is unpolarized (). This implies that scattered AGN light, which is generally the dominant contributor to the rest-frame UV emission in radio galaxies, is unlikely to be a major component of the UV flux from 4C 41.17. Instead, the total light spectrum shows absorption lines and P–Cygni–like features that are similar to those detected in the spectra of the recently discovered population of star forming galaxies at slightly lower () redshifts (Fig 8). The detection of the S V stellar photospheric absorption line, the shape of the blue wing of the Si IV profile, the unpolarized continuum emission, the inability of other AGN–related processes to account for the UV continuum flux, and the overall similarity of the UV continuum spectra of 4C 41.17 and the nearby star forming region NGC 1741B strongly suggest that the light from 4C 41.17 is dominated by young, hot stars. The presence of radio–aligned features in many of the HzRGs suggests, by analogy to 4C41.17, that jet–induced star formation may be a common phenomenon at these very high redshifts.

Acknowledgments
Part of the work described here was performed while WvB was on sabbatical leave during January 1997 – April 1997 at the Anglo-Australian Observatory, the Australian National Telescope Facility, and the Mount Stromlo and Sidings Springs Observatories. He appreciates the support provided by these institutes. He thanks the Kookaburra’s for their wake–up calls, and his Australian colleagues for their warm hospitality and invigorating discussions, with special thanks to Drs. J. Bland–Hawthorn, G. Bicknell, M. Dopita, and R. Sutherland. We gratefully acknowledge S. Rawlings for advance information regarding 6C 0140+326 and 8C 1435+635 and his work on the diagram, and C. Carilli for providing high quality radio images of 4C41.17 which allowed to improve on the relative radio/optical astrometry for this source. The research by WvB, CDB and AS at IGPP/LLNL is performed under the auspices of the US Department of Energy under contract W–7405–ENG–48.
References
- [1] Baron, E., & White, S. D. M., ApJ, 322, 585
- [2] Becker, R. H., White, R. L., & Helfand, D. J. 1995, ApJ, 45, 559
- [3] Bicknell, G.V. et al. 1998, ApJ, (in preparation)
- [4] Blumentahl, G., & Miley, G. 1979, A&A, 80, 13
- [5] Carilli, C., et al. 1998, in Proc. “The Most Distant Radio Galaxies”, Amsterdam, in press, astro-ph/9801128
- [6] Carilli, C.L., Owen, F.N. & Harris, D.E. 1994, AJ, 107, 480
- [7] Chambers, K.C., Miley, G.K. & van Breugel, W. 1990, ApJ, 363, 21
- [8] Chambers, K., Miley, G., van Breugel, W., & Huang, J., 1996, ApJS 106, 215.
- [9] Condon, J. et al. 1998, AJ, 115, 1693
- [10] Conti, P.S., Leitherer, C. & Vacca, W.D. 1996, ApJ, 461, 87
- [11] De Breuck, C., van Breugel, W., Röttgering, H., & Miley, G. 1998, in Proc. Radio Surveys Workshop, Tenerife Spain, ed. M. Bremer (Dordrecht: Kluwer), p 185
- [12] De Young, D. S. 1989, ApJ, 342, 59
- [13] Dey, A., van Breugel, W., Vacca, W., & Antonucci, R. 1997, ApJ, 490, 698
- [14] Dey, A. et al. 1999, (in preparation)
- [15] Douglas, J., Bask, F., Bozyan, F., Torrence, G., & Wolfe, C., 1996, AJ 111, 1945
- [16] Dunlop, J.S. et al. 1994, Nature, 370, 347
- [17] Eales, S., et al. 1997, MNRAS, 291, 593
- [18] Graham, J.R. et al. 1994, ApJ, 420, 5
- [19] Griffith, M. & Wright, A. E. 1993, AJ, 105, 1666
- [20] Kellerman, K. I., Pauliny-Toth, I. I. K, & Williams, P. J. S. 1969, ApJ, 157, 1
- [21] Large, M. et al. 1981, MNRAS, 194, 693
- [22] Lilly, S. J. 1988, ApJ, 333, 161
- [23] McCarthy, P., et al. 1996, ApJS 107, 19
- [24] Rengelink, R., et al. 1997, A&A, 124, 259
- [25] Steidel, C.C. et al. 1996, AJ, 112, 352
- [26] Tielens, A., Miley, G., & Willis, A. 1979, A&AS, 35, 153
- [27] van Breugel, W., & McCarthy, P. 1990, in ASP Conference Series, Vol 10, Evolution of the Universe of Galaxies, ed. R. G. Kron (San Francisco: ASP), 359
- [28] van Breugel, W. et al. 1998, ApJ, 502, astro-ph/9803019