11.05.2, 11.07.1, 11.09.2, 11.16.1, 11.16.2, 11.19.2
F. Combes (e-mail: bottaro@obspm.fr)
Statistics of optical warps in spiral disks
Abstract
We present a statistical study of optical warps in a sample of 540 galaxies, about five times larger than previous samples. About 40% of all late-type galaxies reveal S-shaped warping of their planes in the outer parts. Given the geometrical parameters and detection sensitivity, this result suggests that at least half of all galaxy disks might be warped. We demonstrate through geometrical simulations that some apparent warps could be due to spiral arms in a highly inclined galaxy. The simulations of non warped galaxies give an amount of false warps of 15%, while simulations of warped galaxies suggest that no more than 20% of the warps are missed. We find a strong positive correlation of observed warps with environment, suggesting that tidal interaction have a large influence in creating or re-enforcing warped deformations.
keywords:
galaxies: evolution, general, interactions, peculiar, spiral1 Introduction
Most spiral galaxies that can be traced in neutral hydrogen exhibit a warped plane (e.g. Sancisi 1976; Bosma 1981; Briggs 1990, Bottema 1995). Our own Galaxy is strongly warped from the solar radius (e.g. Burton 1992, Diplas & Savage 1991).
While the wide majority of warps have been detected in HI, outside the optical disks, some optical warps exist (M31, Innanen et al 1982; van der Kruit 1979, van der Kruit & Searle 1981, 82). In our own Galaxy, the stellar disk appears to follow the HI warp (Porcel & Battaner 1995, Reed 1996). The best evidence for warped optical disks occurs in tidally interacting galaxies (for instance UGC 3697, Burbidge et al 1967, or NGC 4656, Weliachew et al 1978). Sanchez-Saavedra et al (1990) have surveyed 86 edge-on galaxies in the northern sky, and claim that about half of the galaxies display some sort of warping of the plane. This high percentage would suggest that most galaxies are warped, since projection effects must mask at least some fraction of the warps, those with line of nodes perpendicular to the line of sight (Sanchez-Saavedra et al estimate that the observed fraction of warps should be multiplied by 1.7 for this). Sanchez-Saavedra et al results were confirmed by Reshetnikov (1995) from the study of a complete sample of 120 northern edge-on spiral galaxies.
Extended warps represent a dynamical puzzle, since they should be rapidly washed out by differential precession, and end up in corrugated disks. Many models have been proposed for their persistence, from an intergalactic magnetic field (Battaner et al 1990), discrete bending modes (Sparke 1984, Sparke & Casertano 1988), misaligned dark halos (Dubinski & Kuijken 1995), or cosmic infall and outer gas accretion (e.g. Binney 1992). Another possibility is that warps are self-gravitating, which reduces differential precession (Pfenniger et al 1994). In any case, the bending of the plane above the equator defined by the inner galaxy allows to explore the 3D-shape of dark matter, and to probe its potential. It is therefore of prime importance to tackle the warp formation mechanisms, and to enlarge the statistical data, especially on optical warps (section 2 and 3). Optical warps are weaker than HI warps and can be easily contaminated by dust or projected spiral arms, when the galaxy is not exactly edge-on; we thus undertake simulations of dusty spiral galaxies, with or without warps, to estimate quantitatively the biases (section 4).
2 Sample and measurements
In order to find a large enough and unbiased sample for optical warps detection, we selected the Flat Galaxy Catalogue by Karachentsev et al (1993) (FGC). This catalogue has been built from the Palomar Observatory Sky Survey and the ESO/SERC survey and contains 4455 galaxies with a diameter larger than 40 and major-to-minor axis ratio 7. The FGC covers about 56% of the whole sky and is about 80-90% complete for the galaxies with blue diameter larger 0.7.
We decided to consider the Digitized Sky Surveys111The Digitized Sky Surveys were produced at the Space Telescope Science Institute under U.S. Government grant NAG W-2166 (DSS) images of the FGC galaxies. Due to a better quality of the photographic emulsions used for the southern sky survey, the galaxies digitized using the ESO/SERC films extend to a surface brightness level slightly fainter than the galaxies measured on the POSS films. Therefore, we selected the Southern Extention of FGC (FGCE) for our study. Our final sample consists of FGCE galaxies with blue angular diameter between 1 and 3 and coordinates , . The sample includes 540 galaxies, which is about five times larger than previously studied samples by Sanchez-Saavedra et al (1990) and Reshetnikov (1995).
We extracted images of all the sample objects from the DSS. The size of each retrieved square area was ten blue diameters of the investigated galaxy. Thus, typical images were pixels, each 1.71.7. Then, we reduced edge-on galaxy images in the MIDAS environment. In total, 526 of 540 sample objects (97.4%) have images suitable for warp detection (the images of the remaining 14 galaxies are too faint and knotty).
For each object we constructed isophotal maps of full square area around the galaxy (with size 10galaxy diameter) and of the investigated galaxy only with the faintest contour corresponding to 2 of the sky level (in densities) near the object. Large-scale maps of full area around the object were used for the study of galaxy environment. According to environment, we separated our sample in three subsamples: isolated galaxies (without companions with angular diameter larger than 1/5 of the primary within 5 optical diameters of the investigated object), non-isolated galaxies (with companions) and interacting galaxies (obviously interacting systems with tails, bridges, envelopes etc.).
From the detailed map of each galaxy we measured the asymmetry index, defined as the ratio of distances measured perpendicular to major axis from maximum intensity to outer isophote – see fig 1. This index somewhat characterizes the orientation of the disk relative to the line of sight together with the amount of dust present in the disk. A larger index corresponds, on average for a given dust content, to a less inclined galaxy.

The identification of a weak optical warp in a galaxy disk is not a simple procedure (for instance, in some cases we could take for a warp a highly inclined spiral arm). We identified a warp simply as a large-scale systematic deviation of galaxy isophotes from the plane defined by the inner (1/2 of optical radius) region of a galaxy. We fixed this plane as the average position angle of elliptically averaged isophotes; the galaxy center is defined as the mean center of averaged isophotes within 1/2 of the optical radius of the galaxy. As a measure of warp we tried to use the difference between position angles of elliptically averaged isophotes of central and outer regions of a galaxy. We found that such an approach leads to a strong underestimate of the actual warp angle. Therefore, we also chose the less objective but straightforward procedure of eyeball estimation of the warp angle from detailed isophotal maps of galaxies. After some experiments we found that for warp angles ( - angle measured from the galaxy centre, between the plane and average line from centre to tips of outer isophotes) larger than 2o-2.o5 such a procedure gives quite reliable results. Our warp measurements refer to outer regions of galaxies with estimated surface brightness level . Due to slightly varying (from field to field) quality and depth of the digitized photographic films one can give only such general estimation of the surface brightness level.
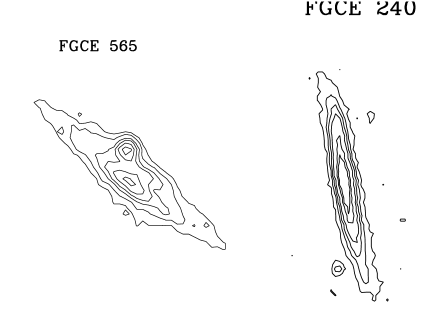
Two types of perturbation of the outer isophotes are distinguished: the S-shaped warp, where the plane of the galaxy takes the shape of an integral sign, i.e. rises on one side, and symmetrically declines on the other. An example is shown in fig 2. The other type is an U-shaped warp, where the two sides rise together (see fig 2). This last deformation is linked in general to a large asymmetry parameter, i.e. means that dust is hiding the far side of the galaxy. We plan to publish isophotal maps of all S-type warped galaxies with 4o in a forthcoming paper ( 60 objects).
3 Results
The general results of our analysis are presented in Table 1.
About a quarter of the sample objects are classified as isolated galaxies (without significant neighbours within 5 optical diameters). This fraction depends on the angular size of galaxies: 18%3% of the galaxies with angular diameter between 1.0 and 1.2, and 34%6% of those with diameters between 1.7 and 3.0 are found isolated. This correlation was also found by Karachentseva (1973) as a function of apparent magnitude: the fraction of isolated galaxies is higher for brighter objects. This is certainly related to the isolation criterium itself, since the companion should be at least 20% the size of the primary, and large galaxies are rarer.
The relative fraction of interacting galaxies - 6% - is compatible with independent earlier estimations (for example, Arp & Madore 1977, Dostal 1979) based on the presence of morphological signs of interaction.
| Isolated galaxies | Galaxies with companions | Interacting galaxies | |
| (N=133) | (N=360) | (N=33) | |
| Fraction | 25.32.2 | 68.43.6 | 6.31.1 |
| Warp type: | |||
| without warp (all) | 426 | 243 | 126 |
| 1.0-1.2 | 4311 | 254 | 2012 |
| 1.2-1.7 | 358 | 284 | 0 |
| 1.7-3.0 | 5112 | 145 | 0 |
| U-shaped (all) | 335 | 363 | 3610 |
| 1.0-1.2 | 3810 | 375 | 3315 |
| 1.2-1.7 | 378 | 385 | 4417 |
| 1.7-3.0 | 248 | 296 | 0 |
| S-shaped (all) | 214 | 363 | 4512 |
| 1.0-1.2 | 197 | 345 | 4016 |
| 1.2-1.7 | 226 | 325 | 5018 |
| 1.7-3.0 | 228 | 529 | 6747 |
As can be seen in Table 1 and fig. 3, a significant fraction of isolated objects (40-50%) does not show measurable warps while among interacting galaxies non-warped objects are relatively rare - 10-20%. On the contrary, the relative fraction of S-shaped warps among isolated galaxies is about 20% only, while among interacting galaxies such objects constitute 40-50%. Non-isolated objects (with close companions but without obvious signs of interaction) are intermediate between isolated and interacting galaxies. The relative fraction of U-shaped warps is the same - 30-40% - for all considered subsamples of galaxies.

In order to check possible observational selection biases leading to an easier detection of warps among nearby and large galaxies, we divided our sample into three parts, according to the angular diameters: from 1.0 to 1.2, from 1.2 to 1.7, and from 1.7 to 3.0. All these samples are of comparable volumes. It is evident in Table 1 that the general observational trends described above do not depend on the angular size of the galaxy.
Fig. 4 presents the relation between the relative fraction of U- and S-shaped warps and the asymmetry index. This index correlates statistically with galaxy inclination - larger values correspond to less inclined disks. As one can see, the detection fraction of S-shaped warps is constant (about 40%) for edge-on galaxies and decreases significantly with decreasing inclination. This reflects obviously an observational bias - difficulty to detect a small optical warp for non edge-on galaxy. On the contrary, the relative fraction of galaxies with U-shaped warps increases systematically with decreasing inclination. We can speculate, therefore, that the U-shaped appearance can be related in many cases to non edge-on orientation (for instance, due to dust influence on the brightness distribution). Anyway, it is evident in fig. 4 that among edge-on warped galaxies dominate objects with S-shaped warps.

The distribution of observed warp angles is peaked at (fig. 5). This value is somewhat smaller than reported by Reshetnikov (1995) (). This difference is quite natural since the present study is based on less deep (in the sense of surface brightness level) material. The right wing of fig. 5 distribution (for ) may be approximated by law. The observed distribution shown in fig. 5 is strongly affected by our detection limit () for the angles . We detected small warps with in very thin, symmetric and nearly edge-on galaxies only.

Fig. 6 presents the distribution of the sample objects according to morphological type given by Karachentsev et al (1993). The figure demonstrates clearly that the morphological classification in the FGCE depends strongly on the angular size of the galaxy: larger galaxies show a flatter distribution, while smaller concentrate near Sc (T5) type. This is a natural observational bias: a detailed classification is much easier for larger objects.

In fig. 7 we plot the relative fraction of S-shaped galaxies as a function of their morphological type. The present statistics do not show any significant correlation between the frequency of warps and the morphological type.

De Grijs (1997) has recently made a deep study of edge-on galaxies, and on a sample of 44 galaxies determined a warp fraction of 64%. This appears somewhat higher than the previous estimations, which could be due to several factors. First his study was made on deeper images, down to blue surface brightness of 27 mag (compared to 25 mag for the other surveys), but this does not seem the essential point, since his detected warps begin at a surface brightness level of between 20 and 24 mag . Second, his sample does not contain only very flat galaxies, since the selection criterion is the blue axis ratio at least 3.1. Although the cataloged inclination is high (), the latter is not well determined; the simulations of the next section have shown that the apparent axis ratio can vary from 9 to 4, at a given inclination between 80 and 85∘, only through variation of the position angle of the spiral arms with respect to the line of sight. For galaxies that are not very flat, the risk to find artificial warps is high (cf fig 10).
To compare our estimation of the warp fraction to that of de Grijs (1997), we have tried to repeat our study on his sample, chosing only the DSS isophotes, as we described in section 2. We find indeed a higher fraction of warps than in the present sample: 7 U-shaped, and 18 S-shaped, i.e. a total fraction of 56%. One of the reason could be small number statistics, and another the selection criteria, in particular concerning the axis ratio. Note that de Grijs (1997) selected non-interacting and unperturbed galaxies, so that no conclusion about environment can be drawn. To better disentangle the effects of dust and spiral features on determined warps, it is interesting to examine the near-infrared images. The latter, however, often do not go as far out in radius as the B-band images; but when it is possible to compare, there is no warp in the K-band (cf Grijs 1997). This is related to the statistical results of Sanchez-Saavedra et al (1990) who find almost half of the edge-on galaxies warped in the blue POSS sky survey, while only one third of them is warped in the red POSS plates (see also Florido et al 1991).
Summarizing the results of three independent surveys of optical warps in galaxies (Sanchez-Saavedra et al 1990, Reshetnikov 1995, and the present study) one can make the following conclusions:
About 40% of spiral galaxies with reveal S-shaped optical warps in their outer parts () with typical amplitudes . This high observable percentage would suggest that a large fraction, more than a half, of all spiral galaxies are warped.
The probability of optical warp detection does not depend on galaxy morphology (for objects later than Sab).
Disks of more massive, large and luminous galaxies are somewhat less warped (from a complete sample of 120 northern spirals with known magnitudes, diameters and maximum rotational velocities according to Reshetnikov 1995).
The detection fraction of S-shaped warps depends on galaxy environment: warped galaxies dominate among interacting galaxies, are very frequent among galaxies with close companions, and relatively rare among isolated objects.
4 Simulations of projection effects
Artefacts due to the nearly edge-on projection of a galactic disk, which is not homogeneous, but with spiral structure and related dust lanes, could in some cases bias the observations, and perturb our statistics on warps; in this section we study these effects, to better subtract the perturbations.
We are particularly interested in the two main projection effects: first, if the galaxy disk is not exactly inclined by , obscuration by dust in the plane affects more the far side than the near side of both bulge and disk. The integrated light maxima are shifted towards the near side, and the isophotes are off-centered especially on the minor axis, since the importance of dust decreases from the center to the outer parts of galaxies. This could mimic a slight bend of the disk in the U-shape type; second, if there exists a somewhat symmetric and contrasted spiral structure in the disk, which is not exactly edge-on, we can confuse the spiral structure for the disk itself, and ”see” the S-shape of the spiral which happens actually to wind in an un-warped disk.
To simulate these effects, we build realistic spiral disks with embedded dust, and reproduce their apparent isophotes as a function of position angle and inclination. The radiative transfer is very simple, including only absorption and no scattering, to give an idea of the first order effets. Scattering has been taken into account in previous modelisations, in order to find clear diagnostics of the dust content of spiral disks (e.g. Byun et al 1994 and references therein). It has been shown that scattering reduces the amount of apparent extinction, and the effect is more important for face-on galaxies, while it is not significant for edge-on disks that concern us here. On the contrary, the effect of spiral structure has not been investigated, and it is of primordial importance here.
4.1 Disk structure
The overall global distribution in radius and height of the light corresponds to an exponential stellar disk
and a spherical Plummer bulge:
The dust is only distributed in the disk, with the same overall distribution, but different values for scale-length and scale-height, and . The density in the disk is then multiplied by the spiral function:
with the possible harmonics 2 and 4 only; the phase is chosen to give a logarithmic spiral, outside of the radius
with = 4kpc (inside the disk is axisymmetric) and the dust spiral has the same shape, with a phase shift, i.e. , with =10∘, to account for the observation that the dust lanes in general lead/trail the stellar spirals.
To explore the influence of the bulge-to-disk ratio, we simulated 3 values of the mass ratio = 0, 0.1 and 0.3. The latter value is already large for the samples we are considering (since we selected very flat galaxies, with axis ratios lower than 0.15, and in average 0.11), but they are instructive and necessary to complete the statistics. We adopt here a constant ratio of 4 between the disk and bulge scale length, i.e. a Plummer parameter = 0.25 . The scales of the stellar and dust disk are =6 kpc, =450pc, = 7 kpc, and = 200pc.
The model galaxies were inclined on the sky to be nearly edge-on, with 5 inclination angles 80., 82.5, 85., 87.5 and 90∘. To estimate the projection effects of the spiral arms, the galaxies were also rotated around their rotation axis, through 9 position angles (from PA = 0 to 160 by 20∘). We finally considered three values of the total dust optical depth at for an edge-on galaxy, = 1, 5 and 10. Taking into account the 3 bulge-to-disk ratios, these tests resulted in 405 galaxy models, from which we estimate statistically the possible projection biases.

4.2 Absorption calculations
Once the stellar density and dust density are settled, the cube representing the galaxy is rotated to the given orientation (PA, ), and the light for any line of sight integrated, taken into account progressively the absorption along the line of sight as
with
Some results are shown in fig 8 for an inclination not exactly edge-on. We can see how projection effects are producing S-shape warps through special viewing of the spiral structure. The effect of dust is revealed in fig 9, where U-shape warps are produced by asymmetric absorption.

4.3 Statistical results
From the 405 models computed, we keep only those flat enough to be compared to galaxies in our sample, i.e. with axis ratio . This is not equivalent to a constrain on inclination only, since it depends on the orientation of the spiral structure with respect to the line of sight, as shown in fig 8. The main result is that projection effects can indeed produce false S-shaped warps in about 50% of cases, but only at low inclination, . At , the false S-shaped warps are around 30%, and they fall to 0% at . It is possible that these figures are overestimating the artefacts, since all model galaxies had a nice contrasted spiral structure, which is not the case in actual galaxies. Our sample of flat galaxies have , and average = 0.11. From the detailed distribution of axis ratios in the observed sample, together with figure 10, we estimate the percentage of false S-shaped warps to 15%.

We also searched for mocked U-shaped warps in those simulations. There were very little, of the order of 6%, although this is subjective. One of the reason is that false U-shaped warps are expected to be due to less inclined dusty galaxies, and in our sample there are only nearly edge-on systems. Secondly, our model galaxies are always symmetrical, and there must be in the observations many U-shape due to intrinsic asymmetries. This is re-inforced by the spiral arm contrast which is constant in our model galaxies, which makes them look more like false S-warps than U-warps, the latter being more frequent for homogeneous disks.
4.4 Simulated true warps
We also considered models with genuine warps, assuming a linear slope for the plane, as soon as the radius is larger than some critical value = 8kpc. The slope corresponds to an angle of = 10∘, to obtain after projection the order of magnitude of those observed in the optical images. We varied the position angle of the warp line of node with the spiral. The outer parts mid-plane altitude with respect to the main plane of the galaxy is then:
We consider only straight line of nodes, which is justified from the survey of Briggs (1990). The HI warps, that the optical warps tend to follow, have a straight line of nodes from R25 to (the Holmberg radius). After , the line of nodes advances in the direction of galaxy rotation, and therefore forms a leading spiral.
A sample of our galaxy models is plotted in fig 11 and 12. This allowed us to determine the number of genuine warps that are visible, compared to those that go un-detected because their maximum height above the plane is along the line of sight. The latter cases suffer a bias against selection in a flat galaxy sample, since the resulting effet is to thicken the apparent plane. From these models, and given the observed axis ratio distribution, we estimate that we do not miss more than 20% of the warps through projection effects.


5 Discussion and conclusion
We have simulated spiral projection effects cumulated to dust-absorption effects on the appearance of warps in inclined galaxies. We find that indeed inclined spirals can mimick warps, but the effect is not so serious for very flat galaxies, at high inclination on the sky. We estimated that no more than 15% of S-shaped warps could be due to this phenomenon. We also emphasize that these projection effects could also subtract some genuine warps from the resulting apparent warp galaxies, and therefore, the effect can somewhat be compensated.
From the simulations of real warped planes, we find that the fraction of missed warps because of projection effects, i.e. those with line of nodes perpendicular to the line of sight, is less than half, contrary to what could be expected. This is due to the fact that a warp along the line of sight thickens the apparent disk, and the resulting galaxy is then not included in the sample of ”flat” galaxies, as we have defined here. We estimate that in our sample, we do not miss more than 20% of the true warps.
Our observed statistics confirm the suspected influence of tidal interactions in warping distortions. The fact that large galaxies appear less warped in average might then be only due to the fact that they require more massive companions, which are less frequent. The fact that most galaxies are warped, even in isolation, confirms the persistence of the perturbation, even if triggered by a companion.
The percentage of warps is also to be compared to the percentage of asymmetric galaxies. Richter & Sancisi (1994) on a sample of 1700 galaxies observed in HI deduced that at least 50% of them show asymmetries, non-circularities, lopsidedness. Zaritsky & Rix (1997) on an optical sample find that 30% of field spirals galaxies exhibit significant lopsidedness at large radii (Zaritsky & Rix 1997); this is attributed to companions. If warps could be attributed to companions, this will be compatible with the fraction of warps that we find, provided that the warp is more long-lived than lopsidedness.
Acknowledgements.
We thank the referee, Roelof Bottema, for his comments that have significantly improved the paper. VR acknowledges support from Russian State Committee of Higher Education, Russian Foundation for Basic Research (98-02-18178) and from French Ministère de la Recherche et de la Technologie.References
- [1] Arp H., Madore B.F., 1977, Quart. J. Roy. Astron. Soc. 18, 234
- [2] Battaner E., Florido E., Sanchez-Saavedra M.L.: 1990, A&A 236, 1
- [3] Binney J.: 1992, ARAA 30, 51
- [4] Bosma A.: 1981, AJ 86, 1791
- [5] Bottema R.: 1995, A&A 295, 605
- [6] Briggs F.H., 1990: ApJ 352, 15
- [7] Burbidge E.M., Burbidge G.R., Shelton J.W., 1967, ApJ 150, 783
- [8] Burton W.B.: 1992, in ”The Galactic Interstellar Medium”, Saas-Fee Advanced Course 21, ed. D. Pfenniger & P. Bartholdi, p. 1
- [9] Byun Y.I., Freeman K.C., Kylafis N.D.: 1994, ApJ 432, 114
- [10] Combes F., 1994, in ”The Formation of Galaxies”, V Canary Islands Winter School, C.Munoz-Tunon and F.Sanchez eds., Cambridge University Press, p. 319
- [11] de Grijs R.: 1997, PhD Thesis, Groningen University
- [12] Diplas A., Savage B.D.: 1991, ApJ 377, 126
- [13] Dostal V.A., 1979, Astron. Zh. 56, 247
- [14] Dubinski J., Kuijken, K.: 1995, ApJ 442, 492
- [15] Florido E., Prieto M., Battaner E., Mediavilla E., Sanchez-Saavedra M.-L.: 1991, A&A 242, 301
- [16] Innanen K.A., Kamper K.W., Papp K.A., van den Bergh S., 1982, ApJ 254, 515
- [17] Karachentsev I.D., Karachentseva V.E., Parnovsky S.L., 1993, Astron. Nachr. 314, 97 (FGC)
- [18] Karachentseva V.E., 1973, Soobsch. SAO 8, 3, 1973
- [19] Lequeux J., Dantel-Fort M., Fort B.: 1995, A&A 296, L13
- [20] Pfenniger D., Combes F., Martinet L.: 1994, A&A 285, 79
- [21] Porcel C., Battaner E: 1995, MNRAS 274, 1153
- [22] Reed B.C., 1996, AJ 111, 804
- [23] Reshetnikov V.P., 1995, A&AT 8, 31
- [24] Richter O-G., Sancisi R.: 1994, A&A 290, L9
- [25] Sanchez-Saavedra M.L., Battaner E., Florido E., 1990, MNRAS 246, 458
- [26] Sancisi R.: 1976, A&A 53, 159
- [27] Sparke L.: 1984, MNRAS 211, 911
- [28] Sparke L., Casertano S.: 1988, MNRAS 234, 873
- [29] van der Kruit P.C., 1979, A&AS 38, 15
- [30] van der Kruit P.C., Searle L., 1981, A&A 95, 105
- [31] van der Kruit P.C., Searle L., 1982, A&A 105, 351
- [32] Weliachew L., Sancisi R., Guelin M., 1978, A&A 65, 37
- [33] Zaritsky D., Rix H-W.: 1997, ApJ 477, 118